
Abstract
The traffic state evolution of urban road network is complicated and varies significantly with different roads, functional zones, and social activities. Considering the regularity of human travel activities, from a long-term perspective, typical traffic state variation patterns for road network could be extracted. In order to extract traffic variation features, spectral clustering technique, an unsupervised learning method, is applied to analyze daily traffic state variation for the region road network based on section-based traffic speed dataset. The proposed method transforms traditional clustering problems into graph partition problems, which is suitable for the clustering problems with multiple attributes by dimension reduction. In this study, five daily traffic state variation clusters are efficiently grouped with different regularities and ranges. The frequency distributions of the sections in each cluster are related with hierarchies, locations, and functions of roads. Long-term heavy-traffic road sections and abnormal traffic state caused by festivals are detected based on the analysis of clusters. The knowledge on the spatiotemporal diversity, similarity, and relativity for network traffic state variation can be naturally discovered. Traffic variation patterns could be incorporated into network-level traffic-prediction and route-guidance algorithms in intelligent transportation systems.
Introduction
With the rapid growth of motor vehicles, recurrent and non-recurrent traffic congestion in urban road network brings about time delay, traffic pollution, and accident risks which are usually caused by the fact that road capacity cannot meet the increasing traffic demand. The conventional methods, like constructing new roads or widening congested roads to improve the road capacity, are becoming costly and improper considering the limited land resources in the cities. 1 Intelligent transportation systems (ITSs), such as advanced traffic management systems (ATMSs), 2 can effectively ease traffic congestion by monitoring and controlling urban traffic condition.
Due to strong recurrent daily activities, urban traffic state variation are actually in regular patterns with repeated emergence, 3 for example the morning and evening traffic peak hours caused by work or school. With the increasing development of advanced traffic-sensing technologies, massive various traffic data can be collected by multiple sensors including microwave radars, video cameras, inductive loop detectors, global positioning system (GPS)-equipped vehicles, mobile phones, 4 from which hidden compact patterns and knowledge can be extracted to support urban traffic management. 5 The extracted traffic patterns are significant for the input of the macroscopic traffic models, traffic flow prediction, and imputation of missing data. 6
Some techniques have been applied for traffic pattern identification, including principal component analysis (PCA), matrix factorization, and clustering. PCA was used to extract features for the network-level traffic pattern recognition. 7 Non-negative matrix factorization was proposed to extract spatiotemporal traffic patterns and conduct long-term prediction. 8 Clustering techniques are widely utilized in analyzing traffic state and uncovering the hidden structures in huge traffic data, realizing traffic jam classification and traffic volume prediction, 9 identifying road traffic state dynamically, 10 extracting daily traffic congestion patterns, 11 and detecting non-recurrent traffic congestion on urban road networks. 12 The dimensions of input data would significantly influence the performance of clustering, especially for the partitional clustering algorithm, and the density of points in the high-dimensional space could be low, which is not appropriate to identify clusters in the sparse space. 13 As for the cluster algorithm, distance functions covering many dimensions of data could be ineffective caused by the noise or uniform distribution of values. 14
K-means, as the most common partitional algorithm, has been applied to extract traffic patterns from historical data due to simplicity, efficiency, and empirical success. 15 For example, K-means and expectation maximization (EM) algorithms were employed to extract an eigenvector from loop detector data describing the traffic condition of the intersection. 16 Freeway traffic flow was divided into five different states with certain safety levels based on traffic occupancy data using K-means, identifying traffic states with high accuracy. 17 However, K-means clustering algorithm, as a greedy algorithm, 15 falls into local optimum when the sample space is not convex and gets unsatisfactory clusters. 18 The computational efficiency of K-means is greatly affected by the dimensions of samples.
In this study, considering the complexity and dynamic of traffic variation for urban road network, the daily traffic patterns are extracted from time-series dataset, and represent the general variation regularity over time. Given the high dimensions of input time-series for daily traffic speed variation, dimension reduction needs to be executed before using the classical clustering methods, such as K-means. To this end, spectral clustering method, which can converge to global optimal solution effectively independent of the sample space shape, is proposed to identify the typical daily traffic variation patterns by transforming traditional clustering problems into graph partition problems and reducing the dimensionality of original time-series speed data via feature extraction. 19
Spectral clustering has been mainly applied in trajectory analysis before, and, for example, it was used to extract trajectory patterns 20 and learn traffic patterns and layout of intersections automatically from vehicle trajectories. 21 The computation efficiency and performance of spectral clustering is better than K-means. 22 Moreover, spectral clustering does not make any assumptions on the distribution of data and mainly focuses on eigendecomposition of similarity matrix.18,22
The main contribution of this study is to extract typical traffic variation patterns from section-based traffic speed data of urban road network, demonstrating the underlying variation characteristic and regularity. Spectral clustering is applied to analyze traffic variation patterns for the regional road network in Beijing during different time periods. Based on the clusters, spatiotemporal distribution features for these patterns are identified, including differences between weekdays, holidays, and road section hierarchies. Long-term heavy-traffic road sections and abnormal traffic state could also be detected based on the clusters. The traffic state variation patterns for road network can be incorporated into network-level traffic-prediction and route-guidance algorithms in ITS.
Characteristics of traffic state variation
Urban traffic system is a complex system with randomness, fuzziness, dynamic, and uncertainty attributes. 10 Regular patterns demonstrating spatiotemporal features could be extracted from the historical traffic data of road network, on account of the strong recurrent activity regularity followed by urban residents.
Traffic state on the road network can be described by a series of traffic parameters including traffic volume, speed, and occupancy. 23 The standards of quantitative identification for the traffic state are not exclusive, and average traffic speed is utilized to describe traffic operation state in this study.
The daily traffic speed variation of weekdays and weekends are compared for three representative sections (a, b, and c) for in Beijing road network, as shown in Figure 1. Section a (East Third Ring Road) is the arterial road, while Section b (South Sanlitun Road) and Section c (Sanlitun Road) are the collector roads. The traffic variation of Section a and b is similar, and the traffic speed on weekend is higher than weekdays, and there exist obvious morning and evening rush hours for the workdays caused by school and work activities. Considering different speed limits, the traffic speed of Section b is generally lower than Section 1. Section c is located in the recreational area, of which the average speed variation is totally different from Sections a and b. There are no morning rush hours for Section c, and generally, the traffic condition in the afternoon and evening is more congested than other time, which is in accordance with the intensity of recreational activities nearby. The statistical analysis for these three sections is shown in Table 1.

Daily traffic speed variation of weekday and weekend for three sections.
Statistical analysis for the hourly average speed of Sections a, b, and c.

Sections in the road network present various daily traffic variations in space and time, which are related with various factors, including daily activities (e.g. work, school, business, and recreation), large-scale social activities (e.g. sports event and vocal concert), holidays, and weather.
Spectral clustering method
Traffic state variation for road network is described by hourly average section-based traffic speed data, and the speed time-series of daily traffic variation for each section could be treated as a single object. 24 The time-series with similar traffic state variation are grouped into clusters using spectral clustering. Sample points in high-dimensional space can be mapped to a low-dimensional space through the eigenvectors of Laplacian matrix derived from similarity graphs 25 and achieve a better clustering performance and a lower computational complexity. 19 In this study, the normalized spectral clustering algorithm (Ng–Jordan–Weiss (NJW) algorithm) 18 is applied for the pattern analysis of daily traffic state variation.
Basic theories
As for spectral clustering, similarity graph is constructed to describe the relationships between any two data points. The dimensions of original data can be reduced through the eigenvectors of graph Laplacian. The transformation of clustering problems can be explained by graph cut theory.
Similarity graphs
First, data points in the original dataset
The goal of spectral clustering is to find efficient graph partition with low-weight edges between different clusters and high-weight edges within the same cluster, namely, the min-cut problem. 19 In this study, fully similarity connected graph is constructed and the weights of edges are calculated by the Gaussian similarity function

where the parameter
Graph Laplacians
The degree of vertex


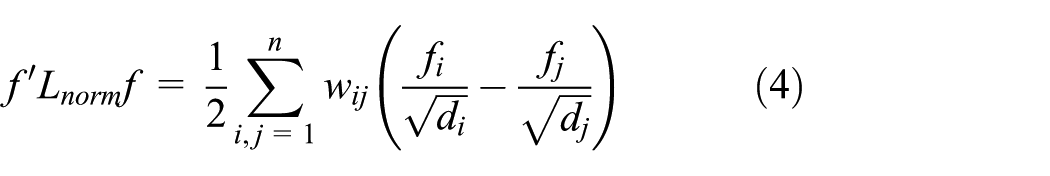
The high-dimensional sample points
Graph cut theory
Normalized spectral clustering algorithm is applied for traffic state clustering by relaxing the normalized cut Ncut, 27 which is defined as

where

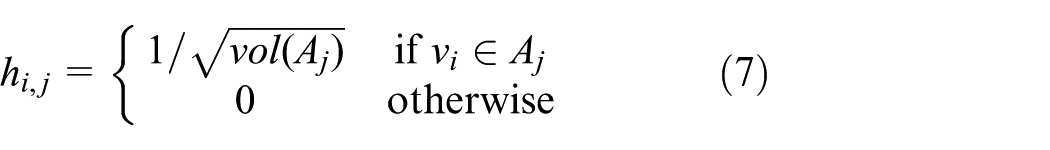
First, the indicator vectors
Given the particular properties of graph Laplacians L

Therefore, the minimizing Ncut problem be equivalent to

The discreteness Ncut problem is relaxed by substituting

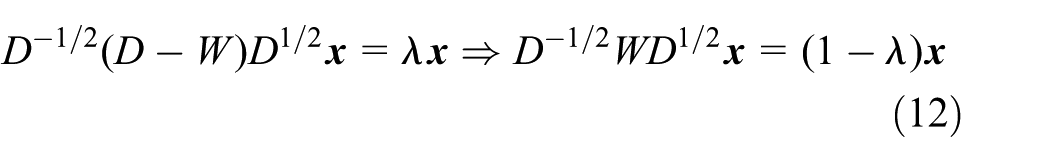
Thus, we get the standard trace minimization problem, and according to the Rayleigh–Ritz theorem, the first k eigenvectors of

which is also equivalent to the k-largest eigenvalues and eigenvectors of
Normalized spectral clustering algorithm
Ng et al.
18
selected the first k eigenvectors and conducted clustering in the space of
Step 1. Transform original data points into undirected graph G. Construct similarity matrix by Gaussian similarity function in equation (1).
Step 2. Construct the degree matrix D, and the matrix
Step 3. Compute the corresponding eigenvectors
Step 4. Normalize the rows of U to unit vectors and get a new matrix
Step 5. Cluster the rows
Step 6. Based on the clustering results in step 5, if the row
Clustering performance index
Different data partitions can be obtained for different input parameter values in the clustering algorithm. The clustering results with the most compact and well-separated clusters can be recommended for the original dataset. Various indices are proposed to pick the best number of clusters for a specific dataset, for example, Dunn, CH, CI, and Davies–Bouldin (DB). 30
In this study, the DB criterion, 31 serving as a clustering index, is picked to evaluate the performance of spectral clustering with different numbers of clusters, which is defined in equations (13) and (14)
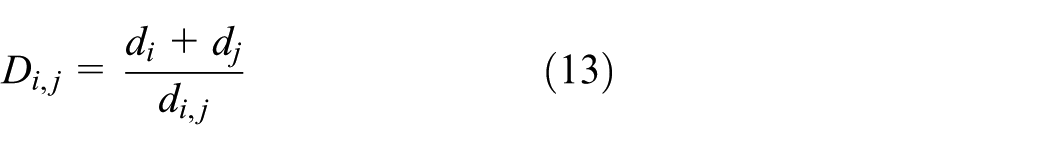

where
Case study
Data description
In this study, daily traffic state variation patterns are extracted from section-based traffic speed dataset. The research area contains 55 road sections, including 33 arterial roads and 22 collector roads in the northeast region of Beijing, as shown in Figure 2. Average traffic speed data is obtained from open data online provided by NavInfo Co., Ltd, which integrates different sources of measured data, including the GPS data of taxis and private cars. The traffic speed data of consecutive 28 days (4 weeks from 28 December 2015 to 24 January 2016) is collected. The number of total input data items is n = 1540 (55 × 28). Each record is a tuple in the form of

Regional road network in Beijing.
Before clustering, traffic speed time-series data is normalized with Z-score normalization technique.
32
The normalized items with similar variation are grouped together by spectral clustering technique. Each data item can be treated as a vertex in the graph. We construct a similarity connected graph
Number of clusters
The clustering performance is highly dependent on the number of clusters. If the parameter k is set too large, then the difference among some clusters would be small. According to the experiments with different parameter settings, considering the visible differences need to be kept among different patterns, the cluster number is set from 1 to 10 in this study.
The experiments with different numbers of clusters are completed, and the corresponding DB index values are shown in Figure 3. The DB index value reaches the lowest when the cluster number is 5, representing the optimal clustering performance, as shown in Figure 3. Therefore, daily traffic speed variation in the regional road network for 4 weeks is finally clustered into five groups.

DB index values according to different cluster numbers.
Analysis for clusters
The size of five clusters is not uniform, and the elements for each cluster are significantly heterogeneous, as shown in Tables 2 and 3. The number of daily traffic speed variation time-series for Clusters 2 and 3 occupy 71.7% of the total, signifying that the daily traffic speed variation of patterns 2 and 3 occur most frequently in this road network. Each cluster consists of the daily traffic speed of different sections for different days. The daily traffic state variation of one section may belong to different clusters for different days, for example, Sections 2, 6, and 10 are found in both Clusters 3 and 4. The frequency distributions of the sections in each cluster are different, for example, the frequency distributions of Clusters 2 and 3 are shown in Figure 4.
The number of daily traffic speed variation time-series for each cluster.

Road section ID for each cluster.

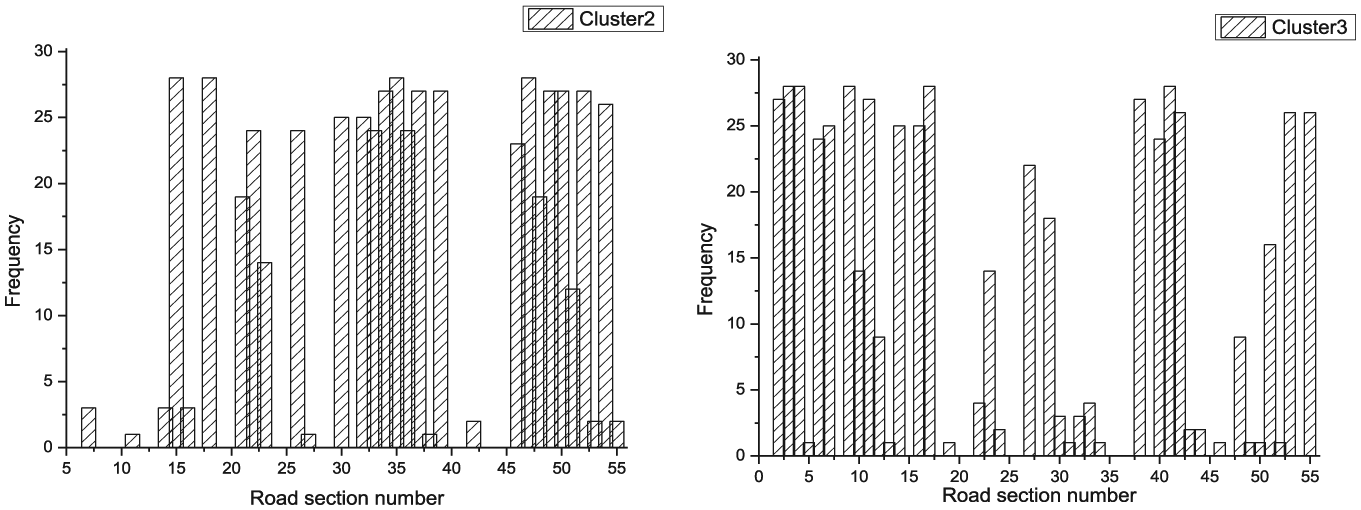
The frequency distribution of Cluster 2 and Cluster 3.
Each cluster has a centroid, and the centroid set of clusters is defined as

Average traffic speed of clustering centers (km/h).
There exist significant gaps in traffic speed values of different clustering centers, signifying the fluctuation features and ranges of daily traffic state for each cluster, and traffic congestion levels of different clusters. The hourly average traffic speed values of each cluster center drop to the bottom between 18:00 and 19:00 (except the center of Cluster 5), which is in accordance with evening traffic peak hour. In addition, the traffic speed of the cluster centers in the daytime is lower than that of nighttime.
Spectral clustering technique can detect the key features of traffic dynamic for urban road network. Actually, the data points in Figure 5 are just the centers of five clusters, and the speed variation for five clusters is quite different from each other. In order to present the speed variation characteristics for clusters, Sections 1, 15, 3, 5, and 25 with the highest frequency in Clusters 1, 2, 3, 4, and 5 are treated as the representatives to demonstrate the traffic state variation on 11 December, as shown in Figure 6. The speed range and fluctuation trend of five representative sections is obviously different from each other, caused by different locations, road hierarchies, and functions. Section 1 with the lowest speed in Cluster 1 locates in the center of the entertainment districts, while the traffic state of Section 25 is quite smooth the whole day. The traffic speed of Sections 3 and 5 all belonging to main road reach the bottom at evening rush hour on account of huge traffic for working or recreational travels. In general, the traffic speed values vary in a particular variation for each cluster, and the curves do not get crossed with each other. Clusters 1, 2, 3, 4, and 5 can be viewed as five typical daily traffic variation patterns, which are set as patterns 1, 2, 3, 4, and 5, respectively.

The representative daily traffic state variation for five clusters.
Spatial and temporal distribution of patterns
The spatial and temporal distribution features of the daily traffic variation in each cluster are detected based on the clustering results above. The daily speed variation of one section could be attached to different patterns for different days, and the traffic speed variation of the sections in the regional network for 1 day belongs to different patterns as well. The distribution of patterns provides insight into various long-term or short-term features of the regional road network, which can be applied for traffic prediction and route guidance in the urban road network.
Spatial distribution characteristics
Differences of sections
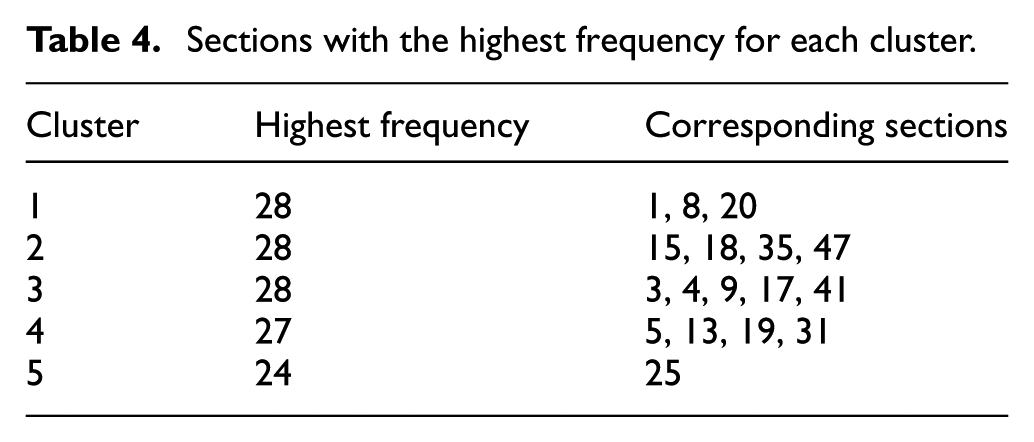
The frequencies of different sections for each cluster vary greatly, and the sections with the highest frequency for each cluster are shown in Table 4. There exist several sections completely belonging to one pattern, representing that the daily traffic speed fluctuation of these sections keeps steady for 4 weeks. The daily variation in 4 weeks for Sections 1, 8, and 20 totally belongs to pattern 1 and stays quite congested condition in long term with an average traffic speed of 25 km/h, and thus, traffic management measures need to be carried out to ease congestion. Similarly, Sections 15, 18, 35, and 47 totally belong to pattern 2, and Sections 3, 4, 9, 17, and 41 belong to pattern 3.
Sections with the highest frequency for each cluster.
The traffic state variation of some sections stay in one pattern in most cases, while that of several days belong to other patterns, which can be treated as abnormal traffic states. For example, the daily variation of 27 days in Sections 34, 49, 50, and 52 belongs to pattern 2, while 1 day left (3 January 2016) for the four sections belongs to pattern 3. The reason is that traffic for work and school is reduced on New Year’s holidays, improving traffic condition. Conversely, the traffic state variation of Section 39 belongs to pattern 2, except that of New Year’s day being attached to pattern 1, because Section 39 is next to a park where celebration activities attract a large number of tourists, seriously affecting the traffic conditions. Therefore, the effect on traffic state caused by holidays vary from sections to some extent, and meanwhile, we can detect the main function of different sections, that is, Sections 34, 49, 50, and 52 are for work or school traffic, while Section 39 is mainly for the tourism traffic.
Section connectivity within the clusters
The sections with the occurrence frequency of 24–28 for Clusters 2 and 3 are treated as highly belonging to patterns 2 and 3, marked in red, as shown in Figure 7(a) and (b), respectively (the study road network area is surrounded by the blue links). Obviously, these sections are connected in part, sharing the same daily traffic state variation pattern. Thus, we can infer that the traffic state variations of adjacent sections are relevant, and thus, the clustering technique can be applied for region division with similar section-based traffic state variation in large-scale road network.
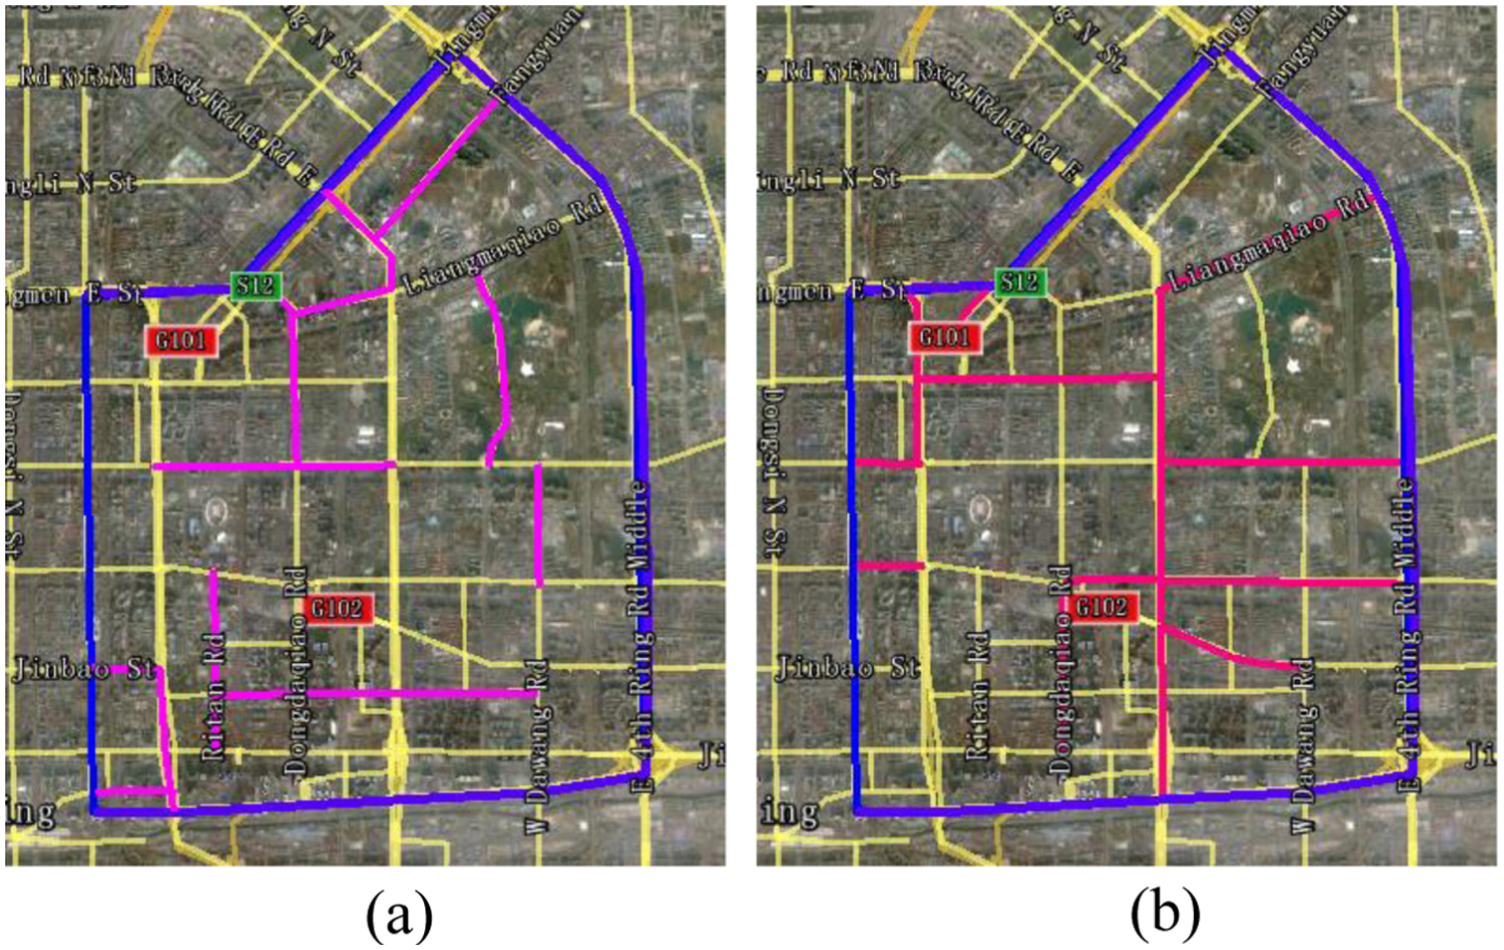
Sections with high occurrence frequencies in Clusters 2 and 3 (red highlight): (a) pattern 2 and (b) pattern 3.
Road hierarchy composition for each cluster
Roads of each hierarchy play specific roles in the urban road network, and generally present different traffic state variation patterns. The study area includes arterial roads and collector roads, and the frequency proportions of these two hierarchies of roads in each cluster are shown in Figure 8. The proportions of arterial roads in the latter patterns are higher than the former patterns, and pattern 5 consists of arterial roads completely. On the contrary, the collector roads account for the largest proportion in pattern 1. The traffic speed values increase from pattern 1 to pattern 5 on the whole. Thus, the daily traffic state of collector roads tends to keep lower speed than arterial road, which is in accordance with road design specifications.

Road section proportions of different hierarchies for each cluster.
Temporal distribution characteristics
Different patterns are involved in the daily traffic variation at the road network level for each day. The frequencies of each pattern from Monday to Sunday for 4 weeks are shown in Figure 9 to reflect the temporal distribution. Obviously, there is no apparent difference among the pattern distribution from Monday to Sunday. Patterns 2, 3, and 4 occupy the main components of network traffic condition for 1 day.
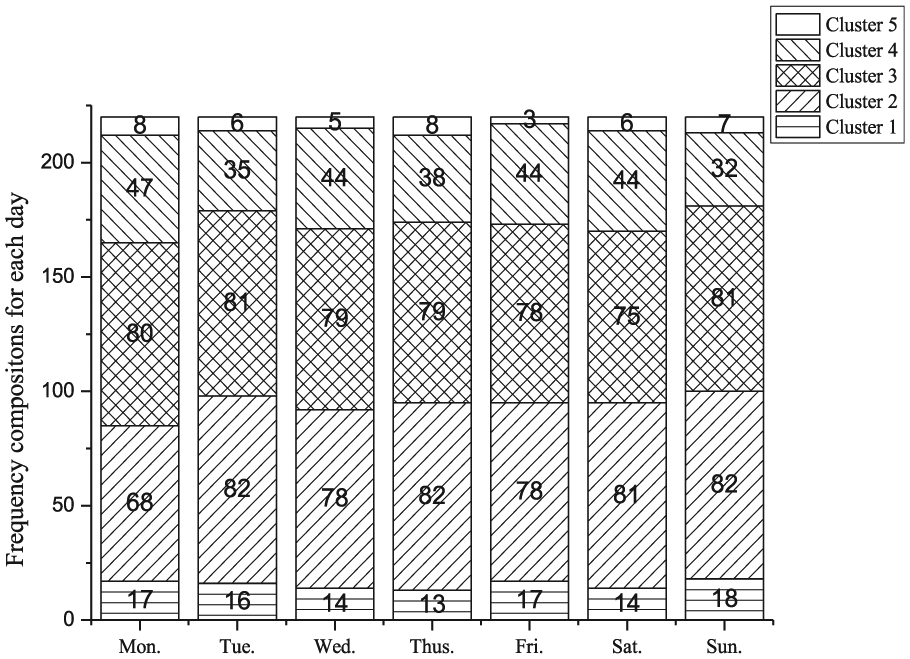
Frequencies of each pattern from Monday to Sunday for 4 weeks.
Considering the impact on traffic state caused by New Year’s holiday, pattern distribution for holidays is compared with that of non-holidays. Taking the first week, for example, as shown in Figure 10, the former 4 days are working days, while the latter 3 days are holidays. Notably, there is no section belonging to pattern 5 on Friday (1 January 2016, New Year’s day). Holidays may lead to the worse traffic state at network level.

Frequencies of each pattern from Monday to Sunday for the first week.
Conclusion
In this study, spectral clustering is applied to analyze daily traffic state variation and extract typical patterns for the urban region road network, and it transforms traditional clustering problems into graph partition problems and is suitable for extracting traffic variation patterns with multiple attributes in high-dimensional space.
Five typical daily traffic state variation clusters with different regularities are grouped together. The size of five clusters is not uniform, and Clusters 2 and 3 are the most frequent occurrences, occupying 71.7% of the total. The elements for each cluster are heterogeneous, and the frequency distributions of the sections for each cluster are related with road hierarchies and functions. Significant traffic speed gaps exist among different clusters, signifying traffic congestion levels of different clusters. The spatial and temporal similarities of road network traffic state are extracted, and long-term heavy-traffic road sections and abnormal traffic status caused by holidays and festivals are also detected based on the clusters.
The spatiotemporal diversity, similarity, and relativity of urban road network traffic state variation could be uncovered by clustering analysis. The daily traffic state variation patterns for road network provide bases for urban traffic management and control. The spatiotemporal traffic variation patterns for large-scale road network can be incorporated into traffic-prediction and route-guidance algorithms in the future work.
Footnotes
Academic Editor: Xiaobei Jiang
Declaration of conflicting interests
The author(s) declared no potential conflicts of interest with respect to the research, authorship, and/or publication of this article.
Funding
The author(s) received no financial support for the research, authorship, and/or publication of this article.