
Abstract
Diesel particulate filter is impedance to elastic wave. In order to promote the anechoic performance of diesel particulate filter in designing process, the acoustic characteristics of which were analyzed on the basis of acoustic four-terminal method. The transfer matrix of simplified diesel particulate filter structure was derived to construct the acoustic simulation model, and a two-load experiment of impedance tube was implemented to calibrate the simulation model. On this basis, the correlation between diesel particulate filter structural parameters and acoustic characteristics was investigated. The results show that the transmission loss is sensitive to porosity, gap, layer thickness, and aspect ratio of porthole for a certain diameter diesel particulate filter. Furthermore, two types of diesel particulate filter structures which were octagonal inlet matches square outlet and asymmetric square channels possess superior noise elimination effect compared with the traditional square channel types. At a certain frequency range, the peak noise was reduced by 2–3 dB. The study could provide guidance to the designing of diesel particulate filter anechoic performance.
Keywords
Introduction
The wall-flow diesel particulate filter (DPF) is a kind of honeycomb structure made of ceramic cordierite or silicon carbide; the ends of all channels in particulate filters are alternatively plugged. The exhaust gas is forced to permeate through the filter wall after flowing into the inlet of channel and then expelled from the outlet of neighboring channels. Acoustic response of exhaust gas would change after traversing the DPF; in addition, the variable properties of the porous substrate would play an important role on the acoustic characteristics. 1 The reduction of the exhaust noise from diesel engine is mainly managed by proper exhaust silencer design, while less attention is paid to the acoustic performance of the after treatment devices (ATD). The transmission loss of a typical ATD unit can be quite significant. It has been widely proved from theoretical and experimental approaches 2 that a DPF used on a vehicle will affect the acoustic emission of the diesel engine, so it is important to investigate the sound propagation rule in DPF and further to propose the optimum DPF design. 3 The amount of different parameters determining the noise reduction capabilities of DPF makes its optimization a complex task. The ability and design flexibility of the system for noise reduction is based on both reactive and dissipative properties 4 and has been widely proved from theoretical and experimental approaches. 5 At present, extensive literature is available on the materials, regeneration, and pressure drop of the DPF, improving the trapping efficiency, optimizing the fuel injection control strategy, regeneration method using combustion additives, and so on.6–11 Studies on the acoustic performance of a DPF are, however, rather limited. The authors have compiled a selective sample of recent papers which provide background information and useful cross-references on the subject.
Allam and Åbom 12 presented a first attempt to describe the acoustic behavior of DPFs by a two-port model, and the model neglected wave propagation and treated the filter as an equivalent acoustic resistance. The transmission loss of the model agreed within 1 dB with measured data on a typical filter. Based on the one-dimensional (1D) acoustic model, Allam and Åbom 13 improved the computational accuracy of thermal loss along the narrow channels according to the manner of the Zwikker and Kosten theory, and the computing frequency of the model was up to 800–1000 Hz. On the basis of 1D model, Hua et al. 14 took the effect of inlet and outlet flow and viscous effect of pipeline into consideration, recalculating the transfer matrix of DPF to get the transmission loss of particulate trap system. Gao et al. 15 created a calculation model of the particulate filter transfer matrix and calculated the insertion loss and transmission loss. The accuracy of the 1D acoustic model was verified by experiment. Gong et al. 16 applied the finite element method (FEM) to get muffling characteristics and transmission loss of DPF, and the effects of structural parameters on muffling characteristics in the radial rotatable DPF were studied by grey relational analysis. Hua et al. 17 predicted the transmission loss of silencer systems that incorporate DPF using numerical simulation, and the analysis demonstrated that plane wave propagation according to the model developed by Allam and Åbom could be assumed in the DPF regardless of the diameter of the DPF. Munjal 18 presented an 1D plane wave analysis and made use of an analogy to a two-duct perforated cross flow element, which validated by three-dimensional (3D) FEM. Hynninen and Åbom 19 drew attention to the acoustic performance of particle oxidation catalyst which was a new alternative to the conventional DPF, and two models were built up based on the classical Kirchhoff solution for prediction of the acoustic wave attenuation in narrow channels and the lumped acoustic resistance obtained from the pressure drop measurements, respectively. In the research of correlation between DPF structure and the flow characteristic and pressure loss. Wurzenberger and Kutschi 6 reduced the pressure drop and extended the service life of DPF according to optimization geometry of filter channel. Zhang et al. 20 performed computational fluid dynamics numerical simulations for a DPF with asymmetrical channels as well as for a DPF with symmetric channels, and the simulation results show that for the partial DPF with an asymmetrical channel, the pressure loss was higher than for a regular DPF under similar conditions. Konstandopoulos and Kostoglou 21 presented and validated a generalized model for soot deposit growth dynamics in asymmetric and variable cell geometry DPFs, and their theoretical description of DPF model can be employed to design new DPF configurations with substantially lower pressure drop than existing designs. Torregrosa et al. 22 assessed the transient fluid-dynamic behavior of wall-flow DPF using experimental and modeling techniques. A phenomenological methodology that allows for the sound extrapolation of experimental results to flow conditions different from those used in the measurements was proposed in later works, 1 good accuracy in the results was obtained for the covering variations in pressure pulse amplitude and duration, as well as in mean flow of different exhaust after treatment systems.
The existing investigates has improved the modeling method of DPF, without discussing the effects of structural parameters on the acoustic properties further. On the basis of predecessors’ work, a four-terminal grid transfer matrix and acoustic FEM were taken to establish the acoustic model of a DPF. It also investigated the relationship between the structural parameters of DPF and trap acoustic characteristics, hence providing theoretical support to achieve noise elimination function of DPF.
Transfer matrix formulation of DPF
Fundamental assumption
The geometrical situation given by a pair of DPF inlet and outlet channels is sketched in Figure 1. The inlet channel is plugged at the end of the filter and the outlet channel is plugged at the inlet. As analyzed above, the honeycomb structure would influence acoustic performance act as a silencer in the exhaust system.

Structural illustrations of traditional DPF (left) and schematic view (right).
When staying in the plane wave region at the inlet and outlet of the silencer, the silencer can be described by a two-port theory in the form of either the scattering matrix or the transfer matrix. A transfer matrix model for the whole DPF has been established to predict the acoustic performance. The model was valid in the low-frequency range where the wavelength was much larger than the length of the filter unit. Typically, for an automobile filter this meant up to 200–300 Hz in cold conditions and 400–600 Hz under operating conditions. The proposed transfer matrix model was based on the following assumptions:
Plane wave supposition. In the model, only plane acoustic waves were considered. The sound wave was transmitted in the form of plane wave in the particle filter, and at any point on the cross section of the pipe, the sound pressure and particle velocity were identical.
Linearization hypothesis. Linear acoustics was valid and the Mach number was small (<0.1). The linear wave equation can be used to describe the propagation of acoustic waves in a particulate trap, and it was assumed that, in the sound wave transmitting, the change of sound pressure was small. High-order quantities in the sound pressure and particle velocity can be ignored.
Lossless hypothesis. It was assumed that in the process of acoustic waves propagation in the DPF, the sound waves was energy losslessness. It means that sound energy would not radiate into the boundary condition through the filter wall without sound absorption caused by the viscosity and heat transfer. Gradients (temperature, mean flow speed) in the axial direction were neglected and the effects of chemical reactions were neglected.
Four-terminal grid transfer matrix
Four-pole transfer matrix
According to the plane wave assumption, the acoustic condition on any sections along the pipeline system can be described by two state parameters that were the pressure p and the volume velocity u. For any special part by the assumption of the linear hypothesis, state parameter on both sides of the interface should be linearly dependent. For a given element, the state parameters of one end can be acquired by the other end. The characteristics of any given unit are equivalent to a four-terminal network. Acoustic units are as shown in Figure 2, where the pi − 1 and ui − 1 were the sound pressure and normal particle velocity, respectively, at the inlet of element, and pi and ui were the corresponding quantities at the outlet.

Acoustic units of four-terminal network.
The functional relation between sound pressure and velocity can be expressed as equations (1) and (2) 23


Under the matrix form

where [


Based on the acoustic transfer matrix, the pressure and velocity at one end of the unit can be calculated by the pressure and velocity at the other end. On both sides of the transfer matrix, there were two input and two output parameters, interrelated by the transfer matrix. Therefore, this method was called transfer matrix method, also known as the four-pole method. If a system contains N acoustic elements with the transfer matrix of each element having obtained, then the transfer matrix for the whole system can be expressed as equation (5) 25

where [
The transfer matrix can be used to calculate the muffling characteristics of the muffler components. Through the transfer matrix method, sound pressure and velocity at the outlet part of system can be obtained by inlet sound pressure and velocity of muffler components. On the contrary, muffling characteristic parameter of the muffler components can be obtained between acoustic source and response by the transfer matrix method.
Mathematical calculation model of transmission loss
The transmission loss of the DPF refers to the difference between sound power levels of incident and transmitted sounds at inlet and outlet sections. The amplitude of the transmission loss was only related to the noise elimination structure rather than acoustic source characteristic, which reflected the impedance characteristic of the silencing structure.
Transfer matrix theory of DPF was established by Allam and Åbom.
12
The particulate filter was divided into
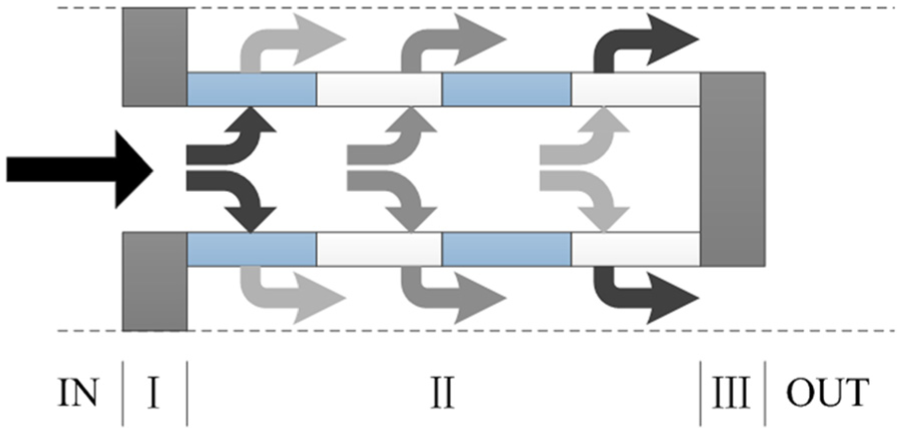
Transfer matrix diagram of diesel particulate filter.
The transfer matrix of the DPF was expressed as equation (6) 26

where

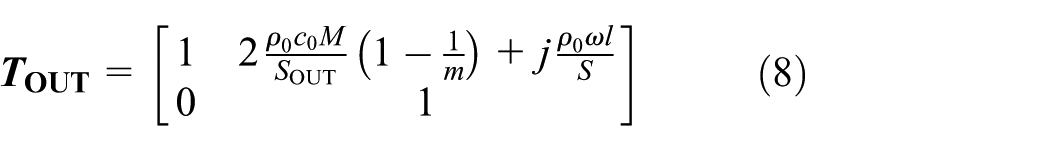
where M, c0, m, SIN, and SOUT were Mach number, the speed of sound, the open area ratio, and the total cross-sectional areas of the inlet and outlet ducts to the particulate filter, respectively.

where ρ0, ω, S, and j are air density, angular frequency, cross-sectional area of the channel of particulate filter, and the imaginary unit, respectively.
For a given vibration velocity v1 at the basic unit, LMS Virtual. Lab code was used to build acoustic model for acoustic pressure and particle vibration velocity calculation at the inlet and outlet of a particulate filter. The acoustic resistance of the wall was approximated by Darcy’s law.
Thermo-viscous friction inside the micro channel of DPF should be included; this would influence the air density and speed of sound in the acoustic model. The two parameters would obtain according to the Kirchhoff’s solution in cylindrical ducts as equations (10) and (11) 14


where


where
A unit velocity


where p1 and p2 were acoustic pressure at the inlet and outlet ports of particulate filter, respectively. Equation (15) was a rearrange form of four-pole network under the condition of only the velocity boundary condition was acquired. Transfer matrix

Therefore, the acoustic transmission loss for the whole particulate filter could be calculated by equation (17) 14

Establishment and experimental verification of DPF acoustic model
Establishing DPF acoustic model
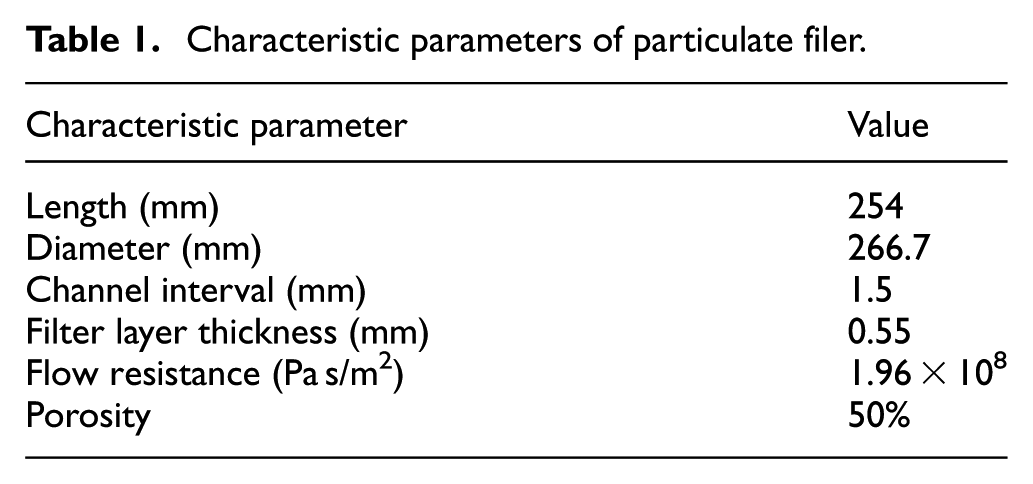
The acoustic characteristics of the filter body of the particulate filter have been investigated, without considering the pipes and the external collector. The relevant parameters of the particulate filter body can be seen in Table 1.
Characteristic parameters of particulate filer.
Due to the large size and thin filter layer of the particulate filter, detailed meshing would generate huge number of meshes which was time-costing to calculate the result. Therefore, the 1/64 grid slice mesh of the whole structure was selected by symmetry structure for model simplification based on constant geometric size of particulate filter.
Figure 4 shows the finite element model of the DPF. Boundary conditions at inlet and outlet ends were defined as unit vibration velocity and full acoustic absorption non-reflection, respectively. The outer wall were defaulted as rigid walls, for the closed ends of the inlet and outlet ports of filter, defining the symmetry plane as symmetrical boundary condition. The inlet and outlet sound pressures of particulate filter by simulation were substituted in equation (11) to calculate the transmission loss. The number of nodes in the FEM model was 100,942, and element number was 89,297.

Acoustic finite element model of 1/64 particulate filter.
Transmission loss test of particulate filter
The acoustic transmission loss of the particulate filter under non-flow conditions was measured by impedance tube measurement system e4206T from B&K Denmark. Figure 5 shows transmission loss test of particulate filter. Two-load method was applied to simulate different impedance boundary conditions including the opening and sponge block in the end-pipe of the particulate filter.

Transmission loss test of particulate filter: (a) testing principle and (b) testing site.
Figure 6 shows the comparison between simulation result and experimental data of transmission losses. In the whole frequency range, the phase and amplitude of the wave peak and trough were the same. The connection pipes in the experiment would influence experiment result, and the pipes must take simulation model into account. In different frequency domains, simulation result of transmission loss was consistent with experimental data. For a regularity research, the mismatch in certain frequencies was within the acceptable range. The acoustic transmission loss model met the requirement for acoustic characteristics researching of particulate filter.

Simulation result and experimental data of transmission loss.
Influence of DPF structure parameters to acoustic characteristic
Structural–acoustic correspondence analysis
Equation (9) showed that transfer matrix was relevant to cross-sectional area and length of particulate filter. The obtained transfer matrix as equation (16) and transmission loss equation were simplified to derive equation (18)

Equation (14) was substituted into equation (18) to derive equation (19)

Equation (19) showed that transmission loss was relevant to impedance and inlet and outlet acoustic pressures of particulate filter. The inlet and outlet acoustic pressures were measured to derive transfer matrix, thus calculating transmission loss. Acoustic wave was affected by friction and viscous effect on the propagation in filter. Acoustic energy was transformed into heat energy because of reflection and attenuation. With the increase in frequency, the wavelength of acoustic wave decreases to result in the change of conductivity in the filter, thus affecting friction and viscous effect. Therefore, transmission loss was relevant to conductivity and cavity volume of particulate filter.
The work discussed the effect of the conductivity, cavity volume, and cross-sectional area of the particulate filter to the transmission loss based on research of acoustic performance by controlling inlet and outlet pressures. Specifically, the porosity and channel length-to-diameter ratio were related to the conductivity. The cavity volume of the particulate filter was relevant to channel geometry, channel interval, and aperture ratio. According to the structure and acoustics correspondence study, the changing law of the acoustic characteristics of the filter was obtained, which provides a theoretical basis for the low noise design of the particle catcher. Meanwhile, the structural parameters were altered to change the inlet and outlet pressures, thus influenced transmission loss of the particulate filter.
A structure–acoustic correspondence analysis of DPF was arranged as shown in Table 2. Channel geometry (CG), 21 channel interval (CI), filter layer thickness (FLT), channel length-to-diameter ratio (CL-DR), and porosity (Por) were chosen as structural factors to be discussed.
Orthogonal table for DPF structural factors.
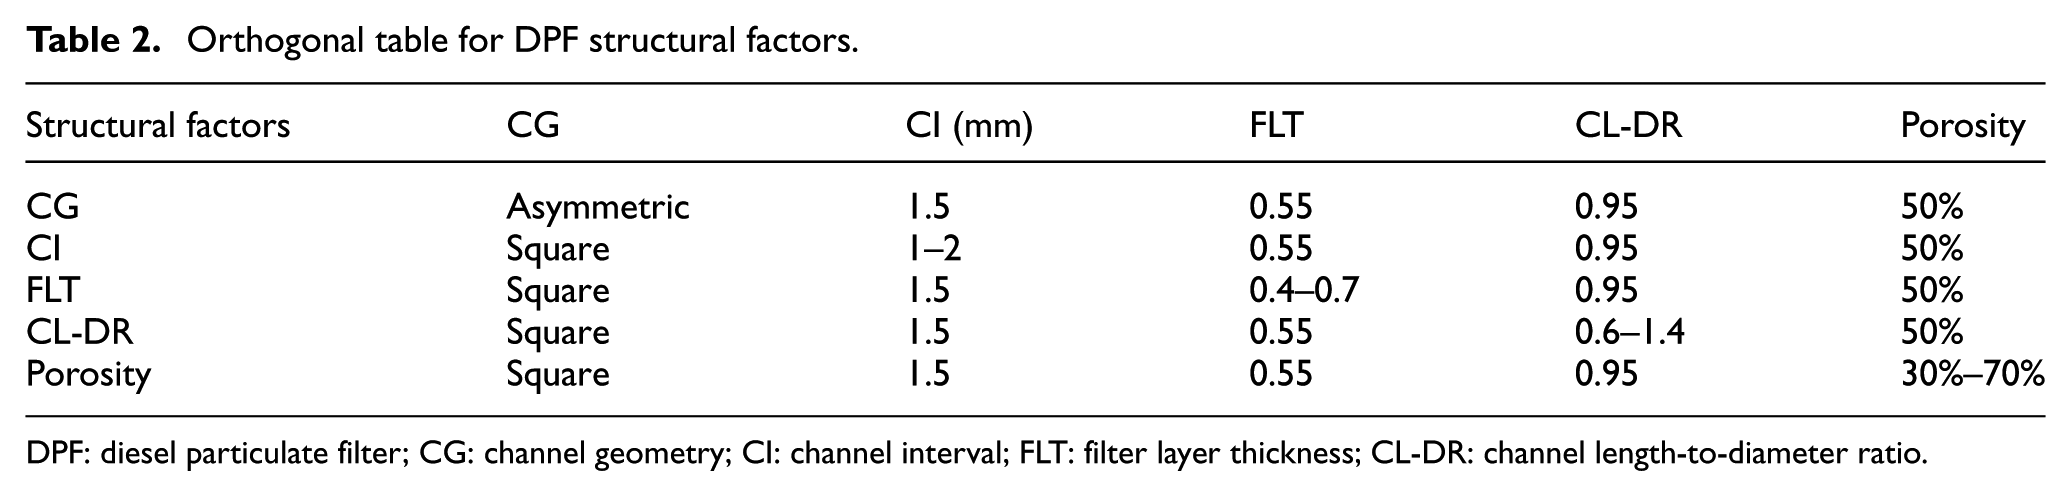
DPF: diesel particulate filter; CG: channel geometry; CI: channel interval; FLT: filter layer thickness; CL-DR: channel length-to-diameter ratio.
Asymmetric and variable cell geometry channel
Various channel geometries were described in the literature while most of which was square cell shape. Asymmetric cell design was introduced under the pursuit of providing additional filtration area and storage space for the ashes that inevitably accumulate in the DPF.6,30–32 In the asymmetric DPF design especially the asymmetric hexagonal shape configuration were more inlet channels than outlet channels to obtain larger filtration area. Table 3 shows four typical types of asymmetric and variable cell DPF layout.33,34 The variable cell configuration introduces the concept of two different types of inlet channels and one type of outlet channel.
DPF cell configurations.
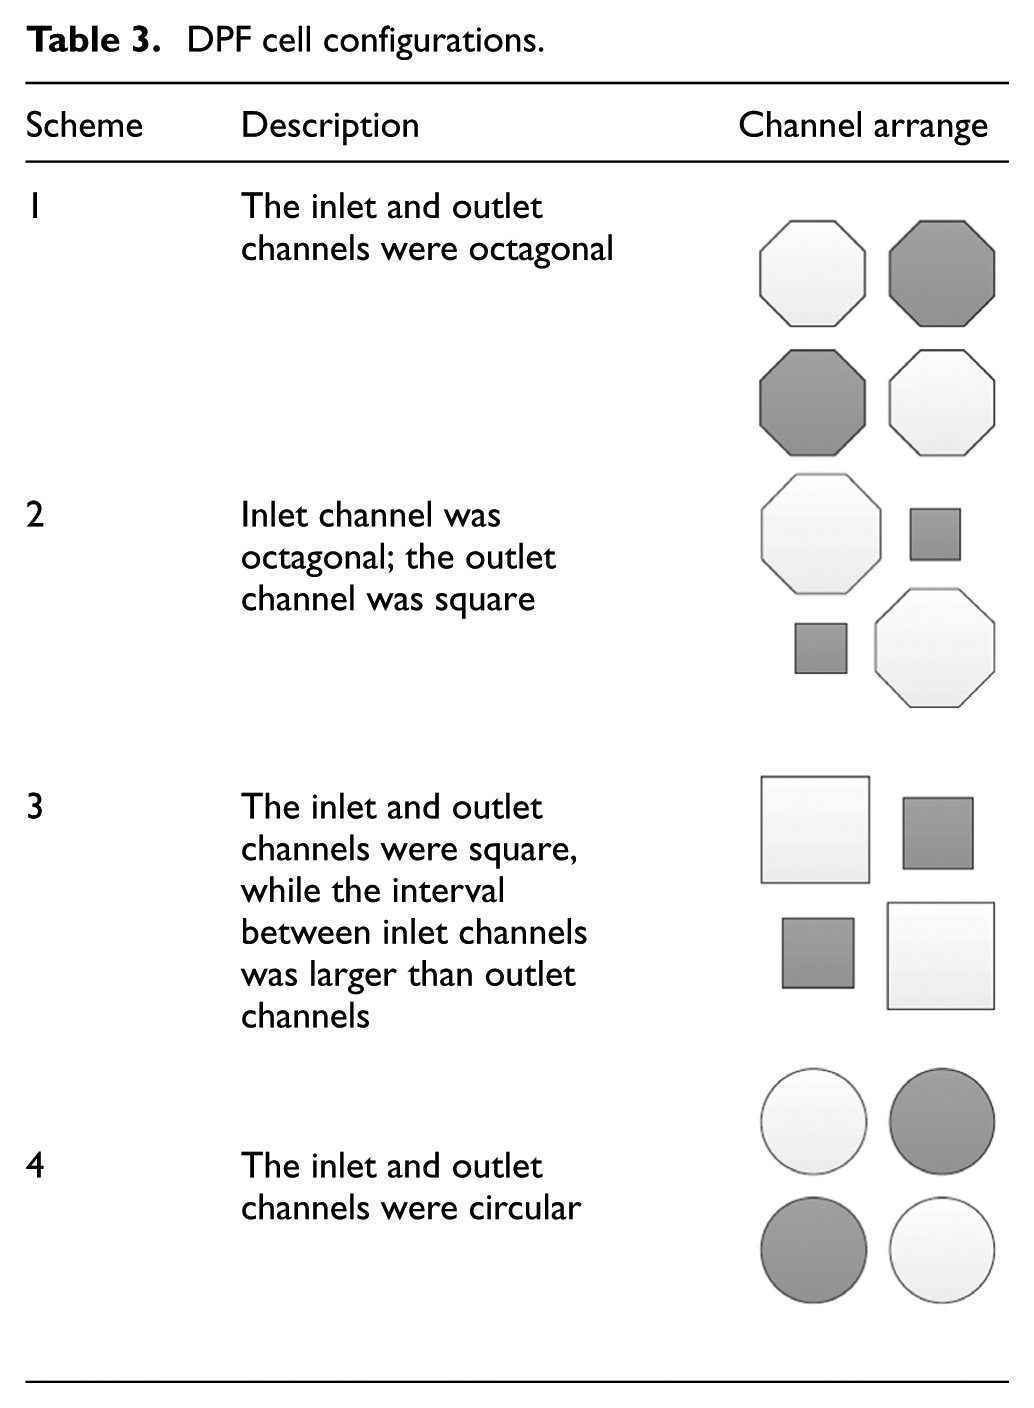
Figure 7 shows the influence of channel shape to transmission loss of particulate filter. In Figure 6, transmission loss of particulate filter with typical square channels ranges from −1.8 to 18.7 dB. In the frequency range of 100–3000 Hz, the transmission loss of the circular channels has the minimum 0.23 dB at 550 Hz and maximum 20.5 dB at 260 Hz, with significant growth. With the increase in frequency, the transmission loss of circular channels was higher than that of other channels. In comparison, the filter transmission losses of the channels by Schemes 2 and 3 were larger than those of other channels in frequency range, with better muffling effect. The peak value of transmission loss can be increased by 2–3 dB. With the increase in frequency, the peak phase of transmission loss begins to shift right. For Scheme 2, the shift is more significant. With slow growth, the transmission loss of channels by Scheme 2 has the maximum 19.3 dB and the minimum −0.68 dB. The transmission loss of channels by Scheme 3 has the maximum 21.2 dB and the minimum −0.43 dB. The largest difference between the peaks is about 2.7 dB. The transmission loss of channels by Scheme 2 has the maximum 21.2 dB and the minimum 0.12 dB. The largest difference between the peaks was about 1 dB. The transmission losses of the whole schemes have obvious peaks and valleys. Transmission valleys change with channel shape and frequency. Within corresponding frequency channel, transmission losses of channels with different shapes have similar phases and amplitudes. This shows that channel shape only affects sound attenuation amplitude rather than frequency.

Influence of channel shape change to transmission loss of particulate filter.
Channel interval
Figure 8 shows the influence of channel interval to transmission loss of particulate filter. In corresponding frequency range, transmission loss increased with the increasing of channel interval. In low-frequency region, transmission losses with channel intervals of 1, 1.25, 1.5, and 2 mm had minimum peaks 17.3, 16.7, 16.3, and 15.6 dB. With the increasing of frequency, the transmission loss constantly increased. The larger the interval, the larger the growth speed and the amplitude of transmission loss. For the particulate filter with channel interval of 2 mm, the maximum value of transmission loss is 20.14 dB at 2800 Hz.

Influence of channel interval to transmission loss of particulate filter.
Filter layer thickness
Figure 9 shows the influence of filter layer thickness to the transmission loss of particulate filter. For filter layers with thicknesses of 0.7, 0.6, 0.55, 0.5, and 0.4 mm, the maximum transmission losses were 19.7, 19.2, 18.9, 18.9, and 18.4 dB. With the increase of frequency, the wave phase of the transmission loss constantly shifts right, increasing the transmission loss. The smaller the filter layer thickness, the larger the accelerated speed. In the corresponding frequency range, the larger the filter layer thickness, the larger the transmission loss of particulate filter. There was little difference between wave phases of transmission losses of structure with different thicknesses. This shows that thickness had no obvious influence on muffling frequency. It affected the amplitude of muffling frequency range.
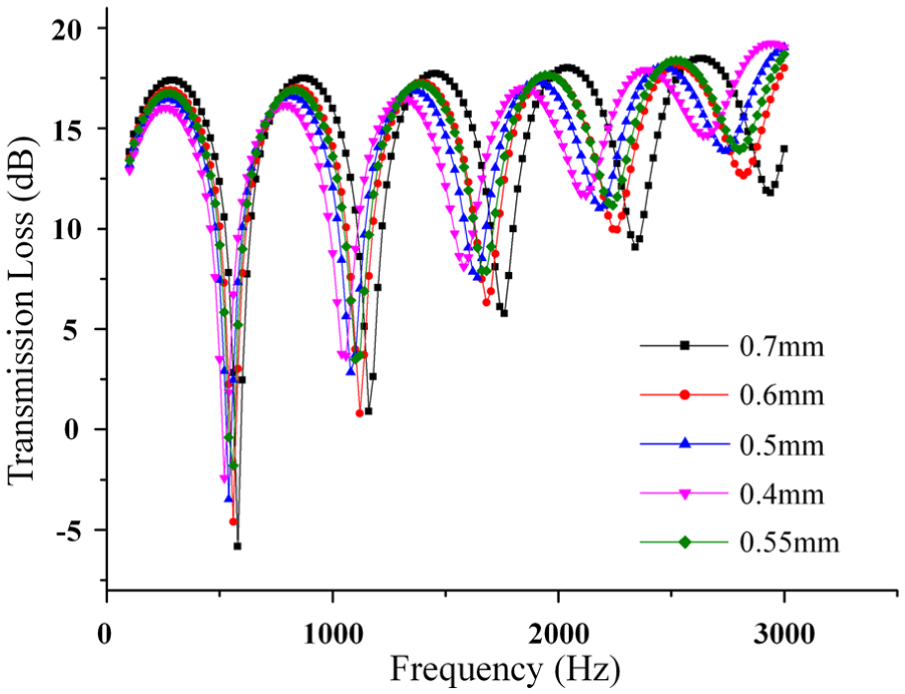
Influence of filter layer thickness to transmission loss of particulate filter.
Channel length-to-diameter ratio (L/D)
Figure 10 shows the influence of L/D to transmission loss of particulate filter. With the increasing of filter body length, the cavity volume increased to change waveform phase of transmission loss. The larger the L/D, the smaller the frequency difference between transmission loss peaks. At low frequency, there was little difference between transmission loss peaks. However, the particulate filter with larger L/D had larger transmission loss increment than that with smaller L/D, with the increase in frequency. The frequency ranges from 100 to 3000 Hz. When L/D was less than 1, transmission loss value changes little with the increase of L/D. When L/D was larger than 1, the transmission loss value significantly increased. When L/D was 1.4, transmission loss had maximum 20.67 dB and minimum 0.56 dB. In high frequency area, the particulate filter with L/D of 1.4 had better muffling ability than that with original L/D of 0.95.

Influence of L/D to transmission loss of particulate filter: (a) transmission losses of particulate filters with L/D of 0.6, 0.8, and 0.95 and (b) transmission losses of particulate filters with L/D of 0.95, 1.2, and 1.4.
Porosity
Porosity is the property of being porous of air and acoustic. Figure 11 shows the influence of porosity to transmission loss. The larger the porosity, the larger the transmission loss of particulate filter. With the increase in frequency, the particulate filter with lower porosity had higher transmission loss increment than that with higher porosity. In low-frequency range, the transmission loss peak difference of different porosities was about 2 dB. With the increase in frequency, the peak difference gradually decreased.

Influence of porosity to transmission loss of particulate filter.
In the corresponding frequency range, the transmission loss phase difference of different porosities was insensitive. Only the amplitude of high-frequency range was affected. With the increase in frequency, the transmission loss of the channel with porosity of 0.3 had higher increasing rate than that of other channels. The transmission losses of the same porosity at different frequencies were related to the wavelength change of acoustic wave. The transmission loss with smaller porosity had larger increment rate in the corresponding frequency range. As the porosity increased, the valley value of transmission loss gradually decreased because of heat generation by acoustic friction. It was concluded that porosity was positively correlated with muffling effect.
Summary
The work discussed the influence of channel shape, interval, filter layer thickness, L/D, and porosity to the transmission loss by controlling the conductivity and cavity volume of the particulate filter. In the corresponding frequency range, the peak and valley of the transmission loss changed by 2–3 dB with the changing of structural parameters. The channel shape, interval, filter layer thickness, L/D, and porosity were positively correlated with the transmission loss. As the frequency increased, the valley value of the transmission loss gradually increased, and the wave phase shifts to the right. For the structure with lower transmission loss, the valley value had larger increasing rate.
Conclusion
According to the existing and four-terminal grid theory, the transfer matrix and three-dimensional acoustic FEMs were used to establish the acoustic model of the particulate filter. After simulation of transmission loss, the accuracy of the model was calibrated by two-load method transmission loss experiment. Result shows that transmission loss characteristics were affected by the acoustic pressure at the inlet and outlet and the internal porosity of particulate filter. On this basis, the work analyzed the influence of channel shape, interval, filter layer thickness, L/D, and porosity to transmission loss to derive the following conclusions:
Based on acoustic four-terminal grid theory, transfer matrix was derived to establish acoustic finite element model, thus calculating transmission loss of particulate filter.
While other structural parameters are constant, the acoustic pressure value was changed to discuss porosity, channel interval, filter layer thickness, and L/D relevant to cavity volume and conductivity. The above model was calculated to derive that the porosity, channel interval, filter layer thickness, and L/D were positively correlated with transmission loss of particulate loss.
On the premise of structure layout invariance, the specific octagonal inlet channel, equipped with square outlet and square asymmetric exhaust channels, had a better acoustic performance than typical particulate filter structure. The channel interval, filter layer thickness, L/D, and porosity were increased to enlarge the transmission loss, thus improving the noise rejection characteristics.
Footnotes
Acknowledgements
The authors thank the anonymous reviewers for their valuable suggestions in improving this paper.
Academic Editor: Pietro Scandura
Declaration of conflicting interests
The author(s) declared no potential conflicts of interest with respect to the research, authorship, and/or publication of this article.
Funding
The author(s) disclosed receipt of the following financial support for the research, authorship, and/or publication of this article: This work was funded by the National Natural Science Foundation of China under project number 51575410 and Fundamental Research Funds for the Central Universities (WUT:2014-VII-004).