
Abstract
Shale transport properties are investigated by numerical simulations of a simple, physics-based continuum model. Shale samples from the Yanchang Triassic Formation in Ordos Basin are tested to get the pore volume distribution of shale. Due to the existence of nanopores in shale reservoirs, there are great differences in gas transport mechanisms compared to those in conventional gas reservoirs. These mechanisms include Knudsen diffusion and adsorption. A physics-based continuum model is utilized to simulate the gas transport in a channel with nanoscale radius, where these mechanisms are taken into consideration by imposing a general boundary condition with two parameters. The correction factor which is the ratio between apparent permeability and intrinsic permeability is investigated for a wide pressure range, which shows it is always larger than 1, illustrating that Knudsen diffusion always plays a role in shale gas transport.
Introduction
Shale reservoirs have become important energy resource and received commercial and research focus due to the advances in drilling and fracturing techniques. Shale reservoir refers to fine-grained sedimentary rocks that contain self-sourced hydrocarbons. Mudstone (shale) is highly heterogeneous rock in both composition and pore structures, which comprises two distinct media: organic matter (kerogen) and nonorganic minerals (clay, quartz, etc.). Another important feature of shale permeable media is the nanoscale size of pores, both in organic and inorganic matter. With small pores and fixed pore volume, the ratio of surface area to volume increases. When the pore diameter is less than 10 nm, adsorption may become important. 1 In general, when the ratio of surface area to the pore volume increases, adsorption of fluid species may contribute significantly to the fluid-in-place. Some shale reservoirs have pores greater than 10 nm, and the average is in the range of 20–50 nm in some of the shale formations.2,3
Due to the extremely low permeability in shale reservoir, artificial conductive pathways need to be created so that gas can transport from matrix to the fractures and then to the wellbore. So far, the most frequently used technique to increase the permeability of a shale formation is hydraulic fracturing which extend existing fractures and create new ones by injecting a pressurized fluid into shale reservoirs.
4
Gases desorb from the pore wall and flow into the matrix. Then, fluxes transfer between matrix and fracture due to the pressure difference. Eventually, gases flow to the wellbore and are produced. So shale extraction is a multiscale multiple physicochemical process which ranges from nanoscale to macroscale. Understanding the mechanisms in this process is important for increasing the gas production efficiency and reducing production costs. The concept of Knudsen number

Flow regimes in porous media.
The gas transport mechanisms in shale nanopores include viscous flow, Knudsen flow, and slip flow that is between them.6–11 Viscous flow is caused by collision between molecules. Knudsen flow is caused by collision between molecules and nanopore wall, that is, Knudsen diffusion. Gas transport models in shale nanopores can be generally divided into two categories: molecule model and macro-model. Molecule model can simulate all kinds of physical mechanisms in nanopores accurately because it is build based on the molecule nature of a gas.12,13 However, molecule simulation requires enormous computing resources and time which limits its application.12,14–17 To describe the gas transport mechanisms in nanopores, the traditional continuum models are modified by introducing some slip boundary conditions.5–9,18,19 In detail, Klinkenberg introduced a empirical model to consider the Klinkenberg
18
effect. A unified model is raised by Beskok and Karniadakis
5
to predict mass flow rate and pressure distribution for channel flows in the regime
In this study, we employ a physics-based continuum model to simulate the gas transport in a channel with nanoscale radius. The effects of Knudsen diffusion, adsorption, and rarefaction are taken into account by imposing a general boundary condition with two parameters. The correction factors under a wide range of pressures and different pore radii and adsorption ratios are reported and discussed. The rest of this article is organized as follows. We introduce the mechanisms that are important in shale transport in section “The mechanisms in shale gas transport.” The model together with boundary condition that accounts for effects of Knudsen diffusion, adsorption, and rarefaction are built and discussed in section “The mathematical model for gas transport in nanopores.” In section “Numerical results,” numerical results are reported and discussed. Conclusions are put in section “Conclusion.” A nomenclature illustrating symbols is in given under Notation section. Appendix 2 illustrates the details of numerical methods.
The mechanisms in shale gas transport
Viscous flow
When Knudsen number is relatively small
where
Knudsen diffusion and Klinkenberg effect
When Knudsen number is relatively large
For gas flow through shale reservoirs, the mean free path of molecule is non-negligible compared to the average rock pore throat diameter causing the gas molecule to slip along pore surfaces. This slip flow creates an additional flux mechanism which is called Klinkenberg 18 effect and may be additive to viscous flow

where
The slip flow caused by Klinkenberg effect is between viscous flow and Knudsen diffusion. Methane molecule trajectories of Klinkenberg effect and Knudsen diffusion are illustrated in Figure 2.

Illustrations of methane molecule trajectories: (left) Klinkenberg effect and (right) Knudsen diffusion.
Methane adsorption
The Langmuir equation is the classical model for monolayer gas adsorption on homogeneous micro-porous solids and frequently applied in fitting adsorption data for gas/shale system 22

where
To discuss methane adsorption effect on flow transport in nanopores, we define a parameter

The mathematical model for gas transport in nanopores
The gas flows in shale strata are governed by conservation equations for momentum and mass, that is, the compressible Navier–Stokes equations

where
To incorporate the three mechanisms in shale gas transport, Navier–Stokes equations (5) and (6) are solved subjected to the slip boundary conditions given by

Here,
Numerical results
Structural characterization of shale formation
The first step to perform the numerical simulations is to identify the structural characteristics of shales. The scanning electron microscopy (SEM) images of samples from the Yanchang Triassic Formation in Ordos Basin are shown in Figure 3. Shale rocks contain fractures and pores of different sizes. In shale gas reservoirs, gas is stored in interconnected pore space and transports through these connected pores and fractures. Quantitative characterization of the shale formation are crucial for the prediction of transport properties, among which the pore size is the most important feature. The rock samples are tested by both nitrogen adsorption method and mercury injection method. The former method gives the pore size distribution of micropores and the latter one tests the pore size distribution of mesopores. From Figure 4, we can see that micropore has a peak around 4 nm and mesopore concentrically distributes near 10 nm.

SEM images of shales: (left) fracture and (right) pore.

Pore size distribution of shale samples: (left) characterized by nitrogen adsorption method and (right) determination by mercury injection method.
Numerical aspects and discussion
We use the physics-based continuum model introduced in section “The mathematical model for gas transport in nanopores” to simulate the flow transport in a single nano-channel to get the pressure and velocity field. Thus, we can calculate the apparent permeability and then predict the key parameter correction factor in equation (2). Due to tiny scale of channel diameter, the diameter change caused by adsorption cannot be negligible. The geometry change introduced by adsorption will have an negative influence on transport. Also adsorption can bring in some pattern changes on slip lengths when the values are quite different on the solid surface and on the adsorption layer.
Navier–Stokes equation is solved with a P2-P1 mixed finite element method. For the nonlinear term, we use the linearized semi-implicit temporal discretization to avoid the nonlinear iteration. See Appendix 2 for details. The computational domain is illustrated in Figure 5. High-quality unstructured mesh (centroidal Voronoi Delaunay triangulation27,28) is used to partition the computational domain. The temperature is fixed at 388.15 K. For different cases, the pore radius (characteristic length) varies from 5 to 50 nm and the characteristic pressure varies from

where

Computational mesh.
The apparent permeability predicted by our simulations under different pressures is shown in Figure 6. The apparent permeability is always larger than intrinsic permeability. The difference decreases when the pressure increases. This is because mean free path decreases as the pressure increases. Thus, the Knudsen number

Left: Apparent permeability predicted by numerical simulation under different pressures in a log–log scale. Right: Correction factor predicted by continuum simulation, LBM simulation, and empirical correlation under different pressures in a semi-log scale.
The correction factor predicted by our simulations under different channel diameters is illustrated in Figure 7. The correction factor is always larger than 1 and approaches to 1. When the pore diameter increases, the viscous flow increases and the Knudsen diffusion becomes weak. From the Kozeny–Carman formula (1), we can see that the intrinsic permeability is proportional to the square of pore radius. Thus, when the pore radius is large enough, the apparent permeability equals to the intrinsic permeability and the correction factor reaches the limiter 1. However, in nanopores, we can see from Figure 7 that the apparent permeability is 100 times larger than the intrinsic permeability.
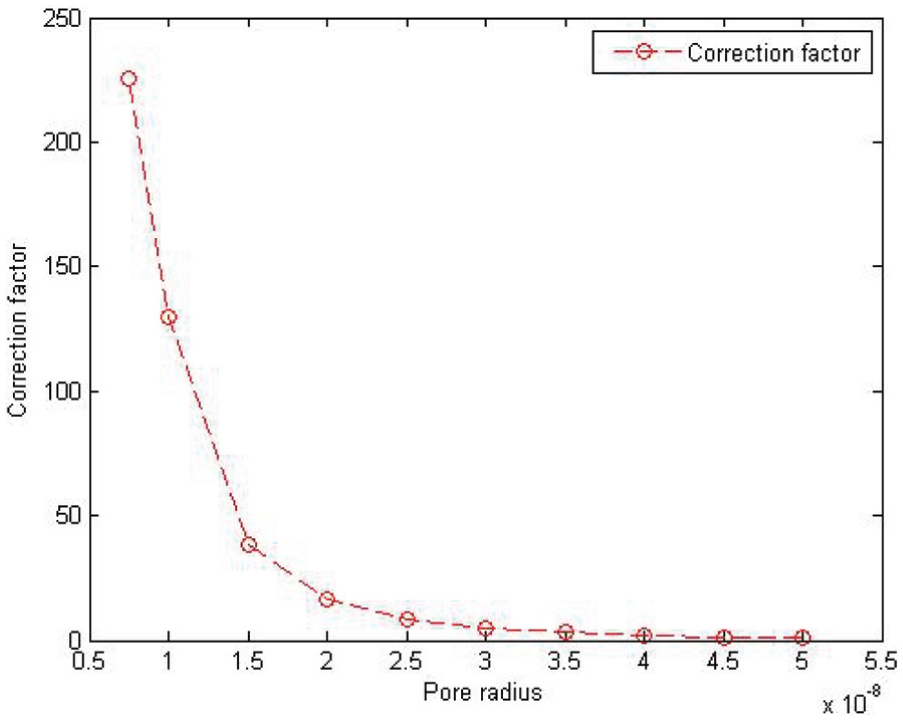
Correction factor predicted by numerical simulation under different pore diameters.
The correction factor predicted by our simulations under different adsorption ratios is illustrated in Figure 8. The adsorption ratio is defined in equation (3), which is the ration between gas adsorption capacity and Langmuir maximum adsorption capacity. The correction factor is always larger than 1 and does not change too much for different adsorption ratios. The limiter case that the adsorption radio approaches to 1 does not happen in real situation because it requires pressure approaches to infinity.

Correction factor predicted by numerical simulation under different adsorption ratios.
Conclusion
We employ a simple, physics-based continuum model to simulate the flow transport in nanopores. Gas transport mechanisms in shale reservoirs are taken into consideration in this model. Numerical results show that the correction factor is always larger than 1, indicating Knudsen diffusion always plays a role in shale gas transport. Our model produces competitive results in comparison of the numerical results in Chen et al. 29 with relatively low computational cost, where lattice Boltzmann method is used. Our method can be considered as a fast tool to estimate the correction factor in the Klinkenberg model which can be used in the field scale simulation.
Footnotes
Appendix 1
Appendix 2
The mathematical model illustrated in section “The mathematical model for gas transport in nanopores” is simulated by finite element methods. To discretize the Navier–Stokes equation (5) and the continuity equation (6), the following finite element spaces are introduced
where
Under the assumption of little compressibility, the continuity equation (6) can be rewritten as30,31
where
The above discretization formulas are obtained from the variational forms of equations (5) and (8) by applying the corresponding finite element spaces, and the slip boundary condition (7) is included as a Robin type boundary condition. Solve this linear system to obtain the velocity field and pressure distribution. When the simulation of fluid flow reaches a steady state, the apparent permeability is calculated by
where
Academic Editor: Kai Bao
Declaration of conflicting interests
The author(s) declared no potential conflicts of interest with respect to the research, authorship, and/or publication of this article.
Funding
The author(s) disclosed receipt of the following financial support for the research, authorship, and/or publication of this article: This work was supported by the National Natural Science Foundation of China (Nos 11401467, 11401461, and 51374172), China Postdoctoral Science Foundation (Nos 2013M542334 and 2015T81012), and Natural Science Foundation of Shaanxi Province (No. 2015JQ1012).