
Abstract
With the focus on the failure of single-cracked rocks under compression–shear stress, the form and the critical conditions of crack initiation by adopting theoretical derivation and numerical experiments methods are researched in this article. Maximum circumferential stress criterion and modified Griffith’s criterion are utilized to derive the expressions for crack initiation angle and fracture criterion. Moreover, the PFC3D, numerical simulation software, is used to verify the results of theoretical research and the research on the generation process of shear fracture zone and the number of microcracks and their distribution law. The results show that the crack initiation angle θ0 and critical conditions of crack initiation correlate with some factors, such as crack inclination angle β, coefficient of friction μ, and the ratio of normal stress to shear stress σ1/τx. When β is less than or equal to 90°, the deviation between the theoretical result of crack initiation angle and actual result is small; when the value of Mode I fracture toughness KIC is accurate, the crack criterion derived is reliable when β is less than or equal to 120°. The friction between cracks restricts the compression–shear failure on the surface of crack. The ratio of shear stress required for crack initiation to peak shear stress in the model decreases with the normal stress increased. At the crack initiation stage, when the increase in microcracks is relatively slow, the shear fracture zone is thin and when the increase in microcracks becomes rapid, shear fracture zone becomes thick at the peak stage. The shear strength is proportional to the number of microcracks in the model.
Keywords
Introduction
Discontinuous, inhomogeneous, anisotropic, brittleness, and non-elastic properties of the rock mass are the key factors contributing to the deformation and failure of the rock mass. The elastic–plastic mechanics cannot accurately explain the failure mechanism of rock mass. The past researches1–3 show that there are two modes of brittle failure for rocks under compression load. First, the rocks fail under tensile strength by axial splitting when the confining pressure and compression load are small. Second, the rocks fail by shear failure at a certain angle with respect to the direction of the maximum principal stress when the confining pressure is modest. The initiation, growth, interaction, and coalescence of microcracks are viewed as the dominant mechanism to control the macroscopic failure of rocks.
In 1980s, many researchers1–3 introduced stress intensity factor theory in the fracture mechanics into rock mechanics and thereafter proposed sliding crack model. According to this model, when the shear stress acting on the main crack exceeds the friction between the cracks, the stress will concentrate at the tip of the crack and wing cracks will initiate. The stress intensity factor KI at the tip of crack will decrease accordingly when the wing cracks grow. If the external load stops increase, cracks will become stable and grow no longer. The stress intensity factor at the tip of crack will increase if the external load continues to increase. The cracks will continue to grow and curve toward the direction of the maximum principal stress when the stress strength factor meets or exceeds the critical value KIC. That model is the basis of the study on the compression-shear-induced cracks’ growth, interaction, and coalescence in rock-like materials. Meanwhile, it has led to many calculation models which were used extensively to describe the non-elastic expansion and the failure mechanism of rock-like materials. Baud et al. 4 proposed an improved model for the growth of wing cracks and failure mechanism of rocks based on the studies of Horii and Nemat-Nasser.1,2 In this model, Baud et al. 4 simplified the growth path of wing cracks into a straight line connecting the wing crack tip to the main crack tip, thereby reducing the calculation efforts. Besides, an approximation calculation formula is proposed. NA Al-Shayea 5 conducted Brazilian disk splitting test on limestone samples with pre-existing open-type cracks. Based on the maximum shear stress theory, NA Al-Shayea 5 proposed a method for the calculation of crack initiation angle under mixed Mode I–II fracture. NA Al-Shayea 5 also observed that when the values of crack orientation with respect to loading direction are high and axial compression is relatively great, crack does not grow from the tip of the notch, but from the center of the specimen. Zhao and Xu 6 studied the mixed Mode I–II fracture model and introduced second invariants of the deviatoric stress tensor J2 as the crack criterion, the result of which compares well with the results in the plexiglass test and beryllium test. Zhang and Hu 7 used different failure modes and then proposed the formula for the calculation of tensile and shear crack angles. Yang et al. 8 came up with a simplified crack model, the criterion for mixed fracture as well as the equation for the prediction of crack growth direction. Lin and Yang 9 found that in open-type crack, the geometry of the cracks (thickness, tip radius of curvature, etc.) affect the growth of cracks.
Some scholars applied physical detection technologies and computer technologies to the study of crack growth and failure modes. In addition, their own calculation models and fracture criteria are used to analyze the shear–compression fracture in rocks and concrete with cracks. Zhao et al. 10 used scanning electron microscope (SEM) to study the growth, interaction, and coalescence of joints in the rocks under axial compression. Ge et al. 11 and H Jian et al. 12 used computed tomography (CT) scanner and auxiliary loading devices to conduct real-time scanning over fractured rocks under uniaxial and triaxial compression for the observation of cracks’ and rocks’ failure. In light of the results, they created CT-value-based damage variable, damage growth rate, threshold value of damage, and other concepts. Tang and colleagues13–15 developed Realistic Failure Process Analysis (RFPA), a new numerical code, to simulate the microscopic and macroscopic failure of cracked rocks. The results of it showed that the code works well to simulate the nonlinear and non-homogeneous features of rock-like materials. Manouchehrian et al. 16 studied the effect of initial flaw orientation on the ultimate failure mode of samples under compression stress using PFC2D. This study shows the shorter wing cracks formed and more shear fractures developed and coalesced to form faults with the increase in the flaw inclination angle. The wing cracks shifted from a position at the flaw tips to the flaw centers with the flaw inclination decreased. Dyskin et al. 17 and Guo et al. 18 used different transparent resins to study the growth mechanism of internal cracks and the effects of cracks location and geometry on the results. This study shows that the result basically is in agreement with two-dimensional case when the ratio (abbreviated as the crack depth ratio) d/t of pre-existing crack depth to the thickness of the sample is relatively great. Wong et al.19,20 studied the growth and failure of open-type cracks using polymethylmethaacrylate (PMMA) and marble as the samples. The study result shows that the growth form of surface cracks correlate with crack depth. The scope of wing crack is relatively large and being extended to the back surface of the sample when d/t is more than 1/3. However, anti-wing cracks are observed when test is conducted on the marble samples having a crack depth ratio of less than 1/3.
Although studies on the failure mode of intermittent rock joint abound, the improvements still are expected. Studies by Baud et al., 4 NA Al-Shayea, 5 and others on the sliding crack model have obtained the calculation methods for stress intensity factor and crack initiation angle. However, these calculation methods with their definite physical significance are complicated and not satisfying in closed crack under compression. Although the mixed Mode I–II fracture criteria proposed by Zhao and Xu 6 and Yang et al. 8 yield satisfying results in organic materials and metal materials, the applicability of these criteria on rock-like materials characterized by non-homogeneity and discontinuity requires further studies. Zhao et al., 10 Ge et al., 11 Tang and colleagues,13–15 Manouchehrian et al., 16 and others conducted their studies on the failure of cracked rocks under compression stress by adopting physical detection technologies and software simulation. However, these studies are limited to the summaries of test data and derivation of empirical formulae, lacking rigorous theoretical derivation of fracture criteria and crack initiation form. Dyskin et al. 19 and Wong et al.19,20 used organic materials and marble as samples and conducted detailed studies on the relationship between the crack depth ratio and wing cracks, yet these studies mainly consider the growth of cracks under uniaxial and biaxial compression loads and therefore are insufficient in the study of failure forms under shear load. Based on the fracture mechanics and rock mechanics, the crack initiation angle and the critical conditions of crack initiation for the rock containing one intermittent rock joint are researched in this article. Finally, numerical experiments are used to verify consistency of theoretical research results and numerical experiment results.
Theoretical analyses of crack initiation conditions
Calculation of stress intensity factor
At the state of compression stress, crack in the rock is closed and the surfaces on the two sides therefore come into contact. The friction thereby produced restricts the sliding and growth of the crack, thus reducing the stress concentration at the tip of the crack. With regard to the calculation of stress intensity factor of intermittent rock joint under compression load, many research results are obtained. However, the stress intensity factor under shear stress is relatively less studied. Shear stress is a type of stress state common in rocks. Under pure shear stress, crack may lead to Mode I cracking or Mode II cracking, determined by the stress conditions near the tip of the crack rather than by the loading forms. When the tensile stress acting on the two sides of the crack overcomes the bonding strength of the crack, the crack will be opened and it will lead to tensile crack at the tip of the crack. That is Mode I crack. The Mode II crack will occur when the crack surfaces slide. Under shear stress, the growth forms of the crack in the rock mass are affected by multiple factors, with the interaction of adjacent cracks further complicating the stress state at the tip of the crack.
Considering the case of an infinite plate with a center crack under compression load and shear load, where the crack length is 2l, the inclination angle is β. Under compression stress and shear stress, plate undergoes failure (Figure 1). Now, the stresses acting on the crack are listed as follows 21


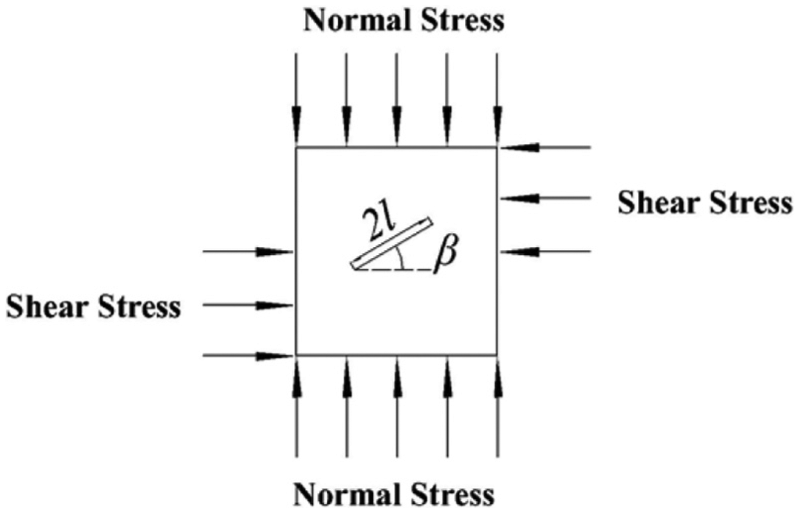
Closed crack under compression–shear stress.
In which, σ is the normal stress acting on the crack (MPa), τ is the shear stress (MPa), σ1 is the maximum principal stress of the unit (MPa), τx is the shear stress of the unit, and β is the angle by which the x axis rotates anti-clockwise to the direction of the crack (°). The sign provision of the stresses is consistent with elastic mechanics. As β changes, the normal stress acting on the crack can be tensile or compressive, thus leading to Mode I fracture, Mode II fracture, or mixed Mode I–II fracture. The stress intensity factor 22 at the tip of the crack is listed as follows


In which, KI is the Mode I stress intensity factor (MPa m1/2), KII is the Mode II stress intensity factor (MPa m1/2), and
By introducing equations (1) and (2) into equations (3) and (4), the formula for the stress intensity factor of crack under compression–shear load is obtained as follows


Calculation of crack initiation angle
Under mixed Mode I–II load, the stress components (Figure 2) on crack tip in polar coordinate system are expressed as follows


Stress components on crack tip.
In which, r is the distance between the element and crack tip (m), θ is the angle of element radial direction with respect to x axis (°), σr is the radial stress acting on the element (MPa), σθ is the tangential stress acting on the element (MPa), and τrθ is the shear stress acting on the element (MPa).
In the fracture mechanics, the commonly used maximum circumferential stress criterion states that (1) under mixed Mode I–II load, the crack will grow in the direction of the maximum circumferential stress (maximum principal stress) and (2) when (σθ)max attains the critical value, the crack starts growing. According to this criterion, the direction of crack initiation is obtained as follows

In which, θ0 is the angle of crack initiation direction being relative to the crack direction, with anti-clockwise rotation as the positive direction.
According to formulas (5) and (6)
The crack initiation angle under compression–shear stress correlates with the angle of the crack with respect to horizontal direction β and the ratio of normal stress to shear stress. As the ratio value changes, the relationship between the crack initiation angle θ0 and the crack angle β is shown in Figure 3.

Relationship between the crack initiation angle θ0 and the fracture angle β.
It can be found in Figure 3 that the crack initiation angle correlates closely with the value of σ1/τx. When the ratio value is less than 0.1, it barely affects the crack initiation angle. Theoretically, there are two solutions to the crack initiation angle θ0, in which the range of θ1 is [–70.5°, 70.5°] and the range of θ2 is approximately [–180°, –70.5°] and [70.5°, 180°]. For a specific crack growth problem, it is necessary to analyze it in combination with the actual phenomena.
Critical conditions of crack initiation
According to the maximum circumferential stress criterion, the critical condition of crack initiation angle is expressed as follows

In which, KIC is the Mode I fracture toughness of the material.
Now, when the tangential stress acting on the element on the crack tip reaches the tensile strength of the material, the crack starts to grow. The stress state in the element is expressed as follows 23

In which, σ1 and σ3 are the maximum and minimum principal stresses of the element, respectively. Modified Griffith’s criterion requires the effects of σ1 and σ3, and the coefficient of friction on the crack shall be considered. The expression for modified Griffith’s criterion is listed as follows 24

In which, σc is the tensile strength of rock.
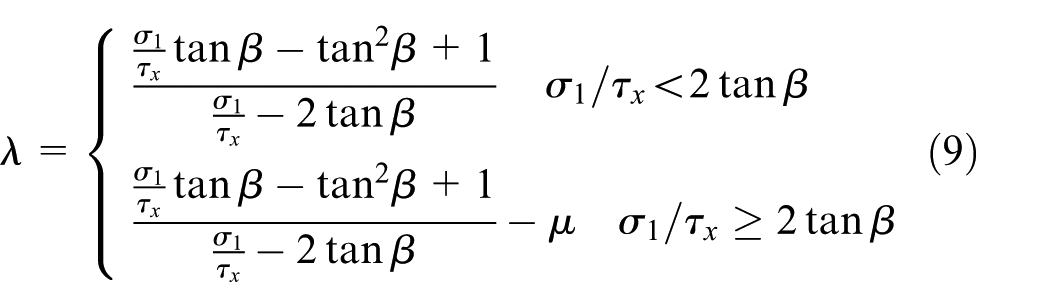
According to equation (9)

Equation (13) is the criterion of mixed-mode fracture of crack under compression–shear stress derived using maximum circumferential stress criterion and modified Griffith’s criterion. In this theory, if KI in the equation is assumed to be 0, the crack undergoes Mode II fracture, and the ratio of KII to KIC can be obtained. Sun et al.
25
obtained the value of KII/KIC in some marble samples running between 2.96 and 3.28 when the coefficient of friction on the crack surface is not considered. When the value of μ in equation (13) is assumed to be 0, and the ratio of normal stress to shear stress σ1/τx in crack initiation is assumed to be 0.05, according to the discriminant in Sun,
26
the crack produces Mode II fracture when β ≈ 150°−60°. According to formulas (8) and (9), the crack initiation angle can be calculated, and the value of
Numerical experiments of crack initiation processes
Development of model and crack initiation
For the simulation of growth and failure of cracks, the software PFC can be used to simulate the material migration, stress transfer, as well as the initiation and growth of cracks within the samples. In addition, PFC can be used to monitor the location and number of microcracks during the failure of the sample, the form of crack coalescence and the intensity of the specimen, and so on.
During numerical experiments, the size of the sample is 15 cm × 15 cm × 15 cm. As the study of Potyondy and Cundall 27 shows, when the diameter of the particle is no more than 4% of the sample size, the size effect can be minimized and the diameter of the particle is set between 0.3 and 0.4 cm. Parallel bond model is used in the samples, and the microscopic parameters are consistent with Yu et al. 28 The parameters are shown in Table 1.
Microscopic parameters of particles.

The mechanical characteristics of the sample include an elastic modulus of 20 GPa, a Poisson’s ratio of 0.26, an internal friction angle of 47.5°, and a cohesive strength of 29.7 MPa. The elastic modulus and the Poisson’s ratio of the model are obtained by uniaxial compression experiment. The internal friction angle and the cohesion are obtained by a series of direct shear tests, and the normal stress values are set as 1, 5, 10, 15, and 20 MPa. The sample with no cracks is shown in Figure 4(a). Deleting the particles in some region from the unbroken samples will show the cracks. The angles of the crack with respect to the positive direction of the x axis are 30°, 60°, 90°, 120° and 150°, respectively (Figure 4(b)–(f)). In this group of models, the crack length is 3 cm when β = 30°, 90°, and 150°, and the crack length is 5 cm when β = 60° and 120°.

Specimen models of different fracture angles: (a) intact sample, (b) β = 30°, (c) β = 60°, (d) β = 90°, (e) β = 120°, and (f) β = 150°.
Direct shear tests are conducted in this group of models. The values of the normal stress are set to be 1, 5, and 10 MPa. The lower shear box is fixed, and the upper shear box from the right to the left is displaced (Figure 5). When the crack angle β is greater than 90°, the crack is in stress state of Mode II.

Diagram of single-cracked rock in direct shear test.
Based on the approximate solution of stress intensity factor of the center crack in a finite size plate in fracture mechanics, the stress intensity factor at the end of the crack in Figure 5 is obtained as follows


Analysis of calculation results
The microcracks are generated near the crack tips at first, so the generation of microcracks indicates the crack initiation. By monitoring the number of microcracks, the crack initiation model can be obtained, so the shear stress of crack initiation can be obtained as well. The distribution pattern of growth path during crack initiation can be plotted, and then, the angle between the broken particles generated by the crack tip and the crack direction is the crack initiation angle. The crack initiation angle can be measured on the picture by drawing auxiliary lines (Figures 6–10), wherein the light-colored particles represent the portion where the crushing occurs, that is, the crack initiation path.
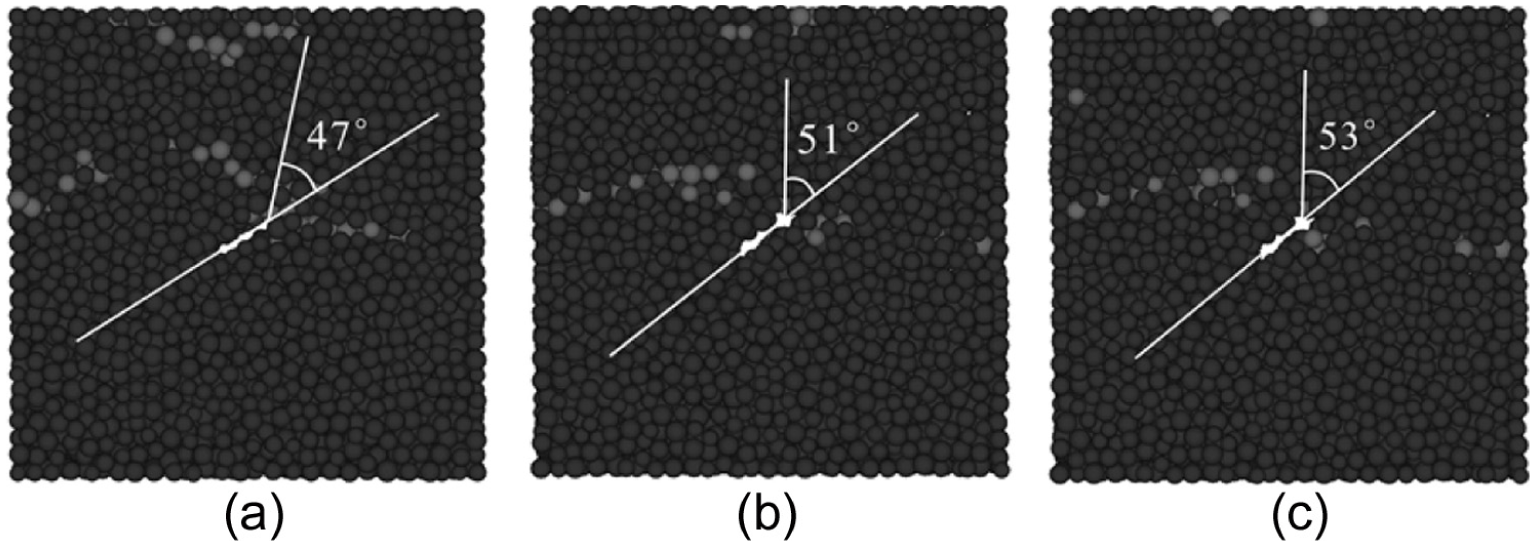
Crack initiation path under (a) 1 MPa, (b) 5 MPa, and (c) 10 MPa normal stress in β = 30°.

Crack initiation path under (a) 1 MPa, (b) 5 MPa, and (c) 10 MPa normal stress in β = 60°.

Crack initiation path under (a) 1 MPa, (b) 5 MPa, and (c) 10 MPa normal stress in β = 90°.

Crack initiation path under (a) 1 MPa, (b) 5 MPa, and (c) 10 MPa normal stress in β = 120°.

Crack initiation path under (a) 1 MPa, (b) 5 MPa, and (c) 10 MPa normal stress in β = 150°.
Under these different normal stresses, the ratio of the normal stress to shear stress when the crack initiates σ1/τx ranges between 0.04 and 0.47. The comparison of the calculation and simulation results of crack initiation angles θ0 is shown in Table 2.
Comparison of the calculation and simulation results of crack initiation angles θ0.
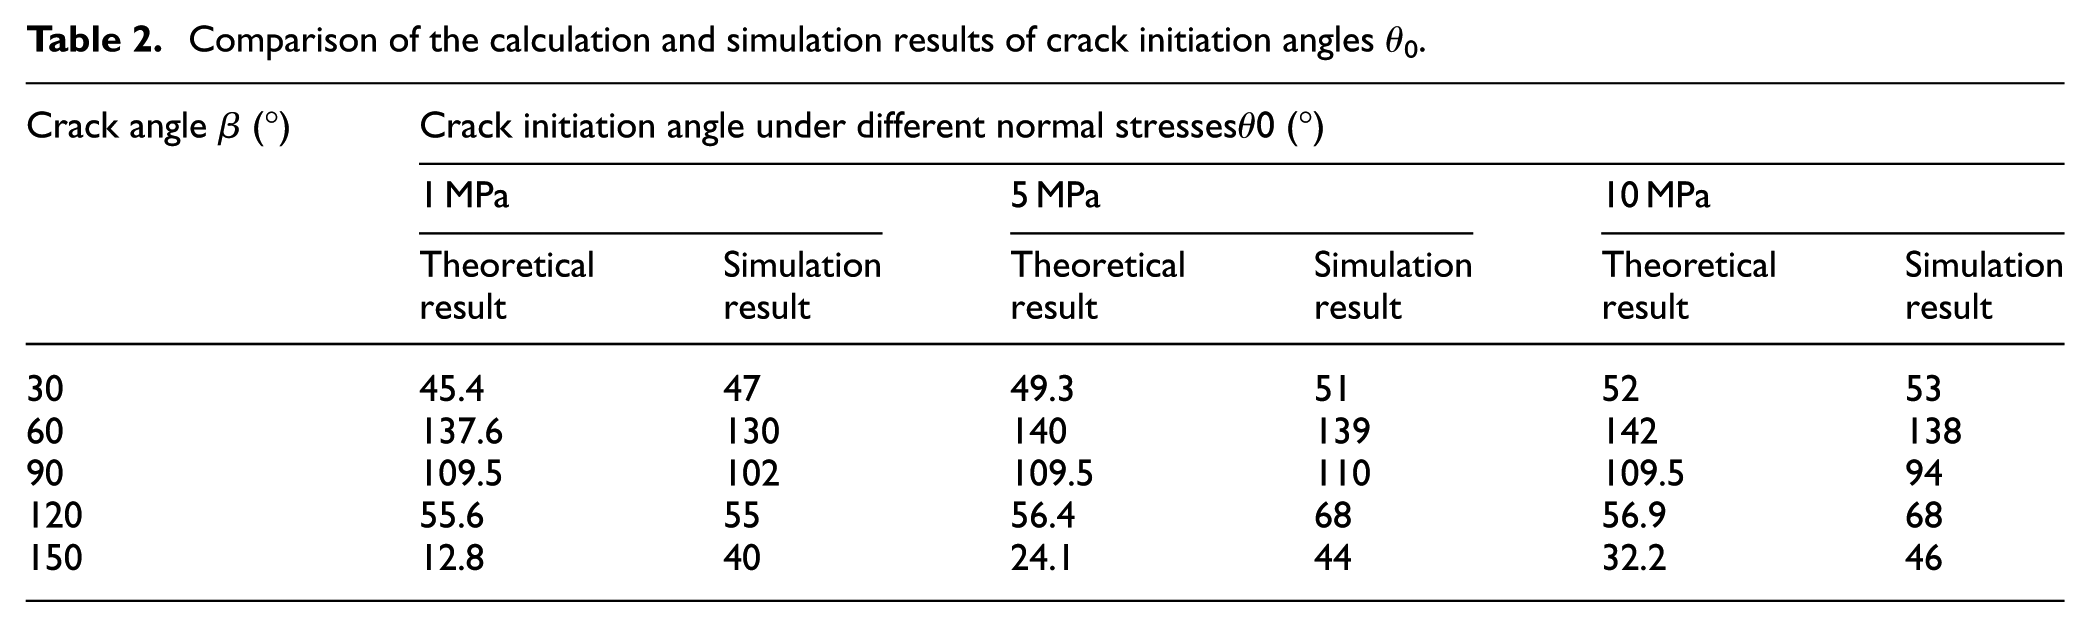
The results show that the simulation results are basically in agreement with the calculation results. When β is less than 90°, the error ranges from 3° to 8° and all simulation results are greater than calculation results. When β is equal to 90°, the error ranges from 7° to 15°. When β is equal to 120°, the error ranges between 1° and 12°. When β is equal to 150°, the error is more than 20°.
Under Mode II loading, crack usually undergoes Mode I fracture26,29–32 at the initiation angle of –70.5°, an error of 180° in comparison with the calculation result of β = 90° in Table 2. When the crack initiation angle is calculated according to equation (8), both θ = –70.5° and 109.5° satisfies the equation. This shows that the crack tip is under maximum tensile stress in that direction and therefore undergoes Mode I fracture. When shear stress is loaded, microcracks distributed along the direction of shear failure surface start to initiate. These microcracks whose distribution is controlled by the direction of shear stress guide the growth of pre-existing crack. Meanwhile, as the stress concentration at the model boundaries is relatively high, shear failure occurs at a relatively early stage. As the failure surface gradually joins secondary cracks, it will affect the direction of crack growth. Due to these factors, the direction of the crack growth changes, thus deviating from the theoretical angle. The crack initiation and peak shear stress under different normal stresses when the crack starts to grow are shown in Table 3.
Crack initiation and peak shear stress under different normal stresses.
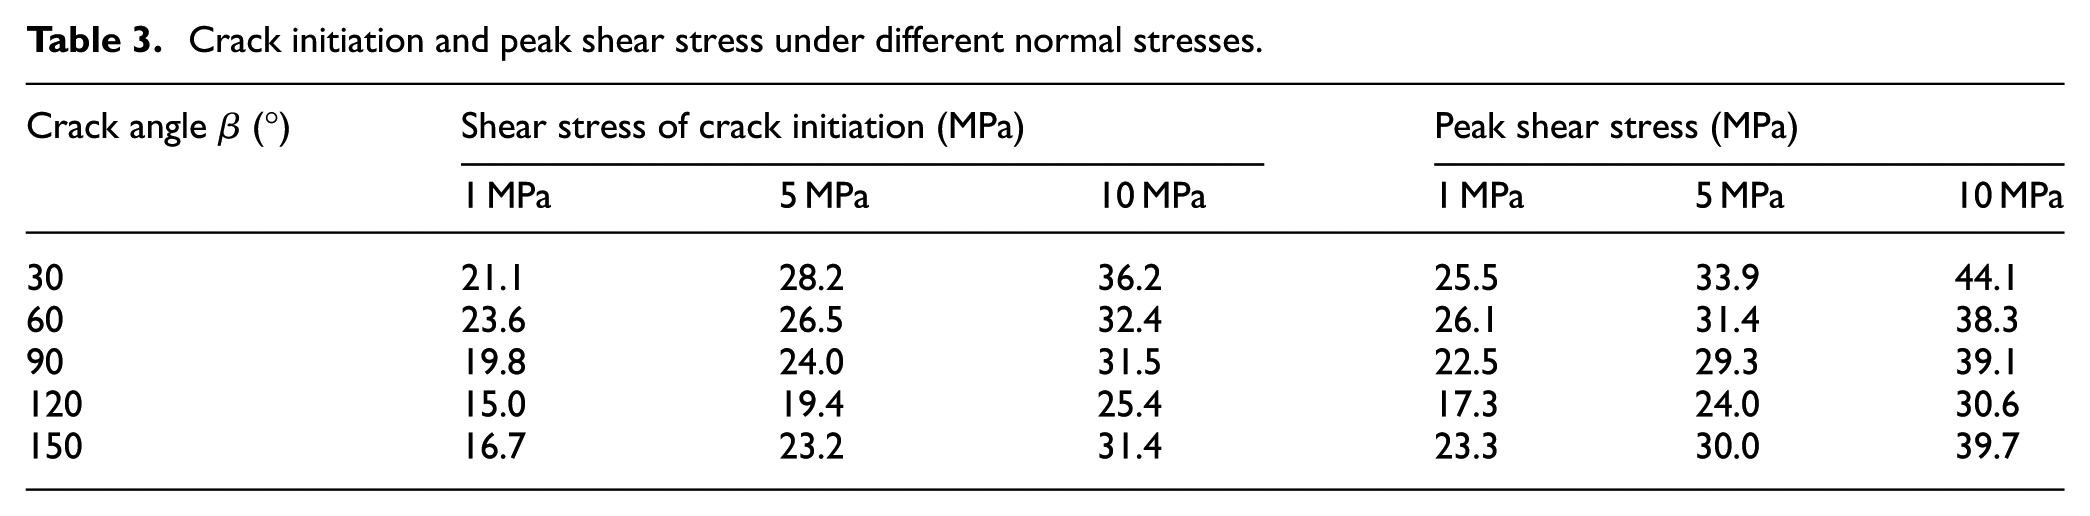
When β is higher than 90°, the crack is under Mode II loading and therefore more susceptible to sliding failure. By subjecting the results of tests at different inclination angles to comparison, it can be found that under low normal stress, the shear stress required for crack initiation when β is higher than 90° is less than that required when β is lower than 90°, and the difference is about 17%–36%, whereas under high normal stress, as the friction between cracks increases, the shear stress required for crack initiation increases accordingly, and the difference in shear stress required for crack initiation is reduced to 10%–13%. This demonstrates that the friction between cracks restricts the initiation and growth of cracks and that the friction barely affects the crack initiation angle. Under low normal stress, the crack initiation stress is about 83%–90% of the peak stress without much difference. Yet under high normal stress, that ratio stands between 79% and 85%. This result shows that the shear stress required for crack initiation and full failure increases with normal stress being increased, and the ratio of shear stress decreases slightly at the same time. Both the crack initiation shear stress and peak shear stress when β is 120° are the lowest among the same group model. This demonstrates that the crack at this angle weakens the shear strength of the model the most. The result is in good agreement with the results obtained by Shu. 33
By introducing the values in Tables 2 and 3 into formula (13) and through inverse calculation, the Mode I fracture toughness of this model can be obtained, which is KIC = 1.43 MPa m1/2. This value is approximate to the Mode I fracture toughness of marble A in Sun et al., 29 which stands at 1.26 MPa m1/2.
Divide both sides of equation (13) by 8KIC, and then, the K value of critical state under different normal stress can be obtained by the data in Tables 2 and 3, and the results are shown in Table 4
K value of critical state under different normal stress.
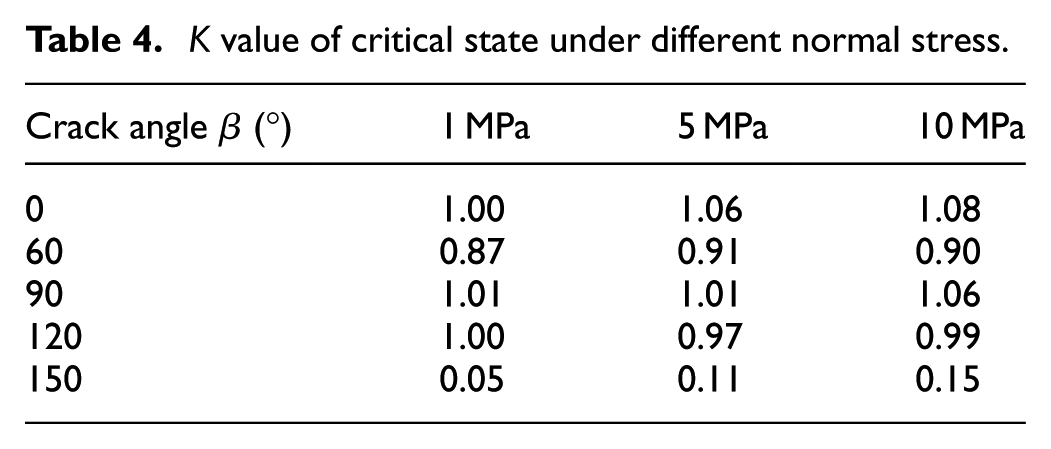

The result shows when β is equal to 30°, 90°, and 120°, and the deviation of K is small (the greatest deviation is 8%) and this criterion is therefore reliable to be used to predict the crack initiation angle and critical conditions. When β is equal to 60°, K value is between 0.87 and 0.91. In this case, as the actual crack initiation angle deviates from the calculation result, the calculation result of K deviates as well and therefore needs further modification. When β is equal to 150°, K value is between 0.05 and 0.15. In this case, as the actual crack initiation angle is 15°–17° lower than the calculation result, this criterion is not applicable.
The applicability of the criterion depends on the accuracy of KIC. KIC is the inherent property of the material, correlates with the relative size of crack to model and the material strength rather than with the loading form and geometric parameters. 34 When β is equal to 60°, the length of the crack is greater, and the distance between the crack tip and sample boundary is relatively short, leading to the relative decrease in KIC value and thereby the decrease in K value.
Analysis of crack growth
Taking the case of β equal to 30° as example, the value of μ is set to be 0.7. The crack initiation form of the sample under different normal stresses is shown in Figure 6. Whereas the crack initiation form of the sample under different normal stresses is generally the same, the failure form at the loading end and fixed end of the same model is slightly different. The upper tip of the crack gradually curves from the crack initiation angle to the shear direction and then joins the shear fracture zone at the model boundary. When the upper shear box moves from the right to the left, upper right part of the specimen undergoes the earliest stress concentration, and shear failure occurs at the right boundary. The failure grows to the center crack, and then, lower crack tip initiates and grows along the shear fracture zone.
The variation curves of the shear stress and microcrack number along with the shear displacement under different normal stresses are shown in Figure 11. The stress curves under different normal stresses present characteristics with stage-by-stage. The shear stress undergoes elastic stage, crack initiation stage, peak stage, and residual stage. At elastic stage and crack initiation stage, the shear stress grows with the displacement increased. However, the growth rate of shear stress at crack initiation stage is prominently less than that at elastic stage. The crack initiation means the decrease in rock strength. Yet the shear stress at this stage has not reached the shear strength of the rock. The shear stress continues to grow and reach a high level with shear displacement further increasing. When the shear stress reaches peak stage, the crack starts to grow rapidly, coalesces into shear failure surface and shear fracture zone, and then develops into full failure until the shear stress reaches residual stage. Microcracks initiate at late elastic stage, start to grow at the initiation stage, and then increase rapidly at peak stage and grow slowly at residual stage. Microcrack number is close to the same in crack initiation and peak stages, while in residual stage, more microcracks occur in higher normal stress.

Shear stress–displacement and microcrack–displacement curve in β = 30°.
The shear failure forms and the distribution of microcracks under different normal stresses are shown in Figures 12–14 when shear displacement reaches Points A, B, C, and D in Figure 11. In Figures 12–14, the dark particles represent the portion where the crushing occurs, the black circles are the microcracks, and the black solid lines are the cracks. The crack always initiates at the tip and then gradually grows. At the same time, microcracks start to initiate along the fracture zone. At initiation stage, the initiation of macrocracks mostly concentrates near the pre-existing crack. The distribution of the shear fracture zones is affected by the initial angle. The microcracks start to emerge sporadically and then start to grow and join with other microcracks. The microcracks start to grow rapidly with the increase in shear displacement, particularly near the pre-existing crack. Due to the effect of stress concentration at loading end, a large number of macrocracks initiate at the upper, right, and left boundaries of the model. The contacting surfaces of the crack undergo failures with the thickness of the shear fracture zone growing. When shear displacement increases further, microcracks increase and join each other and lead to the increase in fracture zone and the final coalescence.

The distribution of microcrack and shear fracture zone in σ1 = 1 MPa: (a) Point A, (b) Point B, (c) Point C, and (d) Point D.

The distribution of microcrack and shear fracture zone in σ1 = 5 MPa: (a) Point A, (b) Point B, (c) Point C, and (d) Point D.

The distribution of microcrack and shear fracture zone in σ1 = 10 MPa: (a) Point A, (b) Point B, (c) Point C, and (d) Point D.
Variation curve of shear stress and microcracks’ number along with the change in shear displacement at different crack angles are shown in Figure 15 when the normal stress is 10 MPa. In the whole process, the shear strength of the model is at the highest in β = 30° and at the lowest in β = 120°, with the shear strength at other angles close. When β is equal to 120° and 150°, the initiation stage and peak stage of the stress curve last for the shortest time and the peak value of shear stress occurs most early. At the initiation stage, the number of microcracks in different models is very close. It is not until the peak stage that the number starts to diverge. In peak stage, the number of microcracks increases rapidly, and the growth rate is basically close. At the end of peak stage, the number of microcracks is the greatest when β is equal to 30° and 60°, and the number is smallest when β is equal to 120° and 150°. In residual stage, the number of microcracks increases slowly. The results show in the shear stress loading process that the greater the number of microcracks, the more particle bonds need to be broken and therefore the more energies are consumed, which macroscopically means higher shear strength. In contrast, if a small number of microcracks can coalesce the shear failure surface, the shear stress will also be smaller accordingly.

Shear stress–displacement and microcracks–displacement curve in σ1 = 10 MPa.
Figure 16 shows the failure forms and microcrack distribution when the shear displacement in each model reaches the Point B in Figure 15. Given the same displacement, the scope of the fracture zone is relatively large when β is equal to 60°, 120°, and 150°, where the fracture zone extends from the crack tip to the boundary of the sample. However, the distribution of fracture zones at other angels is fragmented. In terms of distribution of microcracks, most of them concentrate at the shear fracture zones near the crack tip. When β is equal to 120°, there are few microcracks and no prominent macroscopic fracture zone appears.
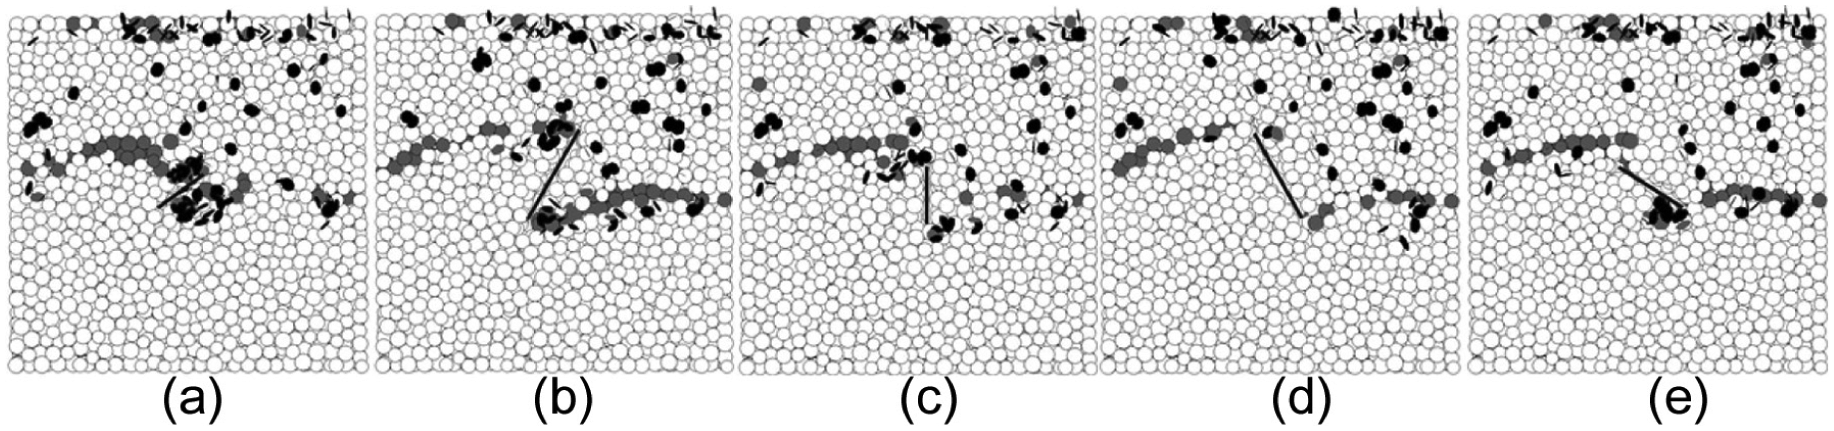
The distribution of microcracks and shear fracture zone of each model in σ1 = 10 MPa: (a) β = 30°, (b) β = 60°, (c) β = 90°, (d) β = 120°, and (e) β = 150°.
It is worth noting that under the same stress condition, the propagation behavior of the crack is different in various rock types. Compared with soft rock, the stress concentration in hard rock is higher, so the stress intensity factor of crack tip is higher, and the crack initiation critical condition and failure form are different. Many experimental phenomena show that the cracks tend to grow along the crack direction in soft rock, while the cracks tend to produce axial splitting in hard rock. The parameters of the numerical model are determined according to the strength and deformation characteristics of the marble in this article, so the results are close to the failure form of hard rock.
Conclusion
Under compression–shear stress, the crack in the rock is closed. The friction between the cracks affects the failure condition of rock mass. According to the maximum circumferential stress criterion and modified Griffith’s criterion, the crack initiation form and criterion have been derived, which are then verified by numerical simulation method. The conclusions in this research are listed as follows:
The calculation equation for crack initiation angle under compression–shear stress is reliable when β is less than or equal to 90°, and the results are close to the numerical simulation results. The deviation in calculation results from the actual results is relatively big when β is more than 90°. The crack propagates along the shear failure surface. Crack initiation angle correlates closely with the value of σ1/τx. When the value of σ1/τx is less than 0.1, the ratio barely affects the crack initiation value.
The friction between cracks restricts the compression–shear failure of the crack and increases the shear stress required for crack initiation. When normal stress increases, the ratio of crack initiation shear stress to peak shear stress decreases. The cracks at the angle of 120° weaken initiation shear stress of the crack and the shear strength of rock most prominently.
Under shear stress, due to the effect of stress concentration at the boundary of model, the forms of shear failure at the loading end and fixed end are slightly different. Under the premise of Mode I fracture, toughness KIC of the material is accurate, and the failure criterion derived from maximum circumferential stress criterion and modified Griffith’s criterion is basically reliable when β is less than or equal to 120°.
The changes in shear stress can be divided into elastic stage, crack initiation stage, peak stage, and residual stage. At crack initiation stage, microcracks initiate at a relatively slow level and concentrate near the crack tip. Besides, shear fracture zone at this stage does not coalesce the sample. At peak stage, microcracks grow rapidly, and the thickness of the shear fracture zone grows and coalesces the sample. The shear strength of the sample is proportional to the number of microcracks.
Footnotes
Acknowledgements
The authors would also like to acknowledge the editors and reviewers of this article for their very helpful comments and valuable remarks.
Handling Editor: Kai Bao
Declaration of conflicting interests
The author(s) declared no potential conflicts of interest with respect to the research, authorship, and/or publication of this article.
Funding
The author(s) disclosed receipt of the following financial support for the research, authorship, and/or publication of this article: This research is financially supported by the National Natural Science Foundation of China (Grant No. 41672258).