
Abstract
It is well accepted that the ratio of the dimple depth-over-diameter is a key geometric parameter in surface texturing design. In this article, the effect of this ratio on the average pressure is investigated by solving Reynolds equation numerically, where the Jakobsson–Floberg–Olsson cavitation theory is implemented using a mass-conservative algorithm. The results show that the optimum dimple depth-over-diameter ratio should be determined at the given depth or diameter larger than a critical value. Otherwise, the considerably smaller maximum value of average pressure will be obtained. Moreover, a dimple depth or diameter should be selected carefully in conjunction with the operating conditions to determine the optimum dimple depth-over-diameter ratio.
Keywords
Introduction
Surface texturing has emerged as a viable technique to significantly enhance the load-carrying capacity, friction coefficient, and wear resistance of vital tribological components such as bearings, mechanical seals, piston rings, and the like. To maximize the effect of surface texturing, many theoretical and experimental studies have been carried out that concentrate on the geometrical parameters of textures. See recent reviews in Gropper et al. 1 and Ahmed et al. 2 One of the often cited literatures on the subject is the work of Etsion et al., 3 who in 1999 investigated the effects of geometric parameters on the performance of spherical-shaped dimples on laser-textured mechanical seal faces. They reported that the dimple depth-over-diameter (DOD) ratio is the most important design parameter and that there exists an optimum value of this parameter which maximizes the average pressure. They further suggested that the preferable value of the ratio is in the range of 0.01–0.05, and that a higher velocity or a smaller clearance (by higher load) value would yield a smaller value of the optimum ratio. In a subsequent paper in 2013, Etsion 4 stated that to fully benefit from surface texturing, a proper optimization of the geometrical parameters, including the dimple DOD ratio and area density, must be performed in accordance with the application in hand. Therefore, the determination of the optimum dimple DOD ratio has received great deal of attention in recent tribology literature.
The hydrodynamic effect generated by laser surface texturing in liquids, studied in Etsion et al., 3 is also applicable to gas-lubricated, high-speed seals as shown in the model by Kligerman and Etsion. 5 They found that the main difference is the optimum dimple DOD ratio, which is much smaller in gas than in liquid-lubricated applications. Shi et al. 6 compared the load-carrying capacity performance of mechanical gas seals textured with mircogrooves and microdimples by numerical treatment of the Reynolds equation for compressible Newtonian fluid. The results indicated that the optimum dimple DOD ratio that maximizes gas film stiffness is around 0.005 and found it to be independent of the type of texture patterns, area density, and the seal clearance.
The dimple DOD ratio has been also found to be the most important parameter for enhancing the tribological performance of piston ring/cylinder assembly. 7 Ronen et al. 7 found that the optimum range of the DOD ratio is 0.1–0.18; this range yields a minimum friction force for a wide range of operating conditions. Wang et al. 8 used reactive ion etching to produce circular dimples on SiC thrust bearings and in a series of experiments investigated the effect of different geometrical parameters on the load-carrying capacity under water lubrication. They illustrated the effect of dimple DOD ratio in a load-carrying capacity map and stressed that the ratio can be optimized for given operating conditions.
Qiu and Khonsari 9 experimentally evaluated the performance of a series of fully textured, stainless steel rings with circular and elliptical dimples having the DOD ratio from 0.06 to 0.2. They observed that for a given density, an optimal ratio, DOD ≅ 0.1, exists that minimizes friction coefficient under various loads. In a later study, Qiu and Khonsari 10 applied an averaged Reynolds equation to parametrically study the performance of fully textured thrust bearings considering roughness effects. They also found that optimal values for DOD ratio exist, and it is highly depended on the sliding speed and cavitation pressure. 11
As can be seen from the discussion above, the dimple DOD ratio can be optimized to provide the maximum load-carrying capacity, highest film stiffness, and minimum friction coefficient. It is also generally accepted that the optimum ratio, as a dimensionless parameter, should be solely determined under a specified operating conditions and dimple area density. Thus, in most theoretical analyses on texture optimization — which is thought to be the preferred trial-and-error experimental work — the influence of the dimple DOD ratio is determined by changing the dimple diameter at a given dimple depth; see, for example, Shi et al. 6 and Qiu and Khonsari. 12 Several questions relevant to dimple DOD ratio arise at this stage that require further investigation. For example, for the identical operating conditions, does the predicted optimum dimple DOD ratio remain the same if one analyzes one parameter at the time, for example, by keeping the dimple depth constant and varying the diameter or vice versa? In this article, we address this question by treating the Reynolds equation with the mass-conservative Jakobsson–Floberg–Olsson (JFO) cavitation boundary condition. The optimum dimple DOD ratio that maximizes the average pressure under various operation conditions is analyzed in depth.
Analytical model
Figure 1 shows the geometry of a unit cell with one dimple, also taken as the computational domain to investigate the effect of the dimple DOD ratio. The dimpled surface is stationary and the runner surface moves with a sliding velocity u along the x-axis. The minimum film thickness is denoted by h0. The dimple is located in the center of the cell of sides L×L and modeled by an axisymmetric segment with a base radius rp and depth hp. The dimple area density Sp can be defined as
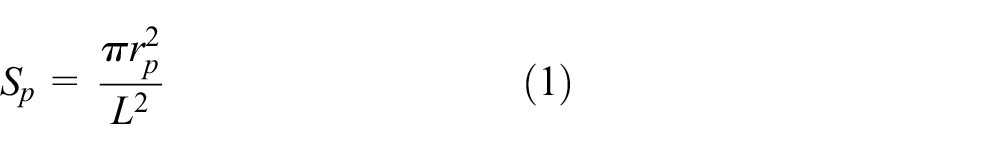
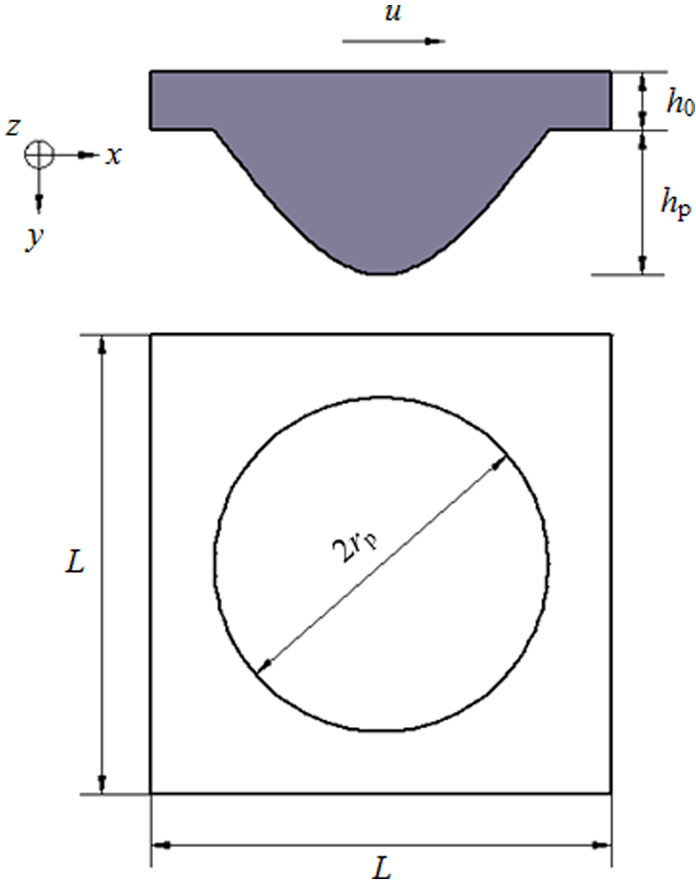
Diagram of the unit cell with one dimple.
The two-dimensional, steady-state form of the Reynolds equation for an incompressible Newtonian fluid in a laminar flow is expressed by

where μ is the dynamic viscosity, and h and p are the local film thickness and pressure at a specific point of the computational domain, respectively.
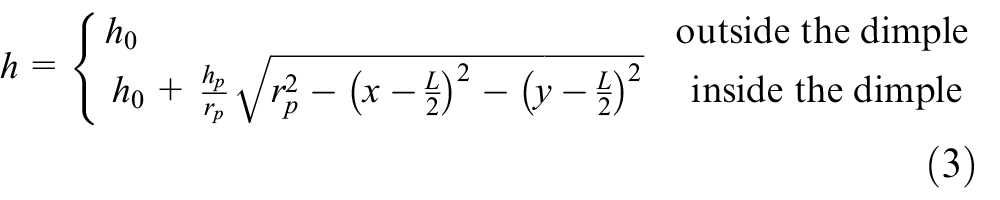
For the dimple with elliptic section in y-direction of this study, h can be given by
Periodic boundary conditions are applied in the sliding x-direction to account for the interaction between dimples. Assuming that the interaction in the z-direction is negligible, the boundaries in this direction are kept at ambient pressure. The above boundary conditions should be complemented by the conditions at the boundaries of possible cavitation regions associated with the dimple. In the present work, the JFO cavitation theory is implemented using a mass-conservative algorithm to accurately predict the behavior of cavitation. According to the JFO cavitation theory, the magnitude of the pressure in the entire cavitation region remains constant at the cavitation pressure pcav, which is “predetermined.” The film rupture starts at the location where the pressure derivative with respect to the normal direction is zero. The film reformation boundary is described by the following formula

where Vn is the fluid velocity in normal direction, and ρ and ρc are the local and cavitation density of the fluid, respectively.
Based on equation (2), to implement the JFO theory, the universal form of Reynolds equation developed by Elord and Adams 13 is adopted, which can be written as 14
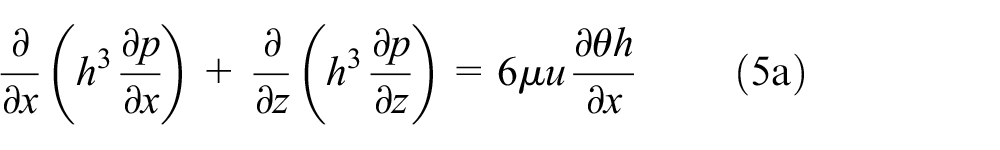


where θ (=ρ/ρc) is the film content.
By specifying the film thickness distribution h(x, z) and the relevant boundary conditions, the Reynolds equation, equation (5), is discretized by the finite difference method and then solved by the successive over-relaxation Gauss–Seidel iterative method for the pressure distribution p(x, z) in the film.
Using the pressure results, the average pressure for the unit cell is calculated from the expression
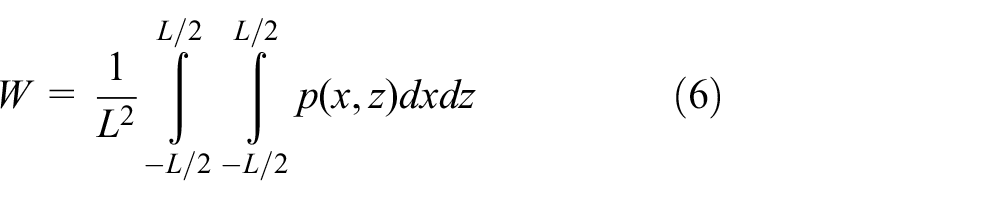
The optimum dimple DOD ratio in this article is defined as the ratio that maximizes the average load per unit area W.
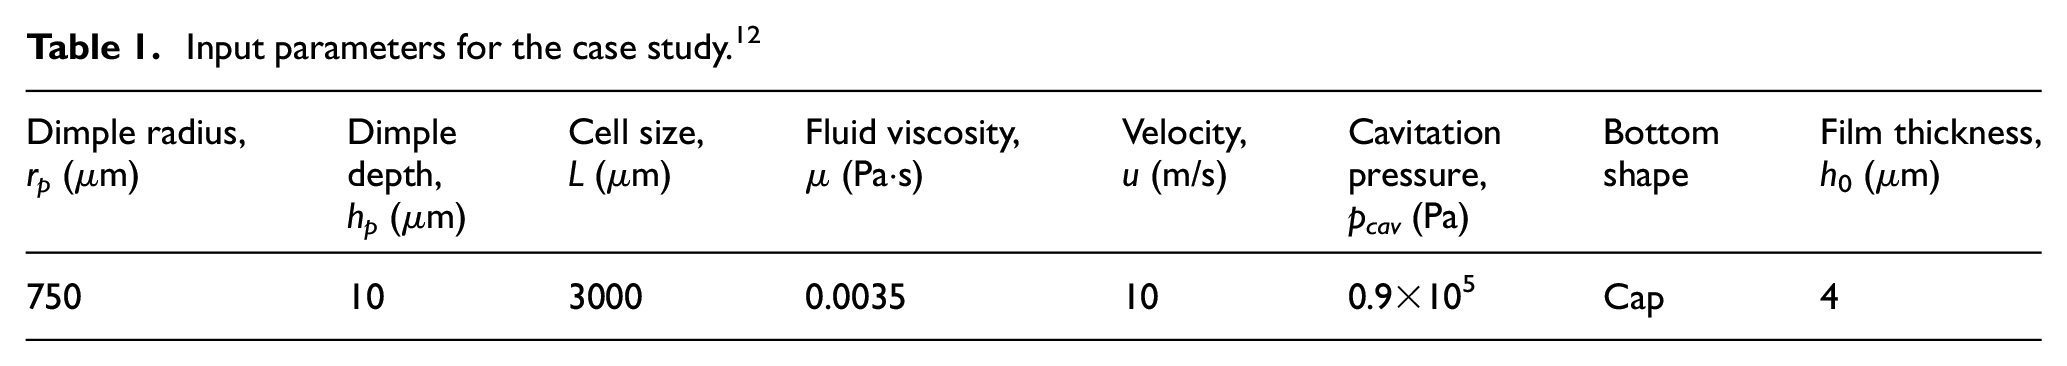
The correctness and accuracy of the solution for equation (5) is verified with a problem taken from Qiu and Khonsari. 12 Table 1 gives the input parameters for this problem, and the pressure contours of the unit cell reported in Qiu and Khonsari 12 along with the results of this study are shown in Figure 2(a) and (b), respectively. It is found that the pressure distributions and the corresponding values of load-carrying capacity are nearly identical in the two studies.
Input parameters for the case study. 12

Pressure contours of the unit cell: (a) Qiu and Khonsari 12 and (b) this study.
Results and discussions
In order to obtain the change in the dimple DOD ratio, two methods are adopted in the numerical simulation. One is to change the dimple diameter at a given dimple depth and another is to change the dimple depth while maintaining the dimple diameter constant.
During the simulations, the following parameters including operation parameters, cavitation pressure, and dimple area density are kept constant: μ = 0.1 Pa·s, u = 0.5 m/s, h0 = 2 μm, pcav = 30 kPa, 11 and Sp = 20%. It should be noted that the cell sides L will change when changing the dimple diameter based on equation (1) and, for this reason, the average pressure rather than the load-carrying capacity is taken as the evaluation parameter. The convergence tolerance, used in the iterative solution of the pressure, is set to be 10−8 for all the simulations and the grids vary from 101 × 101 to 301 × 301 for different sizes of the solution domain to ensure results are independent of the mesh density.
Figures 3 and 4 show the changes in the average pressure with dimple DOD ratio at various given dimple depths and diameters, respectively. Comparing the two figures clearly shows that the behavior of change in the average pressure as a function of the dimple DOD ratio depends on whether the dimple diameter is kept constant, depth is changed or the depth is maintained, and the diameter is varied.

Changes in the average pressure with dimple DOD ratio at various given dimple depths.
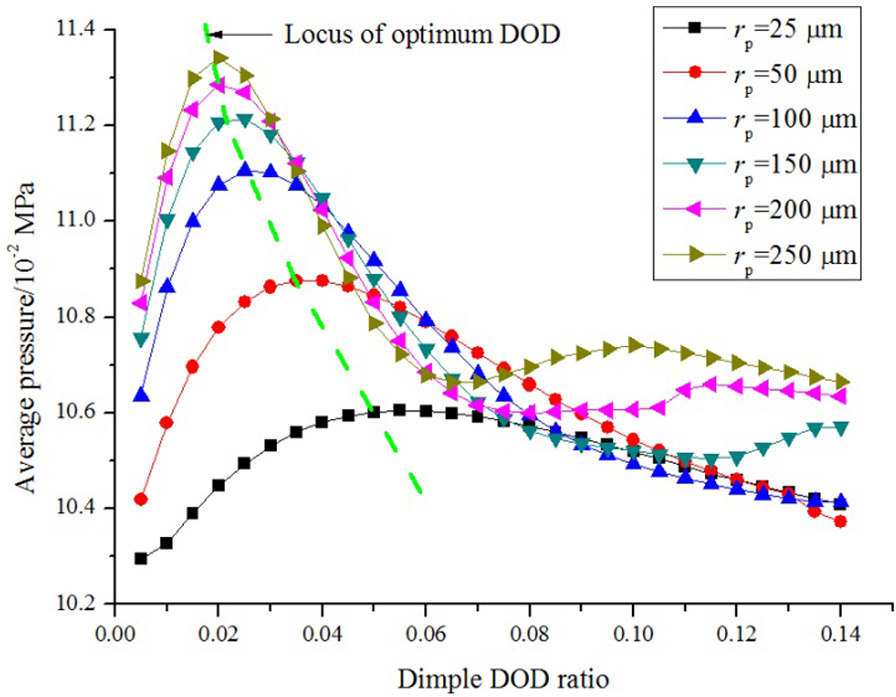
Changes in the average pressure with dimple DOD ratio at various given dimple diameters.
In particular, from Figures 3 and 4, the average pressure increases first and then decreases with the increasing dimple DOD ratio in most cases. That is, there exists an optimum dimple DOD ratio that maximizes the average pressure. This finding is consistent with previous studies. The curves rise again after the first peak at rp = 150, 200, and 300 μm in Figure 4. This is mainly because too large dimple depths are used for these situations, where the Reynolds equation is no longer applicable. Thus, their predicted unsuitable results are not included in the following analysis.
Note that for the same dimple DOD ratio with different dimple depth and diameter, the corresponding average pressures are different. These differences are very small under some conditions (e.g. for hp = 5 μm, rp = 25 μm and for hp = 10 μm, rp = 50 μm in Figure 3). In this case, the size effect of the dimple, defined as the dimple with the same DOD ratio with different depth and diameter, can be ignored, as also revealed by examining the results reported in Qiu and Khonsari. 12 However, the corresponding average pressures have considerable differences under some other operating conditions. For example, in Figure 3, when hp = 1 μm, rp = 50 μm and when hp = 2 μm, rp = 100 μm, and the same ratio of 0.01 yields considerably different average pressures. The same phenomenon can be found in Figure 4: when hp = 2 μm, rp = 25 μm and when hp = 4 μm, rp = 50 μm. Thus, it is not reasonable to ignore the size effect of the dimple without restriction. As shown further in the figures, the smaller the ratio and the given dimple depth or diameter, the more obvious the size effect of the dimple becomes. That is, the size effect of the dimple should be taken into account when both the given dimple depth or diameter and the dimple DOD ratio are small.
In previous studies, researchers have focused on determining the optimum dimple DOD ratio that maximizes the average pressure, the value of which was thought to be uniquely determined by the operating conditions and dimple area density. However, according to Figures 3 and 4, optimum ratios for different dimple depths or diameters are different.
Figure 5 further displays the change in the optimum dimple DOD ratio with the given dimple depth. As shown, with the increasing dimple depth, the optimum ratio increases gradually to a critical value (the point after which it begins to decrease, corresponding to hp = 4 μm in Figure 5) and then fluctuates within a narrow range. By comparing the values of average pressure under different optimum ratios in Figure 5, it is found that the average pressure fluctuates around its maximum slightly (from 0.15% to 2.60%) when the optimum ratio is larger than the critical value. If we define the optimal ratio that maximizes the average pressure at different given depths (or diameters) as the global optimal ratio, this analysis demonstrates that the critical value and its subsequent fluctuation values of the optimum ratio can be taken as the global optimum values. On the contrary, the local optimum ratio is defined when the optimum ratio is less than the critical value, where a considerably smaller average pressure is obtained. Thus, when selecting a given dimple depth, the local optimum DOD ratio should be avoided. Specifically, referring to Figure 5, the dimple depth should be chosen to be larger than its critical value (hp ≥ 4 μm in the present simulation study) to search for the optimum DOD ratio.

Change of the optimum dimple DOD ratio with the given dimple depth.
Similarly, the change in the optimum dimple DOD ratio with the given dimple diameter is shown in Figure 6. As can be seen, the optimum ratio decreases gradually to a critical value (the point after which it begins to increase, corresponding to rp = 200 μm in Figure 6) and then fluctuates within a narrow range as the dimple diameter increases. By comparing the values of average pressure under different optimum ratios in Figure 6, the local and global optimum ratios are also observed, and the global ones are obtained when the optimum ratio is larger than its critical value (corresponding to rp = 200 µm in Figure 6). Thus, when selecting a given dimple diameter, the global optimum DOD ratio should be involved. Specifically, referring to Figure 6, the dimple diameter should be larger than its critical value (rp ≥ 200 μm in the present simulation study) to reach the optimum dimple DOD ratio.
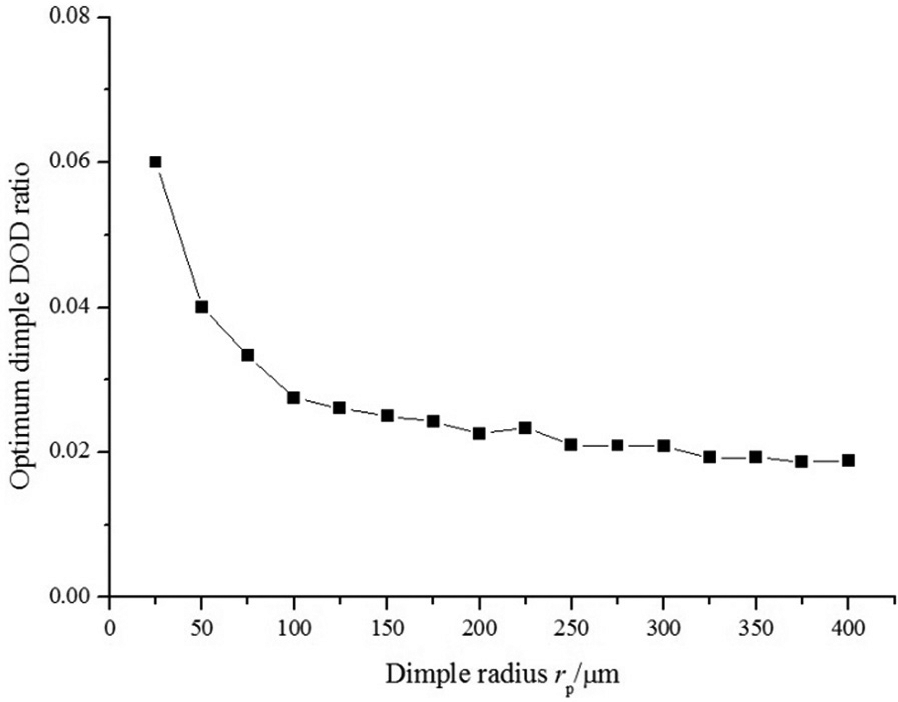
Change in the optimum dimple DOD ratio with the given dimple diameter.
Comparison of Figures 5 and 6 also reveals that the optimum dimple DOD ratio at the critical dimple radius of 200 µm (DOD = 0.02) is greater than the optimum dimple DOD ratio at the critical dimple depth of 4 µm (DOD = 0.015). Therefore, for an optimum design of surface texturing, the optimum dimple DOD ratio needs be explored to maximize the average pressure.
Based on the above simulation results, the uniqueness of the dimple DOD ratio, as a non-dimensional parameter, must be carefully examined. A non-dimensional form of equation (5a) is
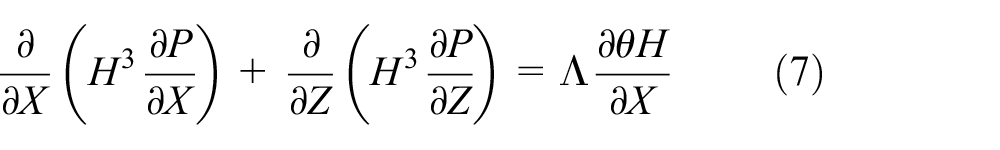
where H = h/h0, P = p/p0, X = x/rp, Z = z/rp,
Similar trend is expected for operating conditions such as sliding velocity u and dynamic viscosity μ, and minimum film thickness h0 are expected. In what follows, we examine two of these parameters.
Changes in the critical value for the given dimple depth or diameter with sliding velocity
The changes in the optimum dimple DOD ratio with the given dimple depth under various sliding velocities are displayed in Figure 7. As can be seen, the trends of the results are similar to those of Figure 5. The DOD ratio, both the global and the local optimum values, increases with the increasing sliding velocity at each specified dimple depth. These results are consistent with the findings in Greiner et al. 15 It is worth mentioning that the critical value for a given dimple depth remains unchanged with the change in the sliding velocity. Under the conditions simulated, hp = 4 μm for all the sliding velocities is considered in the present simulation study.

Changes in the optimum dimple DOD ratio with the given dimple depth under various sliding velocities (h0 = 2 μm).
Figure 8 shows the changes in optimum dimple DOD ratio with the given dimple diameter under various sliding velocities. As displayed, the similar variation of the optimum ratio can be found in Figure 6. The DOD ratio, for both the global and local optimum values, increases as the sliding velocity increases at each specified dimple diameter. It should be noted that the critical value for each specified dimple diameter increases with the increasing sliding velocity. In the present simulation study, the critical value for the given dimple diameter 2rp = 200 μm when u = 0.1 m/s and increases gradually to 2rp = 500 μm when u = 1.0 m/s.

Changes in the optimum dimple DOD ratio with the given dimple diameter under various sliding velocities (h0 = 2 μm).
As mentioned above, the global optimum dimple DOD ratios are larger for the given dimple diameter than for the given dimple depth. It still holds for various sliding velocities, as seen in Figures 7 and 8.
Changes in the critical value for the dimple depth or diameter with the minimum film thickness
The changes in optimum dimple DOD ratio with the given dimple depth under various minimum film thicknesses are shown in Figure 9. As can be seen, the trend of the variation of the optimum ratio is similar to the results in Figure 5: the ratios, both the global and local optimum values, decrease as the minimum film thickness increases at each given dimple depth. Moreover, the critical value for a given dimple depth increases with the increase in the minimum film thickness. For instance, the critical value for the given dimple depth hp = 2 μm when h0 = 1 μm and increases gradually to hp = 10.5 μm when h0 = 5 μm in the present simulation study. Examination of these results and Figure 7 reveal that the critical value for the given depth should be more than twice the minimum film thickness.
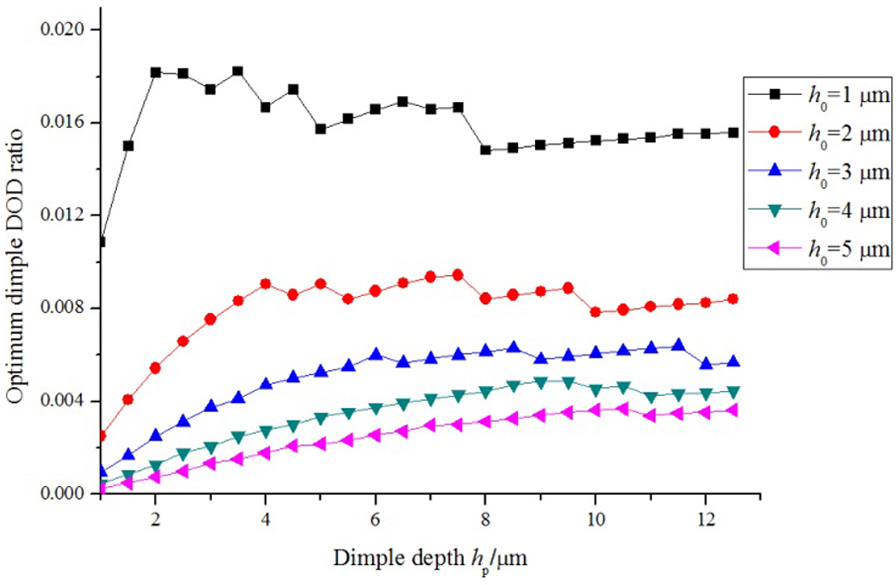
Changes in the optimum dimple DOD ratio with the given dimple depth under various minimum film thicknesses (u = 0.3 m/s).
Figure 10 displays the changes of the optimum dimple DOD ratio with the given dimple diameter under various minimum film thicknesses. These results are similar to those of Figure 6 for various minimum film thicknesses. Moreover, the global optimum ratio does not change with the change in the minimum film thickness, while the local one increases as the minimum film thickness increases at the given dimple diameter. It should be noted that with the increase in the minimum film thickness, the critical value for the given dimple diameter increases. In the present simulation study, the critical value for the given dimple diameter 2rp = 100 μm when h0 = 1 μm and increases gradually to 2rp = 250 μm when h0 = 5 μm.
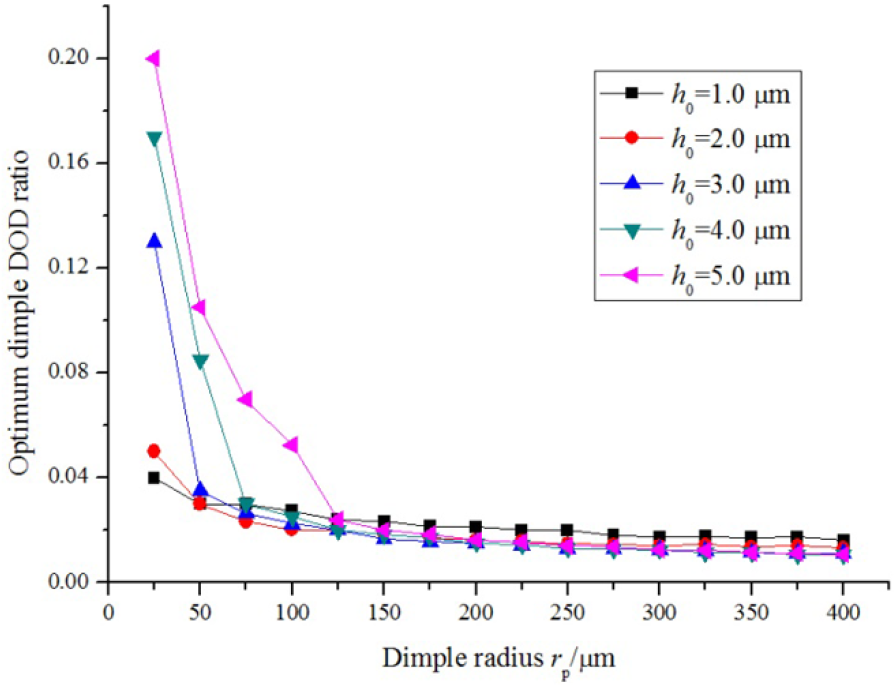
Changes in the optimum dimple DOD ratio with the given dimple diameter under various minimum film thicknesses (u = 0.3 m/s).
Finally, according to the results of Figures 9 and 10, the global optimum dimple DOD ratios are larger for the given dimple diameter than for the given dimple depth under various minimum film thicknesses.
Conclusion
The Reynolds equation is solved to investigate the effect of the dimple DOD ratio on the average pressure, where the JFO mass-conservative boundary condition is implemented to appropriately account for the cavitation effect. The changes in the dimple DOD ratio are obtained by changing dimple depth at given dimple diameters and by changing dimple diameter at given dimple depths, respectively. The optimum ratio that maximizes the average pressure for the given dimple depths or diameters is then analyzed under various operation conditions. The following conclusions summarize the outcome of the investigation:
The size effect of the dimple should be taken into account when both of the given dimple depth or diameter and the dimple DOD ratio are small.
There exists a critical value for the given dimple depth or diameter, below which the local optimum dimple DOD ratio yields a considerably smaller maximum average pressure. In contrast, the global optimum ratio is larger for a specified dimple diameter than for the given dimple depth.
The critical value for the given dimple depth should be more than twice the minimum film thickness and increases with the increase in the minimum film thickness while it remains unchanged as the sliding velocity or dynamic viscosity increases. The critical value for the given dimple diameter increases with the increase in the minimum film thickness and the sliding velocity or dynamic viscosity.
Both of the local and global optimum dimple DOD ratios increase as the sliding velocity increases at a given dimple depth or diameter. By contrast, with the increase in the minimum film thickness, the global optimum ratio decreases at the given dimple depth and does not change at the given dimple diameter. The local optimum ratio, however, decreases at a given dimple depth and increases at a given dimple diameter.
Footnotes
Academic Editor: Noel Brunetiere
Declaration of conflicting interests
The author(s) declared no potential conflicts of interest with respect to the research, authorship, and/or publication of this article.
Funding
The author(s) disclosed receipt of the following financial support for the research, authorship, and/or publication of this article: This work was financially supported by the National Natural Science Foundation of China (grant nos 51375245 and 51505230), the Natural Science Foundation of Jiangsu Province (grant no. BK20151519), China Postdoctoral Science Foundation Funded Project (grant no. 2017M611822) and the Natural Science Foundation in Jiangsu Province Colleges and Universities of China (grant no. 15KJB460002).