
Abstract
In this article, a novel Hybrid method based on particle swarm optimization and ant colony optimization (HPA) is proposed to forecast automobile sales of China. Proposed hybrid model integrating particle swarm optimization and ant colony optimization for estimation of Chinese automobile sales (HPAE) is the first model using aforementioned meta-heuristic techniques. HPA is developed for automobile sales forecasting using highway mileage, gross domestic product, automobile ownership, and consumer price index. HPAE is developed in two forms including both Linear (HPAEL) and Quadratic (HPAEQ). Then, in order to show the accuracy of the algorithm, a comparison is made with ant colony optimization and particle swarm optimization. The results show that mean absolute errors of the HPAE model are the best among them, and better-fit solutions are provided by quadratic form (HPAEQ) due to fluctuations of the influential indicators in China.
Keywords
Introduction
Forecasting sales and demand is crucial for the automobile industry since it always takes a relatively long time for the development and production processes. Only with the help of accurate predictions, firms can perfect market performance, reduce profit loss, and plan manufacturing processes more efficiently. Inaccurate forecasts may give rise to several negative consequences, such as overstocking or shortage of production supplies, high costs for different workforce activities, loss of reputation for the manufacturer, and even bankruptcy. Sales forecasting1–3 is considered as a realistic assessment of expected future demand. 4
In the past 30 years, automobile sales forecasting has received notable attention. To improve the forecasting accuracy, many methods are usually used by researchers around the word.5,6 Fantazzini and Toktamysova 7 proposed new multivariate models using economic variables and Google online search data to forecast monthly automobile sales. Sa-ngasoongsong et al. 8 presented a structural relationship identification methodology to multi-step forecast sales. Li et al. 9 forecasted the automobile carbon emissions based on rough set theory. In addition, both data mining and the time series analysis methods have been widely used. For example, Wang et al. 10 developed an adaptive network–based fuzzy inference system (ANFIS) to forecast automobile sales. Hülsmann et al. 11 applied data mining algorithms to model German and US automobile markets. Brühl et al. 12 proposed an automobile sales forecasting model for the German market using both time series analysis and data mining methods. Hülsmann et al. 13 presented the general automobile sales forecasting models based on both time series analysis and data mining techniques. For automobile sales forecasting, regression is also a kind of methods which is frequently used. Lin et al. 14 predicted automobile sales in China using support vector regression (SVR). Kitapcı et al. 15 analyzed the effect of economic policies to automobile sales in Turkey using both multiple regression and neural network analysis. Jun and Qing 16 optimized the weights and thresholds of structure of the back propagation (BP) neural network by genetic algorithm to automobile sales forecasting. A summary of automobile sales forecasting studies is given in Table 1.
Summary of automobile sales forecasting studies.
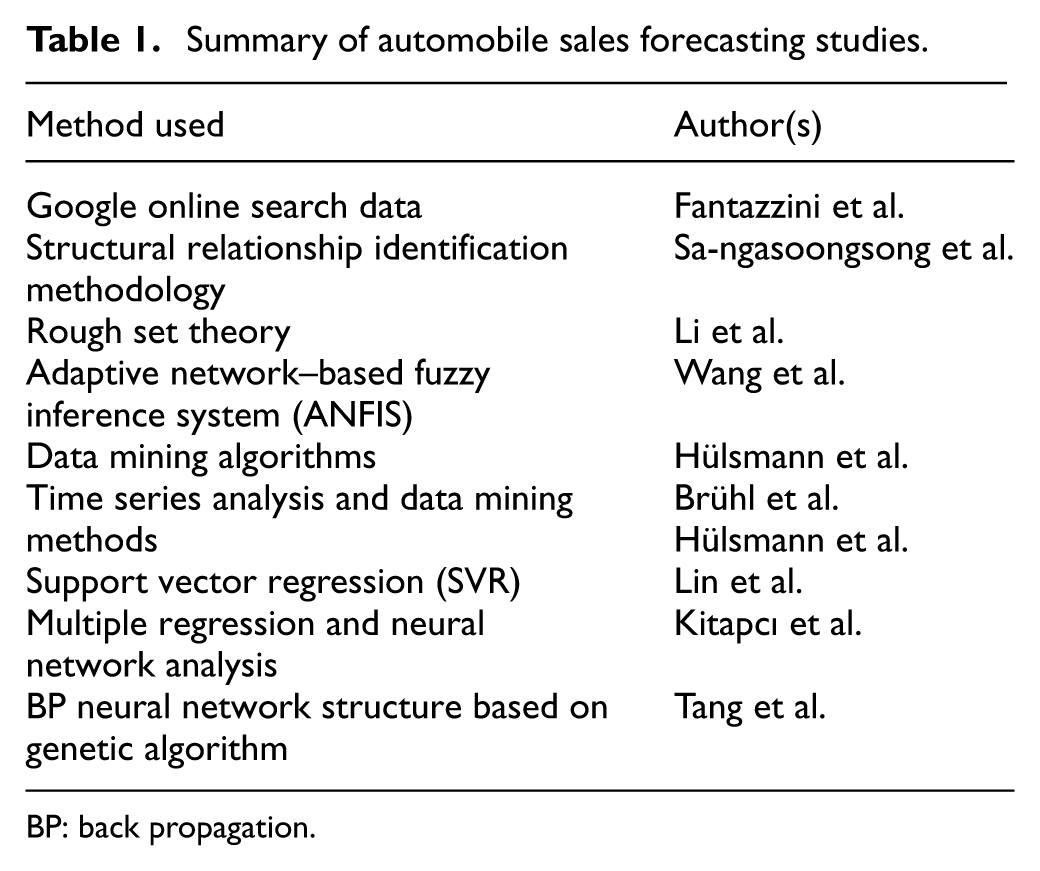
BP: back propagation.
Based on the literature, most proposed models for automobile sales forecasting applied a certain structure of economic theory to econometric approaches. But that does not necessarily mean that the underlying processes of automobile sales will follow these structures. It is known that automobile sales are mainly influenced by factors such as gross domestic product (GDP), consumer price index (CPI), oil prices, gas prices, highway mileage, and automobile ownership. However, with the development of economy and the costs of automobile reduced, the price factors are no longer sensitivity factors hampering the automobile consumption in China. In addition to these macroscopic factors, many microcosmic factors affected customer behavior in the automobile market, such as aesthetics, 17 form, function, and brand, 18 can also influence automobile sales at segment levels but not so in determining changes of automobile sales at aggregate levels.
This article presents the automobile sales forecasting model which applied hybridized particle swarm optimization and ant colony optimization for estimation of automobile sales (HPAE) and have both linear form and quadratic form. In the following section, the selection of indicators is briefly described. The basic PSO and ACO algorithms are given in section “PSO and ACO algorithms.” In section “Hybrid method based on PSO and ACO (HPA),” proposed hybrid algorithm is explained. In section “Forecasting model of automobile sales,” results obtained by automobile sales forecasting model (HPAE) and comparisons with PSO and ACO are presented. Finally, the conclusion of the study and the suggestions for future researches are given in section “Conclusion.”
Data
In this article, the sequence of annual automobile sales is the main time series, as reported in industry sources, during the period of 2000–2014. The dataset consists of automobile sales and selected indicators. As discussed in the previous section, the selection of indicators is intended to improve automobile sales forecasting. We conclude that the influential indicators must be selected to reveal a prominent relationship between automobile sales and indicators. In this article, the properties considered for the selection of indicators are as follows:
Indicators that characterize the influences of measures of traffic concerning the demand behavior in the automobile industry;
Indicators that influence the saturation degree of the automobile market;
Indicators that represent the national economy and changes in the economic cycle.
As the same time, all aspects of modeling issues in selecting the variables, such as multicollinearity, over-parameterization, and model restriction are considered. From the literature and preliminary tests as well as expert advisement, four annual influential indicators are selected: highway mileage, GDP, automobile ownership, and CPI. Table 2 summarizes the selected economic indicators for automobile sales forecasting. So, after the aforementioned selection criteria are considered, these four indicators are used to model to forecast automobile sales better. The data of automobile sales and four influential indicators between 2000 and 2014 are given in Figure 1.
Summary of variables.

GDP: gross domestic product; CPI: consumer price index.

The data of automobile sales and four influential indicators between 2000 and 2014.
PSO and ACO algorithms
PSO
PSO based on natural flocking and swarming behavior of insects and birds is one of the recent famous meta-heuristic techniques. The potential solutions called as particles, move through the problem space by following the current optimum particle in PSO. All particles determine the adaptive value by a fitness function to determine the location of the stand or fall at present. Each particle must be endowed with memory function. A resultant of three vectors defines the movement of each particle. One of them is a random vector known as velocity vector, and the two other vectors are created using the best locations experienced by the particles so far.19–22
A memory of its previous best position that is called pbest is kept by each particle, and the best value is called gbest which is a global best. The velocity updating formula of particle i in the first d dimension is as follows

The position updating formula of particle i in the first d dimension

where
In proposed PSO, equation (3) is used to obtain the w value. Indeed, inertia weight is an important factor that makes the algorithm convergent. The convergence is a very important target in any swarm-based technique. 23 Inertia function is obtained and used as follows

where t is the maximum iteration number and i is the current iteration index. According to the above explanations and equations, the flow chart of PSO is given in Figure 2.

The flow chart of particle swarm optimization.
ACO
In 1997, Dorigo and Gambardella 24 introduced the ACO that based on the foraging behavior of real ant colonies. If a food source is found by an ant, then it carries a portion of the food to the nest. At the same time, the ant leaves some pheromone on the way back which is known as the pheromone trail. All the other ants may act in the same way due to the pheromone on the way that is the most. The amount of the pheromone deposited on the ground completely relies on the quality and quantity of the source discovered.25–28
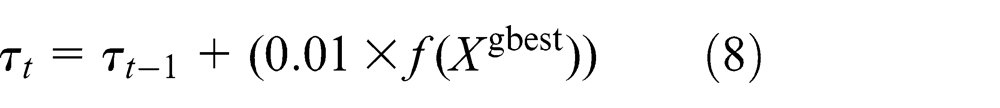
The quantity of the pheromone (τt) is intensified around the best objective value obtained throughout the simulation run in the continuous ACO algorithm. The location of the kth ant in the solution space is presented in the following equation

where ∂X is a random vector generated from

The
if

According to the above explanations and equations, Figure 3 shows the flow chart of ACO.
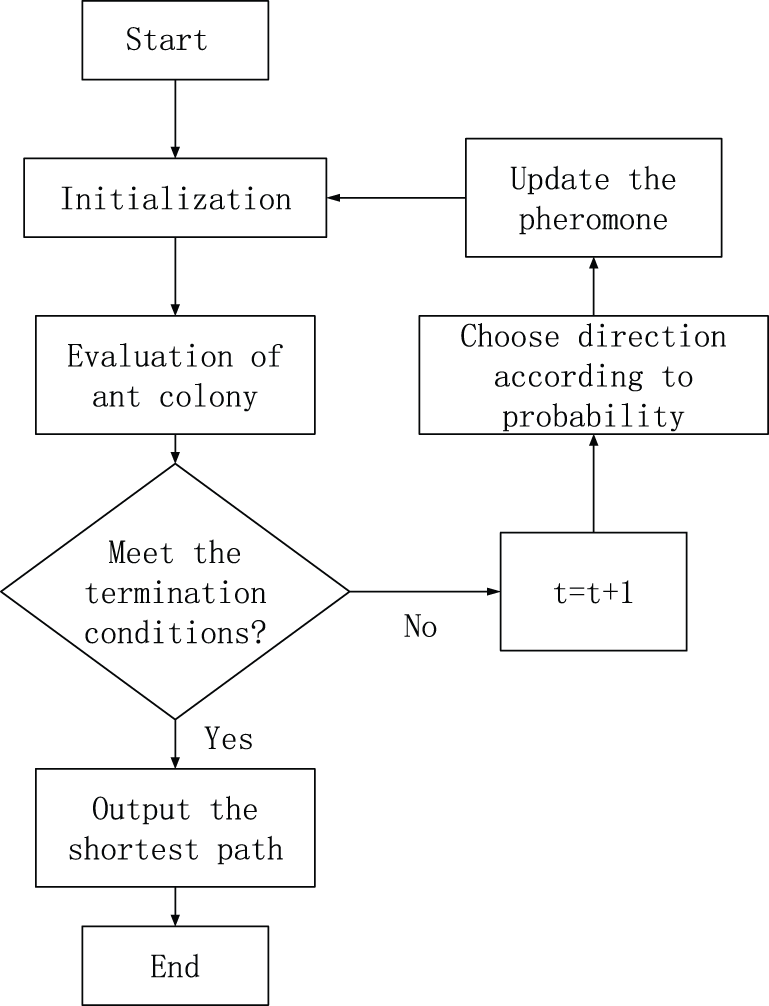
The flow chart of ant colony optimization.
Hybrid method based on PSO and ACO (HPA)
HPA combines capabilities of both PSO and ACO techniques. The hybrid technique of ACO and PSO will combine the advantages of both algorithms. The two best solutions are compared and then the better one is assigned to the global best solution of system in each iteration. Both the algorithms are capable of dealing with non-convex problems such as forecasting and estimation.31–38 PSO and ACO are motivated generating new solutions using the system solution parameters transferred to their global best. While pheromone trail is only updated around the best solution obtained in ACO, HPA are synchronous.
Originally, particles and ants are randomly distributed to the space for searching or may be set same values in HPA algorithm. While swarm and colony start showing individual behaviors, they begin to be influenced by the system global best during any iteration. Then, while equations (1)–(3) are used by the particles to close to the global minimum, equations (4)–(8) are used by the ants to reach to the global minimum. The best solutions obtained in PSO and ACO are compared during any iteration. Where pgbest and xgbest are the best solutions of swarm and colony, Table 3 shows interaction between swarm and colony.
Interaction between swarm and colony.

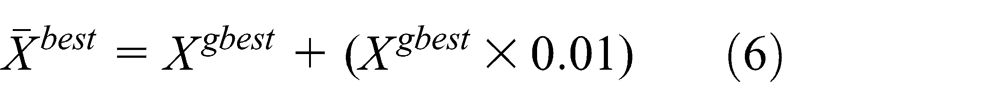
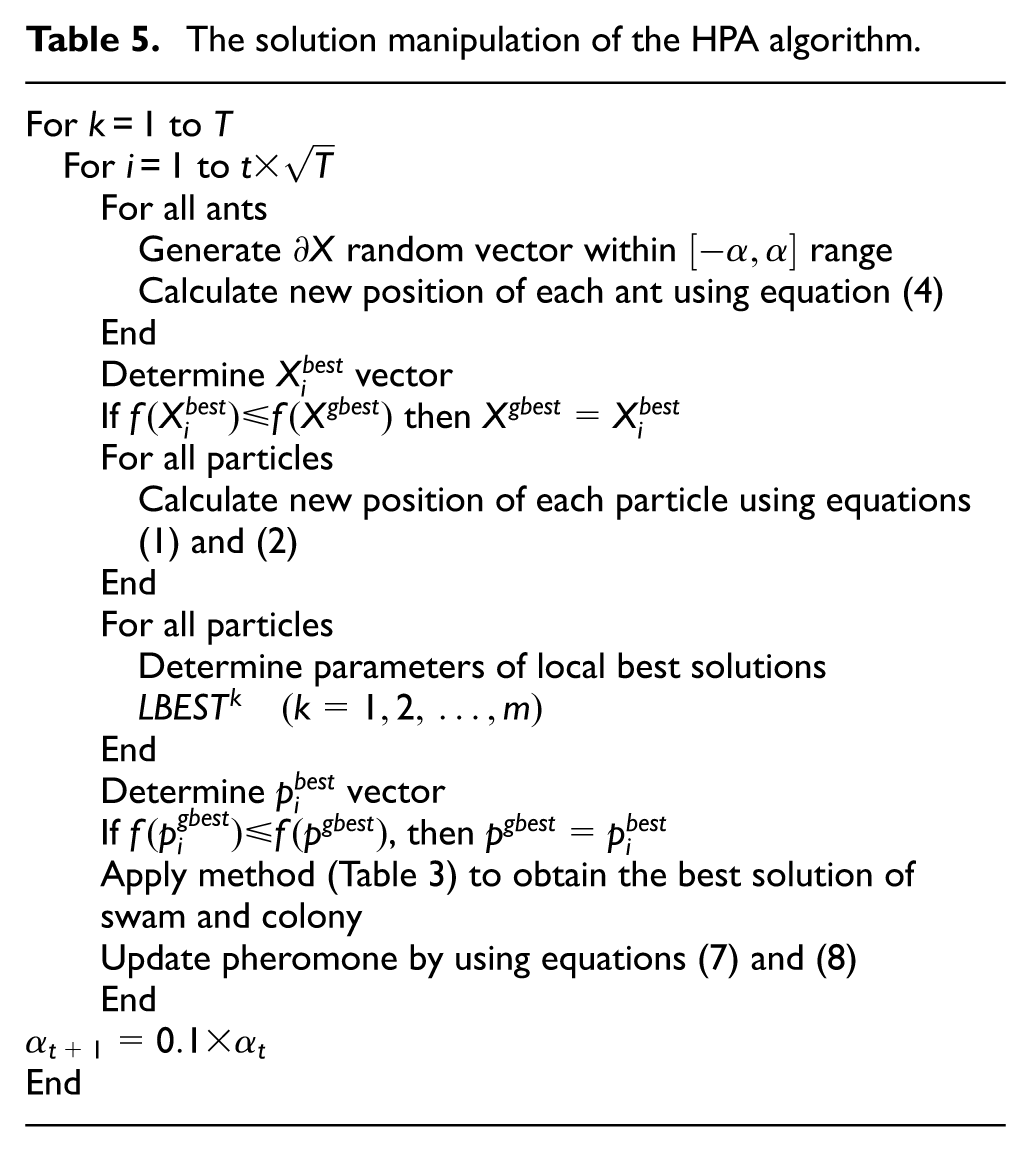
If the best solution of ACO is influenced by the best solution of PSO, its movement direction must be updated. Thus, the direction operator must be kept up to date during the iterations by being used equation (6). HPA has two main algorithmic parts which are initialization and solution manipulation. According to previous explanations and equations, Table 4 shows the initialization phase, and Table 5 shows solution manipulation phase of the algorithm of HPA.
Initialization of HPA.

The solution manipulation of the HPA algorithm.
Forecasting model of automobile sales
In this section, the model and result are introduced in detail. We first describe the establishment of the model and its performance. Finally, the comparison of the hybrid algorithm and other methods is given.
The establishment of the forecasting model
Four indicators and automobile sales of China between 2000 and 2014 are shown in Table 6. The data are collected from the National Bureau of Statistics and the China Association of Automobile Manufacturers. According to Figure 4, it can be seen that there is almost a linear relationship between four indicators and automobile sales, respectively. However, linear methods also contain many limitations. For example, some potentially useful relations are easy to be disregarded if only linear method and linear models also contain fewer coefficients. After considering these issues, the automobile sales forecasting based on four indicators was modeled using various forms in this study. Hybrid model integrating particle swarm optimization and ant colony optimization for estimation of Chinese automobile sales in linear form (HPAEL) can be expressed as follows

and Hybrid model integrating particle swarm optimization and ant colony optimization for estimation of Chinese automobile sales in quadratic form (HPAEQ) can be expressed as follows

Automobile sales, highway mileage, GDP, automobile ownership, and CPI.

GDP: gross domestic product; CPI: consumer price index.

The relationship between four factors and automobile sales.
HPAE model optimizes coefficients
PSO algorithm uses fitness function as reference, optimizing prediction model, and finding the optimal estimation.39–43 The following fitness function is established by minimizing the mean absolute error between the observed and estimated values 44

where
The performance of the forecasting model
HPAE models (HPAEL and HPAEQ) are developed to the future automobile sales forecasting based on highway mileage, GDP, automobile ownership, and CPI (Table 6). The HPAE model is coded with MATLAB. Setting the optimal parameters of PSO and ACO is also important. The values of c1 and c2 are set to be 2 according to Shi and Eberhart 45 who performed an extensive study for finding proper values. Hence, these fixed values are also used in this study. And the other parameters are considered as follows: number of particles (m): 20; number of ants (n): 40; inertia weight (w): 1; number of maximum iteration (I): 100,000. The data (2000–2009) are used to determine the coefficients of HPAE models. Following HPAE (linear and quadratic) equations are obtained for automobile sales forecasting. In the linear form, coefficients obtained are given below


In the quadratic form, coefficients obtained are given below
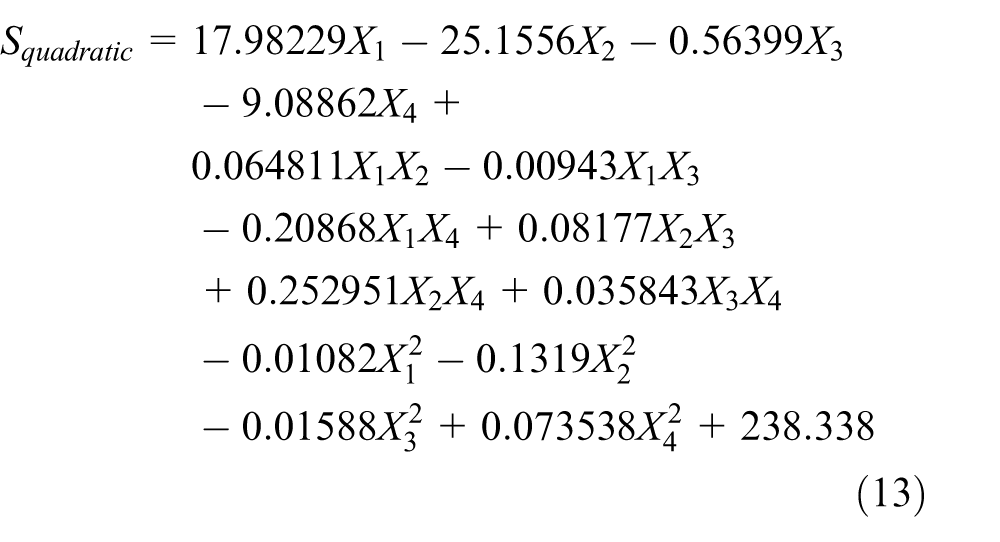

where
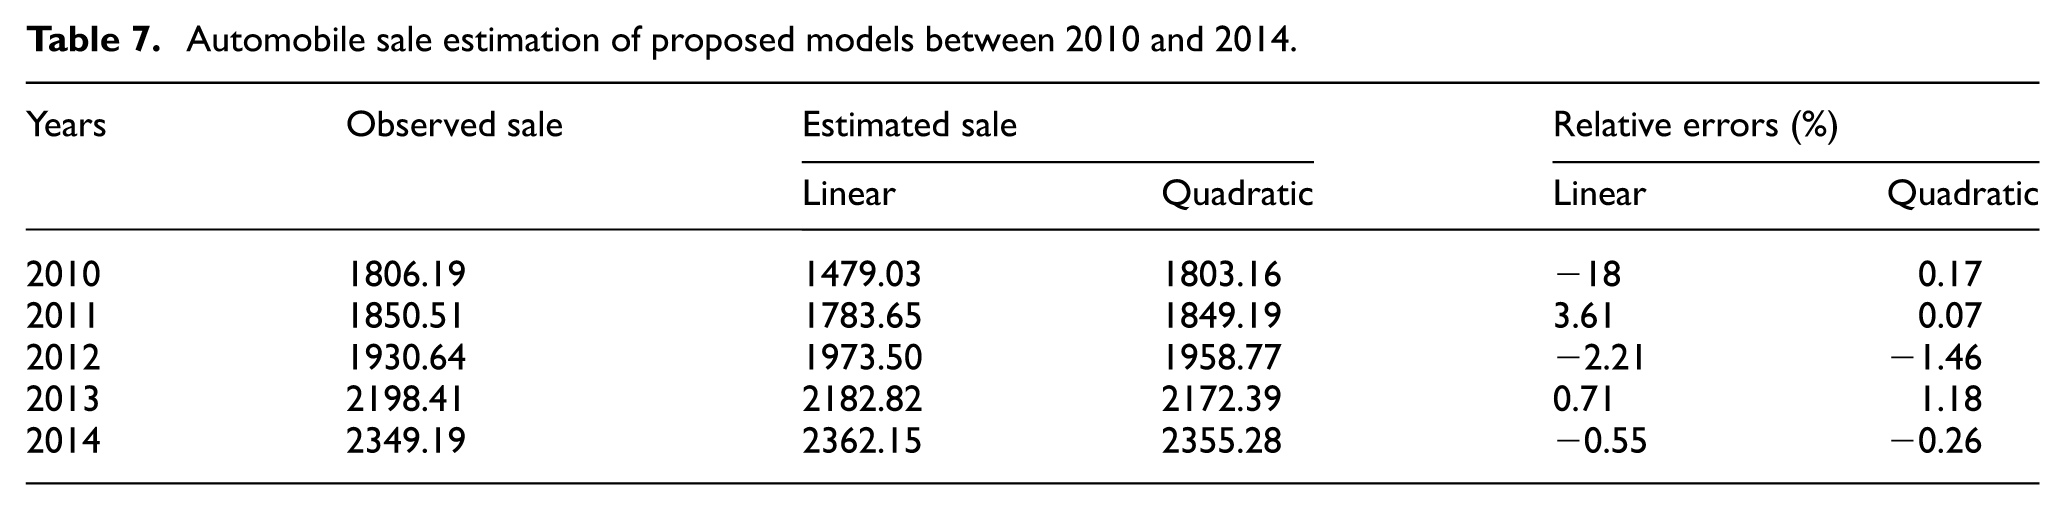
Automobile sale estimation of proposed models between 2010 and 2014.
The comparison of the proposed hybrid algorithm and other methods
When 5-year data are considered (2010–2014), proposed approach finds less relative error than the single method in both linear form and quadratic forms. Tables 8 and 9 give coefficients and forecasting relative errors of each method in linear form and quadratic forms, respectively. And the comparisons between proposed HPAE model, PSO, and ACO are shown in Figures 5 and 6. It exposes that proposed HPAE model is providing better-fit estimation than ACO and PSO whether in linear form or quadratic form.
Comparisons of coefficients and mean absolute error in linear form.

ACO: ant colony optimization; PSO: particle swarm optimization.
Comparisons of coefficients and relative errors in quadratic form.
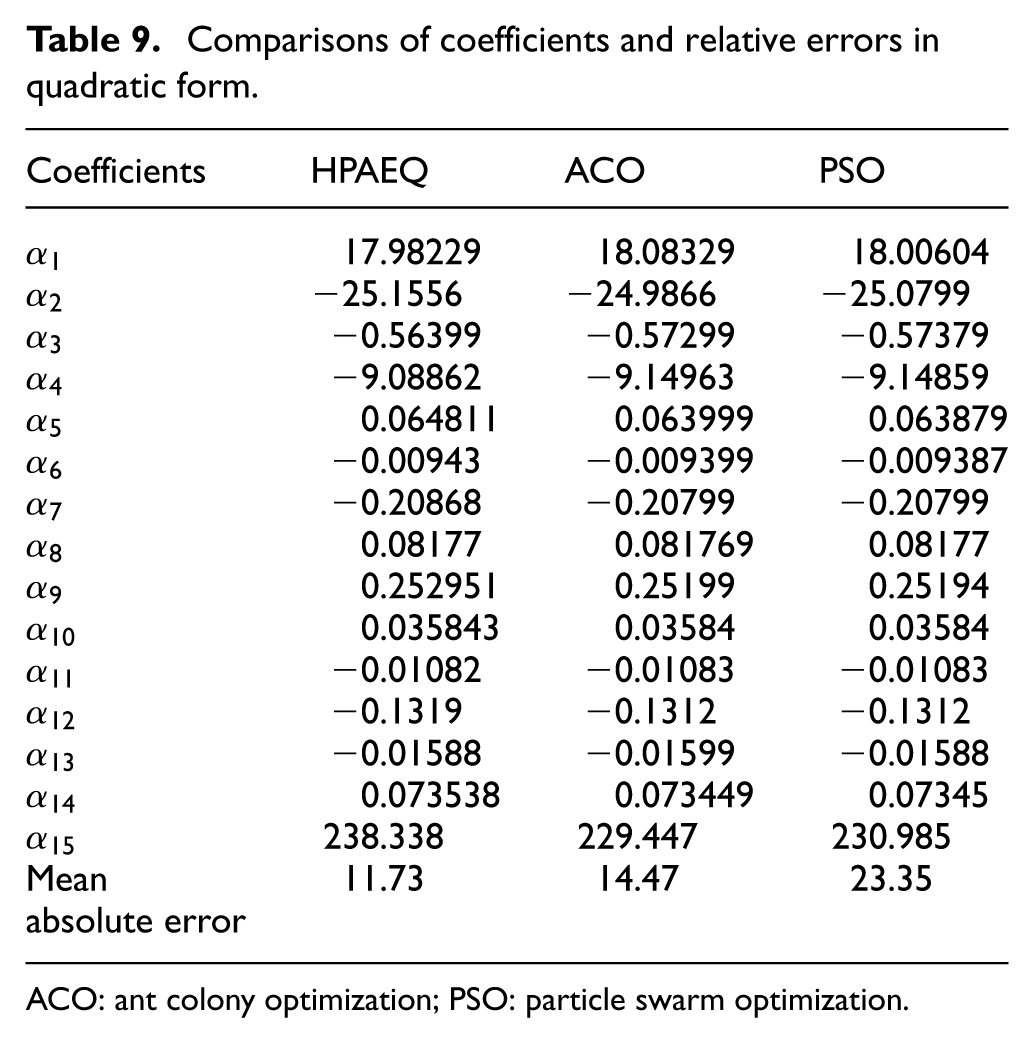
ACO: ant colony optimization; PSO: particle swarm optimization.

Comparisons of automobile sales in linear form.

Comparisons of automobile sales in quadratic form.
Conclusion
Accurate automobile sales forecasting is critical in the automobile industry. With the evolution of intelligent technology, meta-heuristic techniques on automobile sales forecasting have been popular methods to forecast better. And it can lead to a higher quality result with a faster convergence profile by the hybridization of the two algorithms to optimize the forecasting model. So, automobile sales forecasting with a hybrid model based on PSO and ACO is adopted in this article. There are a lot of factors affecting automobile sales of China; among the factors, four key indicators considered here are highway mileage, GDP, automobile ownership, and CPI. In order to meet the fluctuations of automobile sales, there are two forms (linear and quadratic) of the HPAE model developed. In order to show the availability and advantages of proposed approach, 15-year data (2000–2014) are collected, in which 10-year data (2000–2009) are used to model, and the 5-year data (2010–2014) are calculated to validate the accuracy of results. Three optimization methods are compared to automobile sales forecasting in the years 2000–2014 using the two forms of the HPAE. The methodology of hybridization is extensively explained, and the results show its capability in providing a robust forecasting model. The empirical results indicate that the accuracy of the proposed approach to the automobile sales forecasting of China is acceptable and better than PSO and ACO.
Although two kinds of model have been provided to the automobile sales forecasting in this study, researching the combination of different meta-heuristic methods also will be necessary in the future. In addition, the number of economic indicators of the model proposed is limited, so the suggestion for next work is to take more economic indicators into consideration to the automobile sales forecasting.
Footnotes
Academic Editor: Tao Feng
Declaration of conflicting interests
The author(s) declared no potential conflicts of interest with respect to the research, authorship, and/or publication of this article.
Funding
The author(s) disclosed receipt of the following financial support for the research, authorship, and/or publication of this article: This work is partially supported by Humanity and Social Science Youth foundation of Ministry of Education of China 13YJCZH042 and Specialized Research Fund for the Doctoral Program of Higher Education of China 20120041120018.