
Abstract
An aerotrain model containing wings with variable angles of attack and positions is constructed. Numerous wind tunnel experiments are conducted to research the influences of angles of attack and relative positions of the wings on the aerodynamic performances of the aerotrain. Experimental results show that the influence of relative positions is insignificant in contrast to that of angles of attack. A long distance between the front and rear wings indicate good aerodynamic performance. The long distance can increase the lift coefficient of the model but has little influence on the drag coefficient. Two representable wing location conditions are selected to measure the pressures on the wing surface. The distribution curves of the wing surface pressures are obtained. The relationship among wing surface pressures, angles of attack, and locations is determined. Flow visualization experiments are conducted on two conditions, and the flowing law on the upper surfaces of the front and rear wings is identified.
Introduction
The development of the social economy and the expansion of human activities have led to great problems on the environment and a shortage of resources. Therefore, high efficiency of transportation media, instead of high speed alone, has been paid significant attention to. In the future, the next-generation transportation system must include two significant features, namely, high speed and high efficiency. 1
A high-efficiency ground transportation system, aerotrain,2,3 is proposed, as shown in Figure 1(a), based on the circumstances faced by humans, and Figure 1(b) shows the concept map of new generation aerotrain. The wing-in-ground (WIG) effect is the key for aerotrain to fly near the ground surface. When an airfoil or wing-like object is close to the ground, a high-pressure air cushion will be created for the stagnation of the air that generates greater lift force and greater lift–drag ratio (L/D) than the airfoil in the high sky. It is the same principle which is adopted in turning round of aerotrain for the existence of a U-shaped guideway. When the aerotrain has to turn round, the distance between guideway and guide wings (the vertical wing shown in Figure 1(a)) will decrease. Then, a large yawing force will generate for the WIG effect. At one side, the front and rear guide wings will generate different yawing forces. This difference will bring yaw moment to help aerotrain turn round. Similar to the yaw moment, WIG effect can also provide righting moment to ensure the stability of aerotrain when the rolling happened. 4 Compared with magnetically levitated trains and other WIG-effect crafts on water surface, the WIG train system has lower drag and a higher security coefficient for the U-shaped guideway.5–9

The concept maps of aerotrain (a) Concept map of first generation of aerotrain. (b) Concept map of second generation of aerotrain.
But the lift force may not be equal to the gravity of aerotrain while the train is traveling at a constant velocity, that is, aerotrain will have a fluctuant velocity vertical to the ground. Thus, the distance sensors and wing flap should be applied to measure and adjust the distance between ground and airfoil and then limit the vertical velocity. Because of fluctuant vertical velocity, a complicated control system and super computer are required to provide accurate and timely adjustments. However, in some conditions of low running speed like starting, there will be insufficient lift force. At that moment, the undercarriage wheels are required to support the train and assist running.
WIG system is proven to have low energy consumption. In a previous research, the Tohoku University in Japan identified a series of economic efficiency values (eco factors) of different common transportation tools, as shown in Figure 2. The formula of economic efficiency values (eco factors) is shown as follows

where E is the eco factors, L is the lift force of a transport, and D means the drag. U is the cruising speed of one transport and P is payload.10,11

Eco factors of several transportation tools.
Aerotrain, as a public transportation system, should have sufficient carrying efficiency and more than one couple of wings to avoid having a large wing size in consideration of the limited dimension of a U-shaped guideway. However, this feature leads to different airflows between the front and rear couples of the wings. The flowing condition of air is modified after flowing past the front wing. The aerodynamic parameters of the rear will consequently be greatly different from those of the front. Thus, an appropriate distance between the two couples of the wings is considered in this research. Angles of attack, same as the distance between front and rear wings, have a considerable influence on the parameters of the aerotrain. 12 The aerodynamic parameters are affected by the changes in locations and angles of attack of wings. Hence, researching the effects of different factors (locations and angles of attack of wings) on the aerodynamic performance of the aerotrain and seeking a series of suitable collocations of the angles of attack and positions of wings are significant. In this study, the entire model of an aerotrain (with train body and four wings) is constructed to investigate the influence of angle of attack and relative position of wings on the aerodynamic performance of the aerotrain.
Experimental apparatus and configurations
The experimental model is established with the proportion of 1–10; thus, the entire length is approximately 1 m, and the chord of each wing is 176 mm, as shown in Figure 3 and Table 1. The chosen airfoil profile is designed for aerotrain in specialty. According to the design conditions of aerotrain, a typical airfoil is chosen, LA203A, which has excellent aerodynamic performance; then, the shape function is optimized to obtain the acceptable airfoil profile. 13

Planform of the experimental model.
Experimental model details.

Attention should be paid to the relative positions between the wings and the train body. Four collocations of the front and rear couples of wings are considered, that is, each couple of wings has two positions. The position of the front wings closer to the train head is denoted as A, and the other position of the front wings is A*, as shown in Figure 4. Similar to the front ones, the position of the rear couple of wings closer to the train head is denoted as B, and the one closer to the tail of the train body is B*. The distances of wings differ according to the different locations of wings. As shown in Figure 4, the largest distance between the two couples of wings is approximately 528 mm, which is three times the distance of the wing chord. The shortest distance is 440 mm, which is equivalent to two and half chords of the wing. It is obvious that the flow field between front and rear wings will change for the worse if the distance becomes too small.
Four locations of tandem wings.
According to the previous researches of Lai et al., 13 the aerotrain model will have the best aerodynamic performance when the angle of attack of the chosen airfoil is about 5°. Meanwhile, the WIG effect will decrease the angle of stall, and there will be a risk of stall if the angle of attack of airfoil is too large. However, the angle of attack of wings should be variable, that is, the models of train body and wings are manufactured, respectively, thus a rotation axis and a fixed pin were designed on every wing. For the four positions of the two couples of airfoils, three angles of attack are considered, that is, the angles of attack of the front and rear couples are the same, and 12 collocations exist in total.
The pressure difference between the upper and lower surfaces of an airfoil will appear when airflow flows past with a velocity. Thus, the airflow at the lower surface will have a tendency to roll up across the wing edge to overcome the pressure difference between the two surfaces, and the wingtip vortex will then be generated. The generation and development of a vortex will consume the energy of the airflow and decrease the static pressure in the region where the vortex exists. The drag force of the model will consequently augment. The end plates, being connected at the edge of each airfoil, are designed to prevent or weaken the vortex and increase the local loading of the airfoil. Meanwhile, the plates will be the basis of further experiments on the vertical wings, which play significant roles in the diversion of the aerotrain. As mentioned above, aerotrain, as a rail transportation system, has a U-shaped guideway as the orbit. A simple U-shaped guideway is set up to simulate the real operating conditions, as shown in Figure 5.

Aerotrain and guideway models.
Given the small-sized part at the trailing edge of a wing, the rotation center of the wing is prohibited from being set up at that area of a wing, and the ground clearance of wings will change following the changes in the angle of attack. Owing to the existence of the train body, the influence on the L/D caused by the changes in ground clearance of the wings is different from the condition with wings only. As shown in the former research of the author, when the train body exists and the ratio of the ground clearance to the chord is in the range of 0.2–0.3, every 0.1 reduction in the ratio will lead to an L/D increase by approximately 5%. In this experiment, the ratios are equal to 0.27, 0.25, and 0.2 when the angles of attack are 0°, 5°, and 10°, respectively.
The experiments are conducted in the Automotive Wind Tunnel of Jilin University, with experimental wind velocity of 35 m/s. This return circuit wind tunnel has low turbulence. Schematic diagram of model, experiment supports, and nozzle shape of wing tunnel test section is shown in Figure 6. The shape of the nozzle shows like a polygon, and the height is 2.2 m and the width is 4 m, so the area of nozzle is 8 m2. The total frontal projected area of the experimental model, U-shaped guideway, bottom plate, and supports is 0.324 m2. Thus, the blockage ratio is 4.05%. Thus, the blockage ratio is less than 8%, and the blockage phenomena of the wind tunnels can be ignored. 14 The experimental models of the aerotrain and U-shaped guideway are shown in Figure 7. Because the moving ground zone could not be applied on the U-shaped guideway and experiment bench to remove the boundary layer, the leading edge of the guideway and the bottom plate of experiment bench have been smoothed before the experiments, to reduce the thickness of the boundary layer when the airflow flowed into the U-shaped guideway.
Schematic diagram of experimental model and the nozzle.
Experimental model in the wind tunnel.
In order to further reduce the thickness of boundary layer, there is a groove on the bottom plate, in front of model. Previous experiments showed that the thickness of boundary layer on the bottom plate would reduce by 30% when the airflows blew across the groove at the velocity of 35 m/s. According to the wind speed and experiment bench, the thickness of boundary layer on the bottom plate has been estimated at 23 mm at the end of the experimental model, which would be less than the distance between bottom plate and undersurface of model.
A three-axis force sensor, which was fabricated by Shenzhen Ligent Sensor Tech Co., Ltd is used to measure the aerodynamic forces of the aerotrain model in the wind tunnel experiment. The type of the force sensor is LF-303M, and the measurement accuracy is 0.02–0.03 N. The pressure sensors of sheet shape are pasted on the surface of a wing to obtain the pressure, and the pressure measurement system is the pressure scanning valve fabricated by Pressure Systems International, Inc., and the type is 98RK-1.
Results and discussion
Pressure on wing surface
The pressures on wing surface are measured in two representative conditions; one has the longest distance (A–B*, 528 mm) and the other has the shortest distance (A*–B, 440 mm) between the front and rear wings with an angle of attack of 5°. Four planes are selected as the locations of the wing surface pressure distribution curves, as shown in Figure 8. The locations of pressure gages are shown in Figure 9. The experimental velocity is set at 35 m/s.
Locations of the planes.

Locations of pressure gages.
The distribution curves of surface pressure for the front and rear wings are given in Figures 10–13, respectively.
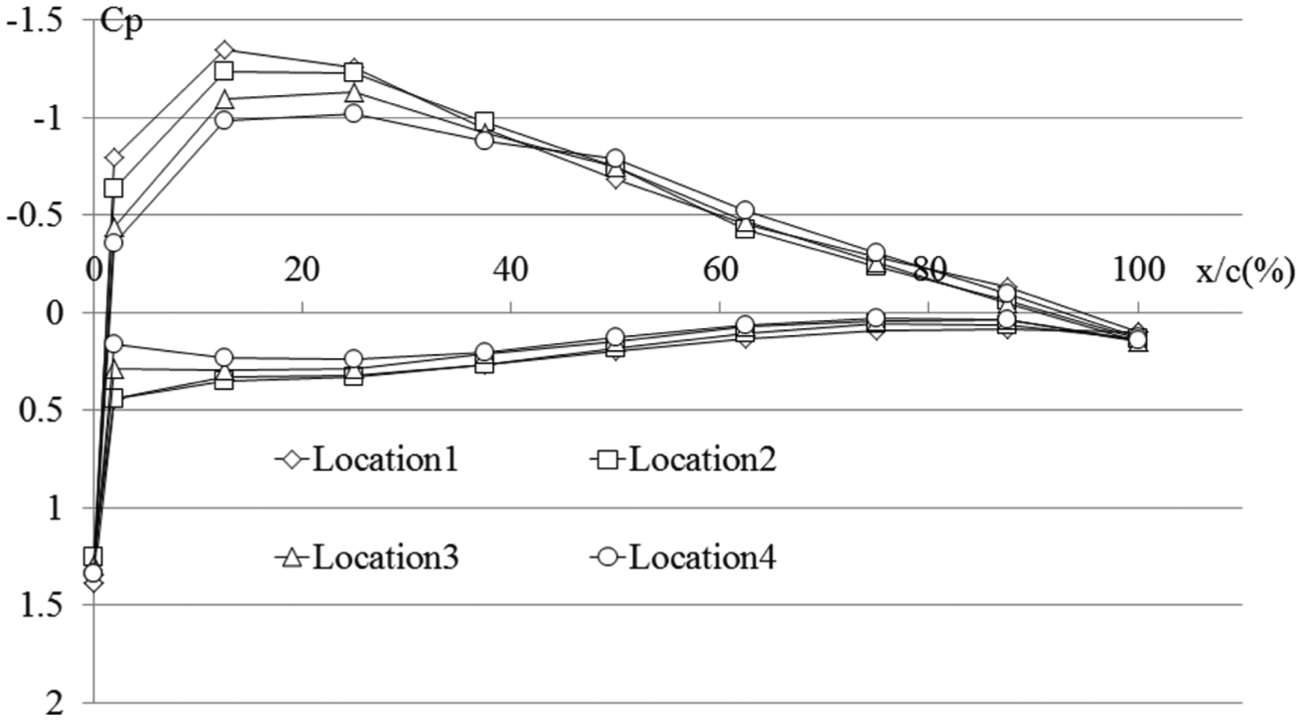
The pressure distribution curves of front wing at position A–B*.

The pressure distribution curves of front wing at position A*–B.

The pressure distribution curves of rear wing at position A–B*.
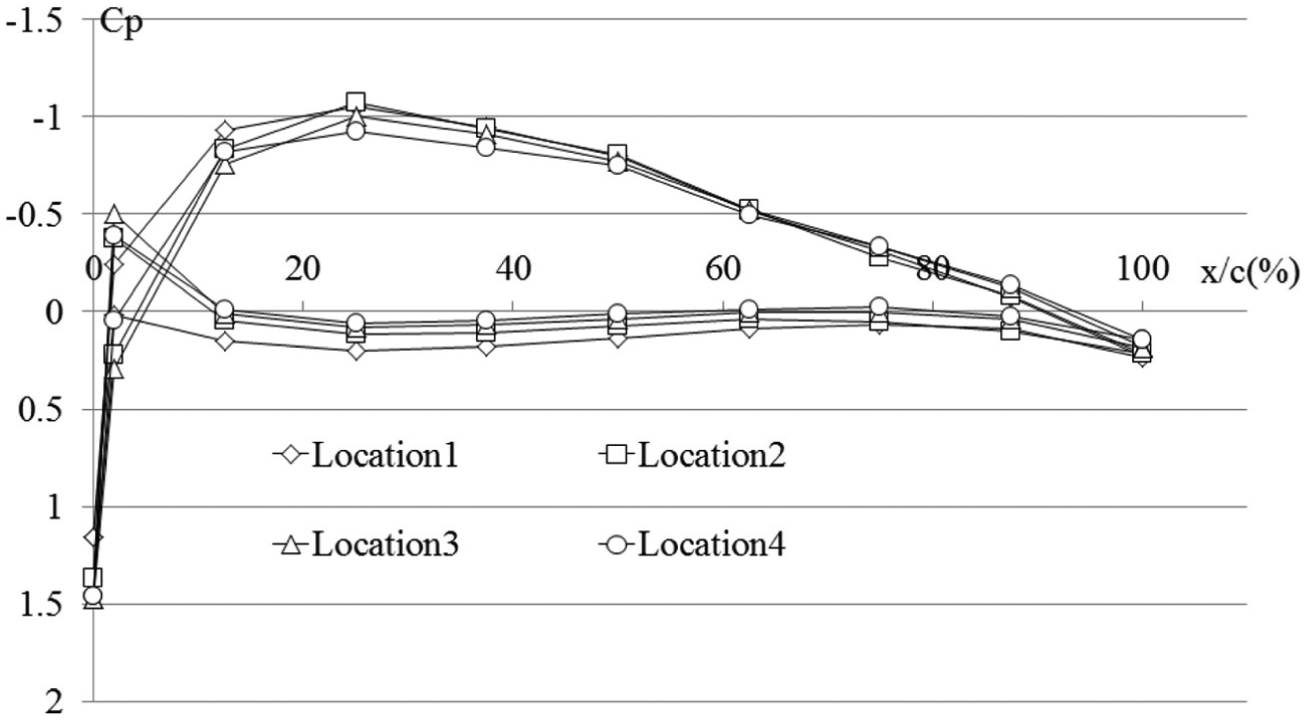
The pressure distribution curves of rear wing at position A*–B.
According to Figures 10–13 and Table 2, at the latter part of the front wings, the pressure on the upper surface of the airfoil with a distance of 440 mm (A*–B) is larger than the pressure of the wing with a distance of 528 mm (A–B*) at the same region, regardless of the changes in planes. This phenomenon may be attributed to that the high pressure at the leading edge of the rear wing is sucked by a negative pressure at the latter part of the front wing. Owing to the distance distinction between the front and rear wings of the two conditions, the levels of supplement of positive pressure to negative pressure are different, that is, a short distance means easy pressure supplement.
ΔCp at latter part of upper surface of front wings.

Figures 12 and 13 indicate that when the plane location is at the middle part of the wingspan, the pressure on the lower surface at the leading edge of airfoil has a drastic decrease to the negative value and then increases to positive (Location 2–Location 4). For the angle of attack of the front wing, when the airflow crosses it, the direction of the airflow will be changed because of the downwash and then the effective angle of attack will decrease. The computational fluid dynamics (CFD) result is shown in Figure 14. From Figure 14, the free flows are divided into two parts. Part 1 flows above the upper surface of front wing, and part 2 flows under the lower surface. But when the airflow flows past front wing, a part of the flow from part 1 flows to the lower surface of rear wing. Thus, the stagnation point of the rear wing will move upward along the surface of rear wing. For the geometry of the leading edge of the wing, the airflow will be accelerated and then the static pressure on the lower surface of rear wing will decrease. There is an adverse pressure gradient existing at lower surface of rear wing, near the leading edge, shown in Figure 15, but, no separation happens. The flow condition in boundary layer is shown in Figure 16. When it comes to Location 1, the static pressure at the leading edge of rear wing does not have such a drastic decrease like other locations.

Streamline of front and rear wings with angle of attack of 5°at position A–B*.

Pressure contours at Location 2 of rear wing at position A–B*.
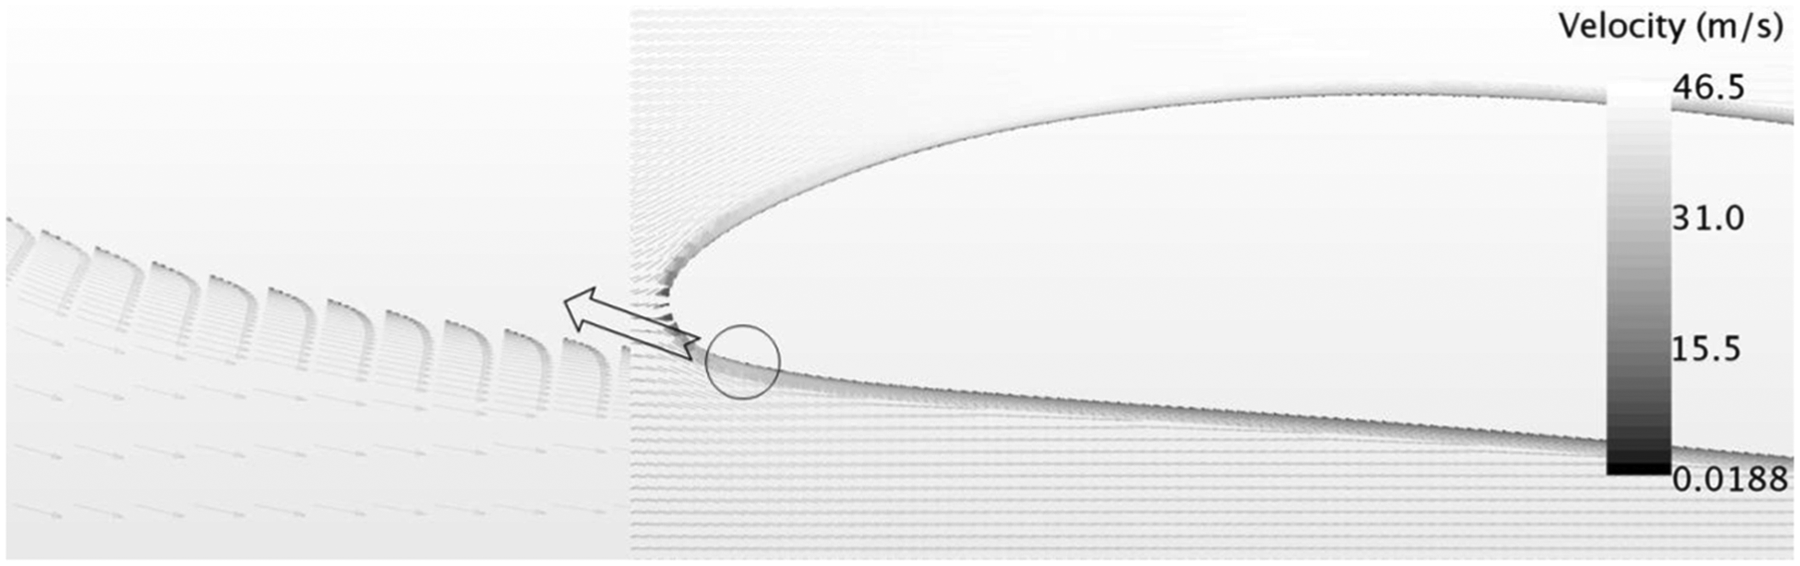
Flow details at leading edge of rear wing at Location 2 position A–B*.
Aerodynamic loads
When the positions and angles of attack change at the same time, 12 conditions exist, that is, every position includes three angle of attack changes, and every angle of attack includes four position changes. At every condition with a velocity of 35 m/s, the corresponding drag force (D), lift force (L), and L/D are measured, as shown in Figure 17.
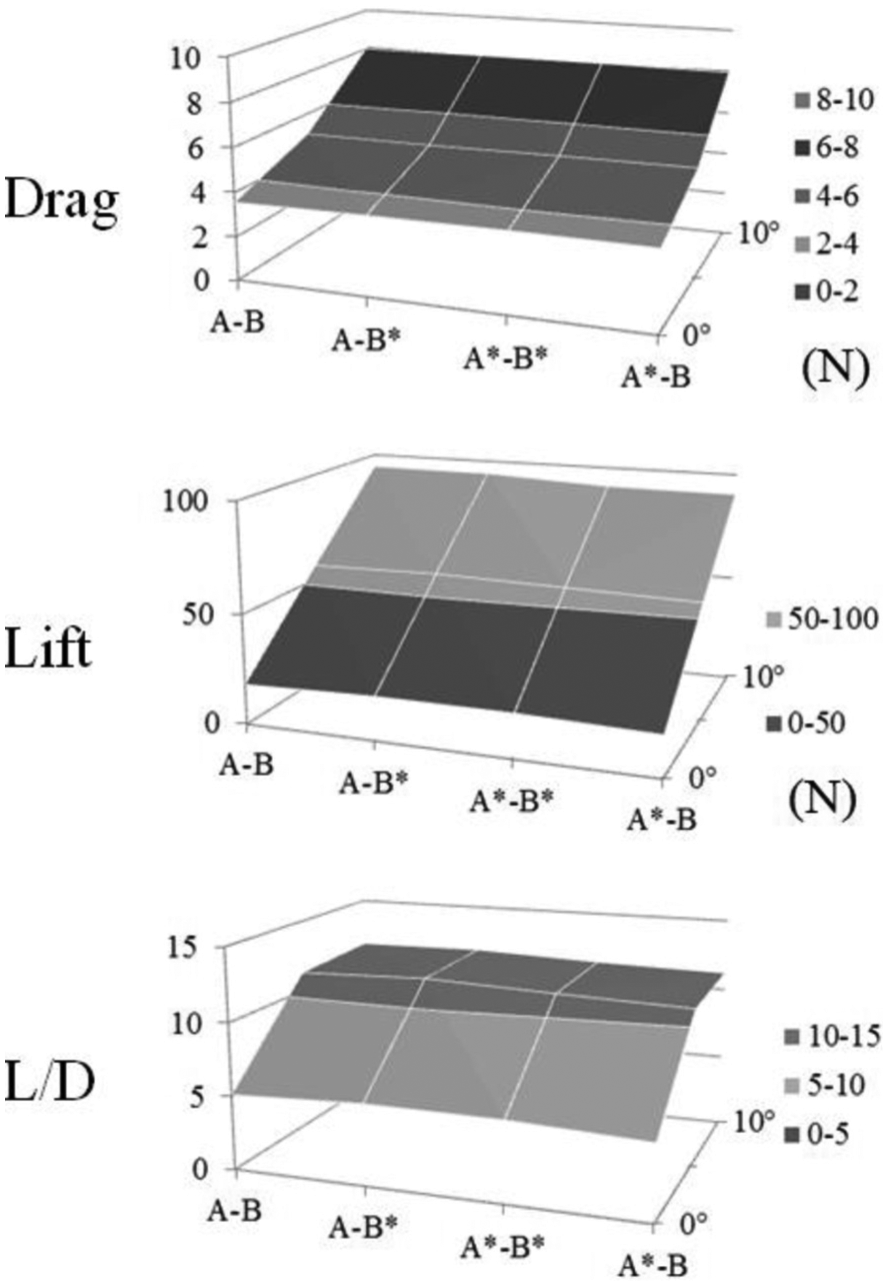
Variations in drag force, lift force, and L/D with the position and angle of attack of wings at 35 m/s.
From the figure, when the angle of attack of airfoils increases, the lift of the model augments. Consequently, the variation in the angles of attack of wings causes the ground clearance of the wings for the restriction of the model mentioned above. Figure 18 shows the variation trend of CD, CL, and L/D following the variation in the angles of attack for different airfoil positions at velocity of 35 m/s.
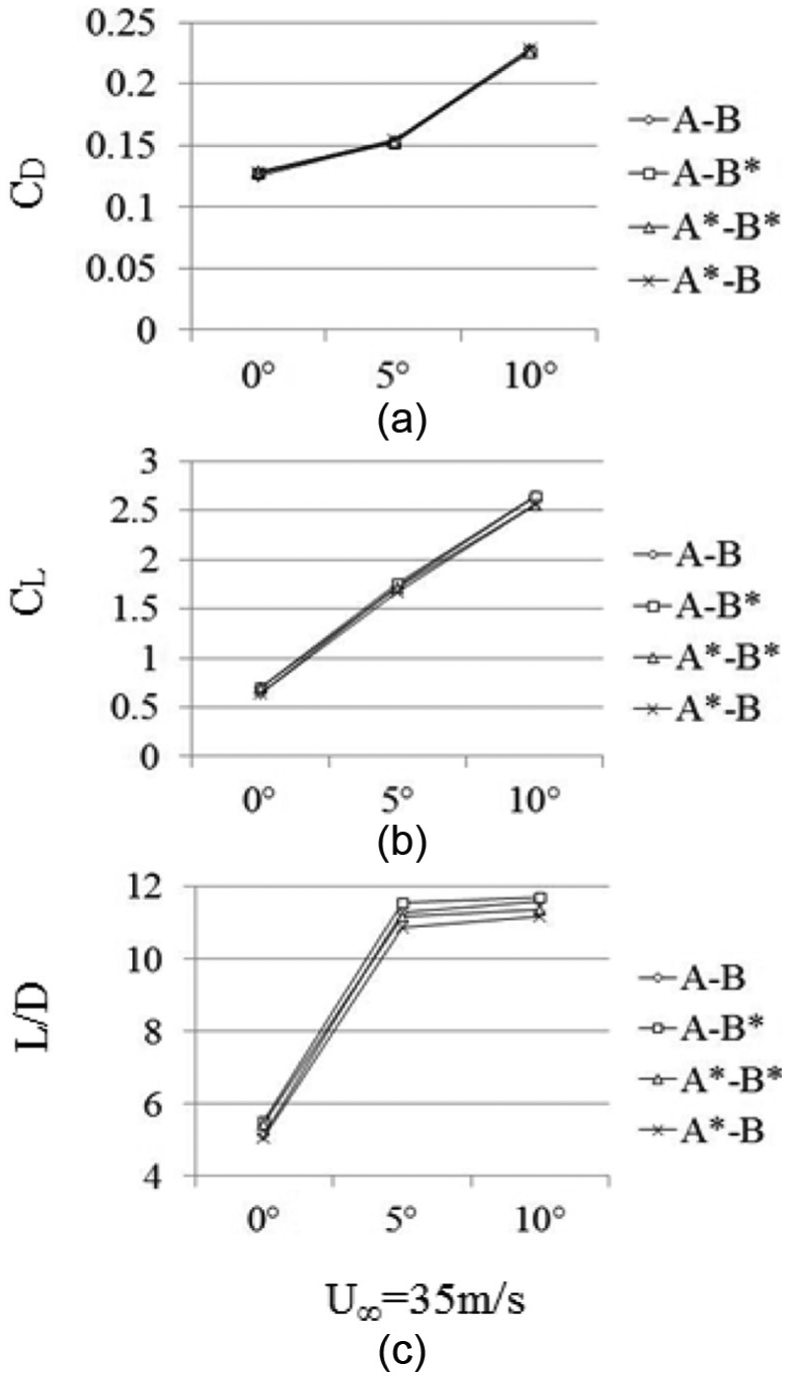
Variations in (a) CD, (b) CL, and (c) L/D with angle of attack at 35 m/s.
From Figure 18(a), two significant phenomena are observed. The first one is that the increment in CD from angles of attack of 5°–10° is larger than the increment of 0°–5°. The reason is that the pressure under the lower surface of the airfoil is higher for a higher angle of attack. Therefore, the model with an angle of attack of 10° exhibits larger pressure differences between the upper and lower surfaces of the wings than that with 5°, and the differences of 5° are greater than the differences of 0°. However, the direction of pressure force is always perpendicular to the object surface; thus, the pressure force is resolved into horizontal and vertical directions. Given the fact that the increment in sine from 5° to 10° is larger than that from 0° to 5°, and the pressure force of 10° is larger than that of 5°, the increment in the horizontal component from 5° to 10° is larger than that from 0° to 5°. At the same time, a larger angle of attack brings larger down-wash angle without separation. When the freestream flows through the airfoils of the model, the flow direction changes because of the angle of attack, and this change of flow direction is positively related to the flow resistance, that is, a significant change in the angle causes large flow resistance.
Another phenomenon is that the curves of the four positions almost overlap. CD is thus controlled by the angle of attack compared with the positions. The influence degrees of angle of attack and positions on CD, CL, and L/D are shown in Figure 19. At the velocity of 35 m/s, CD, CL, and L/D are insignificantly influenced by the location variation. Especially for CD, the influence degree of angle of attack on drag force is more than 99% at certain velocity; hence, the influence level of position can be neglected. By contrast, CL curves present different conditions.
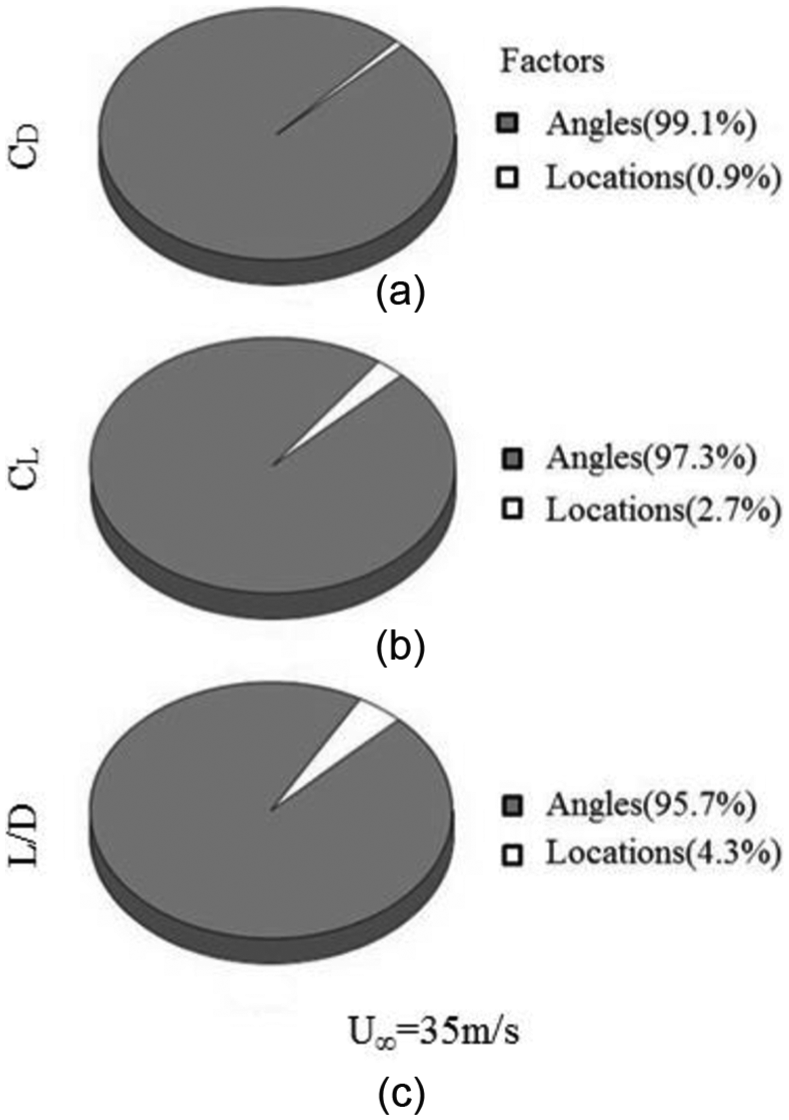
Results of the variance analysis at 35 m/s: (a) CD, (b) CL, and (c) L/D.
From Figure 18(b), different positions have different values of lift force. Regardless of the changes in angle of attack, position A–B* always has the highest CL and the highest lift force, that is, the longest distance between the front and rear wings has the highest lift force. This phenomenon is related to the turbidity of incoming flow. When the freestream flows across the front wings, the flowing condition is modified and the turbidity changes. In fact, the values of turbidity and turbulence energy will be enlarged. However, owing to the dissipation of turbulence energy, the turbidity of the incoming flow of rear wing is influenced by the distance between the front and rear wings, that is, a long distance leads to low turbidity. Taking A–B* and A*–B for example (the longest distance and the shortest distance between the front and rear wings, respectively), the turbulence energy of airflow after crossing the front wings has more time to be dissipated in position A–B* than in position A*–B. Hence, A–B* has the highest lift force, whereas A*–B has the lowest lift force. Although the drag force is also affected by the turbidity of incoming flow, the level of influence is lower than that on lift force. 15 As the experimental data show, a small spacing between wings has high drag force, but the influence is slighter than the influence caused by the variation in angle of attack. Accordingly, the four CD curves almost overlap, and the influence degree of different positions on CL is higher than that on CD, as shown in Figure 19(b).
Oil visualization
The flow conditions of airflow near the upper surfaces of airfoils are presented in Figures 20–23. The two oil visualization experiments include a certain velocity of 35 m/s (from left to right) and an angle of attack of 5°, but different positions of front and rear wings.

Front wing with a distance of 528 mm.

Rear wing with a distance of 528 mm.

Front wing with a distance of 440 mm.

Rear wing with a distance of 440 mm.
Whether in position A–B* or A*–B, regions exist near the end plate of every airfoil, marked by dash lines. The airflow presents different flowing directions in contrast to the incoming flow, that is, an included angle exists between the velocity vector of incoming flow and the velocity vector of the airflow in the regions. The airflow velocity in the regions is resolved into two directions, namely, along the velocity of incoming flow and perpendicular to incoming flow. The direction of vertical velocity changes along the airfoil chord. The vector initially points to the train body, but the airflow moves away from the train body at the latter part of airfoil.
The aforementioned phenomenon may be ascribed to the following reasons. The height of the end plate will change along the airfoil chord, that is, the plate height is lower at the fore part of the airfoil than that at the latter part. Meanwhile, the pressure near the fore part of the upper surface of wings is lower than the pressure outside and near the lower surface. Thus, the additional airflows will be sucked from the outside region and roll up from the surface of the wings. Nonetheless, given that the end plate exists, the additional airflows cannot be allowed to escape out of the wing edge along the wingspan without difficulty. The pressure of the region at the fore part of an airfoil and near the end plate will increase, which means a higher pressure zone will form. Higher pressure brings a trend of relative movement. A vertical velocity vector is thus generated and indicated in the train body. However, at the latter part of an airfoil, the increasing height of end plate creates a tougher condition for the additional airflows flowing from the outside region or rolling up from the lower surface to the upper surface of wings, and the flux of the additional flows will decrease. At the same time, when the airflow approaches the latter part of an airfoil, the pressure near the upper surface will be augmented compared with that at the fore part of the airfoil. The pressure near the end plate will be consumed for the development of the wingtip vortex. The pressure difference between the region near the plate and the other region at the latter part of a wing will decrease, even to a negative difference. Hence, the trend of airflows flowing toward the train body will be weakened and then changed to another trend of flowing away from the train body.
Conclusion
Numerous wind tunnel experiments were conducted with three angles of attack (0°, 5°, and 10°) and four positions of airfoils at the velocity of 35 m/s. The aerodynamic performances with different angles of attack and airfoil positions were evaluated. At two representative positions, one group of pressure distribution curves of front and rear wings was investigated, and oil visualization was used to determine the airflow conditions on the upper surfaces of the wings.
From the surface plots of the aerotrain model’s aerodynamic performance, the relative positions of wings revealed an insignificant influence on the aerodynamic force of the model in contrast to the angle of attack. A long distance between the front and rear wings generated a high lift force. The pressure distribution curves of wings indicated that the existence of the rear wing will increase the pressure at the latter part of the upper surface of the front wing, and the end plate and train body will alter the condition of wing surface flows and weaken the flow separation on the lower surface of the rear wing.
Footnotes
Appendix 1
Academic Editor: Hongwei Wu
Declaration of conflicting interests
The author(s) declared no potential conflicts of interest with respect to the research, authorship, and/or publication of this article.
Funding
The author(s) disclosed receipt of the following financial support for the research, authorship, and/or publication of this article: This work was supported by National Natural Science Foundation of China (51305477), supported by Key Technology Innovation Projects of Key Industries in Chongqing (CSTC2015ZDCY-ZTZX60011), and part of the work was carried out under the Collaborative Research Project of the Institute of Fluid Science, Tohoku University, Japan.