
Abstract
Quality prediction of complex production process has increasingly attracted the interests of manufacturers and researchers. Complex production process has the characteristics of sub-process mutual coupling, data show nonlinear, multi-inputs and multi-outputs, and it is difficult to realize process quality prediction effectively. To solve this problem, a multi-model modeling approach based on fuzzy C-means clustering and support vector regression is proposed in this article. First, classify the operation conditions using fuzzy C-means clustering algorithm, then establish the local quality prediction models of multiple operation conditions using support vector regression, obtain multi-model with model weights using adaptive mutation particle swarm optimization, and implement the quality prediction of complex production process. This method solves the problems of nonlinear, wide operating condition range and prediction difficult. A case study of the Tennessee Eastman process shows that the proposed model is feasible and efficient.
Keywords
Introduction
With growing requirements of high product quality in modern complex production process, quality prediction has become increasingly important. Data-driven empirical prediction models, such as statistical regression and time series analysis, are established by the changing rule between quality independent variable and dependent variable. But with the growing complexity of the production process, the quality data are difficult to describe the changes of quality characteristics using the precise mathematical model. As the development of artificial intelligence techniques in these years, new intelligent forecasting methods, such as artificial neural network, fuzzy estimation, and support vector machine (SVM), have widely used in process prediction.1–5
Complex production process, which has the characteristics of highly complex, uncertainty, multi-level, and network, is difficult to achieve quality prediction effectively by a single intelligent control method. The multi-model strategy provides an effective way to solve quality prediction of the complex production process. Multi-model modeling algorithm, which is established by certain rules for a complex system, has higher accuracy compared with a single model. Since Bates and Granger 6 put forward to use the synthesis of multi-model to simulate the complex production process, the research of multi-model prediction method has been considerably developed in the last several years, including adaptive methods, Gaussian mixture, multi-model methods, and so on.7–10
Multiple model methods can solve the problem related to the quick change in operating mode. Maestri et al. 11 proposed a robust cluster approach, assuming that all data of each operating mode have the same covariance matrix. However, it reduces the application ability in practical situations. Yong et al. 12 proposed a multiple model recursive monitoring method. A computational intelligence-based cluster algorithm is employed to separate different operating modes. Then, recursive kernel principal component analysis is used to reduce the dimension, and support vector data description is utilized to build models. Finally, the corresponding statistics are constructed to detect the process fault. Su et al. 13 adopted a robust adaptive evidence theoretic k-NN classification method to establish the local model and applied to define the membership of current pattern belonging to each local model, and multi-model prediction method mainly uses weighted sum of the multiple local models. Sun and Yuan 14 used the weighted method to obtain the weighted values of local models and then developed the global model to predict the quality of complex process. These efforts form the foundation of the work herein, predicting approaches for complex production processes are still underway. These methods can deal well with the nonlinear data. However, it cannot easily obtain the model for complex production processes when you cannot obtain enough data.
This article aims to develop a multi-model method for quality prediction of complex production process. The model consists of three main modules: classifier module, local prediction model module, and weight value optimization module. In classifier module, we classify the operation conditions using the fuzzy C-means (FCM) clustering algorithm and generate multiple sub-group datasets, which represent different operation conditions. Within local prediction model module, instead of constructing a global prediction model, a series of local quality prediction models are established using support vector regression (SVR). In weight value optimization module, adaptive mutation particle swarm optimization (AMPSO) is developed to obtain the local models’ weights for combining the forecast results in different operation conditions, so that it formulates the global quality prediction model. Compared to traditional prediction methods, this method not only reduces the computational complexity of the production process but also improves the prediction performance.
This article is organized as follows: section “Quality prediction multi-model approach” describes the concepts needed, including the FCM clustering method, the principle of SVR, and AMPSO algorithm. Section “Multi-modeling algorithm for prediction control” introduces the quality prediction multi-model. Section “Application experiment” describes the simulation experiment design of the Tennessee Eastman (TE) benchmark case study, including the overview of TE process, experimental results, and analysis. Finally, in section “Conclusion,” conclusions and some discussions of this article are made.
Quality prediction multi-model approach
Multi-model approach is to establish multiple models of complex production process by different work conditions. From this, higher prediction precision can be obtained compared with single model. In this article, clustering algorithm provides a sample classification rule, and it can create an object model rationally. Multi-model modeling algorithm uses the FCM clustering method to classify training data, obtain the training samples of each sub-category, and then use multi-SVR algorithm for establishing various sub-class model.
FCM clustering algorithm
Fuzzy clustering based on fuzzy theory is a classifier method that divides the data into groups by their characteristics and degree of uncertainty. FCM clustering method is the most widely used algorithm based on the objective function of fuzzy clustering algorithm. This method forms a common clustering criterion, its principle is to optimize the objective function using an iterative method and then obtain the classification result of datasets. The algorithm, which has good convergence and automatic detection identification, is widely used in pattern recognition, image recognition, and general classification by solving the problem of multiple branches of the split.15–17 In this article, FCM clustering method is adopted to divide the conditions of complex production process.
Note that hypothetically, the process data are a collection of n samples

Assume that there are s clustering centers constituting a cluster center matrix
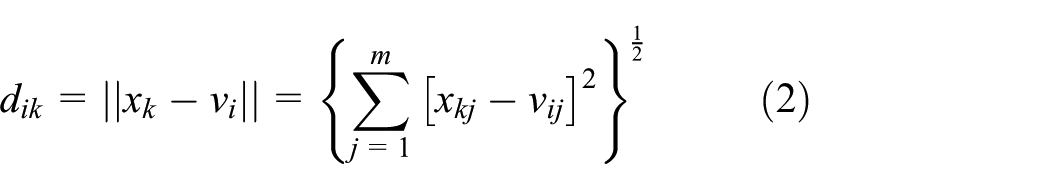
FCM objective function is

where

So, the parameters of FCM clustering method mainly contain number of clusters, exponent for the partition matrix, maximum number of iterations, minimum amount of improvement, and info display during iteration. We can set suitable parameters for your model. The clustering result in FCM clustering method is used to divide the complex production process. The local models can be established in different operation conditions.
SVR
SVR is formed from SVM. SVM is invented by Vapnik of AT&T Bell lab team. It is established to obtain the best solution between model complexities and learning ability according to the limited sample information, which is based on Vapnik–Chervonenkis (VC) dimension theory and structural risk minimization of statistical learning theory. An SVM performs classification tasks by constructing optimal separating hyperplanes (OSHs). An OSH maximizes the margin between the two nearest data points belonging to two separate classes.
Suppose that the training set (xi, yi),

In equation (5), C is the penalty factor, and it determines the degree of the penalty assigned to an error. It can be viewed as a tuning parameter, which can be used to control the trade-off between maximizing the margin and the classification error.
SVM was originally designed for the classification problem; however, many studies show that this algorithm also has a better performance in regression problems. The basic principle of SVR is to deduce the output value y corresponding to the new input sample x, which is based on the model of the training set samples. In this article, local models are established using the SVR.18–20 It is assumed that training set

The first part of the objective function is to make the function more flat and improve the generalization ability; the second part is to reduce the error, and penalty parameter C plays a compromise role.
Nonlinear regression problem can be transformed to the linear regression by choosing a suitable kernel function K(xi, xj). The optimization problem is defined as

SVR model uses kernel function to solve nonlinear problem and makes the input vectors map to the high-dimensional feature space to transform the nonlinear to linear. The critical problem is to choose the kernel function K(xi, xj). There are several types of kernel function:
Linear function mainly used for a linear separable case is not suitable for a nonlinear case, and the form is as follows

Poly function

Radial basis function (RBF)

Sigmoid function

Although several choices for the kernel function are available, linear function mainly used for a linear separable case is not suitable for a nonlinear case. However, the other three functions can be used to deal with nonlinear case, and RBF kernel function has greatly generalized ability, and many literatures have indicated that RBF is more stable. So, RBF function is adopted in establishing the SVR models.
AMPSO
Particle swarm optimization (PSO) originates from the study of birds’ predatory behavior; originally, it was proposed by Kennedy and Eberhart 21 in 1995. PSO algorithms use the flying behavior of a swarm of particles to imitate the process of searching for the optimal solutions. Each particle represents a feasible solution called particles associated with the position and velocity vector. At each iteration, the particle moves toward an optimum solution through its present velocity, and their individual best solution is obtained, and the global best solution is obtained among all particles.
In PSO, each individual is considered as a volume-less particle, and the set of position of n particles in the m-dimensional search space is identified as

where c1 and c2 are the positives constants and r1 and r2 are two random functions in the range [0, 1].
Then calculate each component of
for

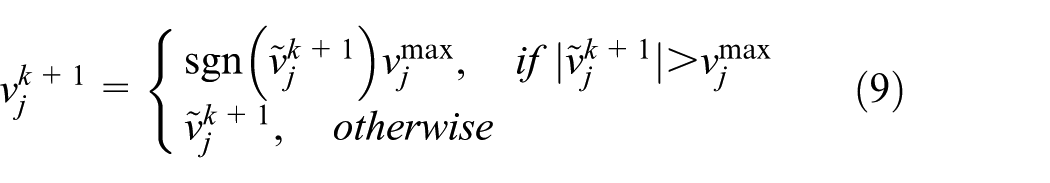
PSO has the characteristics of simple concept, less control parameters, evolutionary computation, and swarm intelligence optimization; it can realize the search for the global optimal solution in complex space through collaboration and competition between individuals. But basic PSO is easy to relapse into a local extremum, and other particles quickly move to this local position in the optimization process, and it is difficult to find the best global solution. To cope with the PSO’s “premature” problem, AMPSO is used to solve this problem. The AMPSO facilitates particles to escape from the local optima to find the best solution in the other space.
As can be seen in formula (10), the next position of a particle is determined by both its current position and its new velocity. The new velocity is determined by the immediately previous velocity, individually best Pi, and group best Pg, as shown in formula (8). If the algorithm is in premature, then the group best Pg is the local optimal solution. If Pg is changed, the search direction of particles will be redirected. Thus, the main idea of the AMPSO is by mutating Pg in hope that the search will get out of a local optimum to explore new individual optimum and group optimum.
The mutation of the PSO is designed as a random operator with a certain probability

Multi-modeling algorithm for prediction control
Algorithm principle
The structure diagram of multi-model prediction algorithm is shown in Figure 1.

Multi-model structure.
FCM clustering algorithm is used to classify the different operation conditions of complex production process based on the minimum Euclidean distance. Nonlinear SVR based on RBF as the kernel function (SVR-RBF) is used to establish the local quality prediction model, respectively. Finally, AMPSO is adopted to obtain the weighted values of local models and then develop the global model to predict the quality of complex process.
Multi-model with weighted strategy, which consists of the local models, adopts linear or nonlinear weighted way to obtain the complex process global approximate model. It tries to make the prediction results coincide with the actual process, so that it improves the prediction accuracy of process quality. In this article, weighted strategy is used to realize the local models to the global model. The form can be described as follows

where wi (i = 1, …, s) is the weight values of local models, which satisfy the condition: w1+w2+···+ws = 1. wi ≥ 0, i = 1, …, s. xi(t) (i = 1, …, s) means the ith local model result, and t means the time series parameters.
Each particle is constituted by s dimension parameters in the multi-model problem with s weighting factor, solving the optimal weight using the particle position, the particle speed, and the fitness function. The problem of weighted multi-model is to find an optimal set of weighting coefficients wi (i = 1, …, s) and make the error between the multi-model output and actual output to minimum; the fitness function can be described using the mean squared error (MSE)

where
Algorithm steps
The flowchart of the multi-model algorithm is shown in Figure 2, and the detail specific implement steps are as follows:
Step 1. Obtain the data of complex production process;
Step 2. Define the process input data and output data, normalize the data, and choose the sample training set S and testing set T;
Step 3. Initialize the system parameters, FCM parameters, SVR parameters, and AMPSO parameters;
Step 4. Divide the training set S into s conditions using FCM clustering and obtain the working section of local models;
Step 5. Establish the local models using SVR and search for a suitable SVR parameter by grid search and cross-validation;
Step 6. Obtain the weight values of local models through AMPSO. The MSE is used as the fitness function;
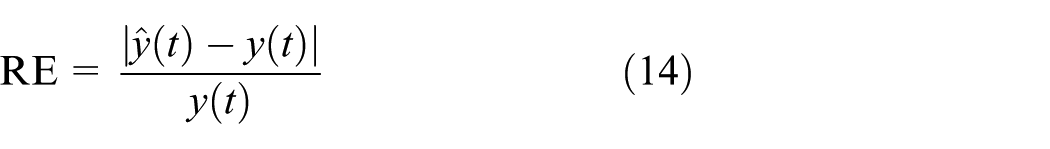
Step 7. Obtain the multi-model by the weight values. Then use testing set T to check the model accuracy and calculate the relative error (RE) and MSE of the testing sample

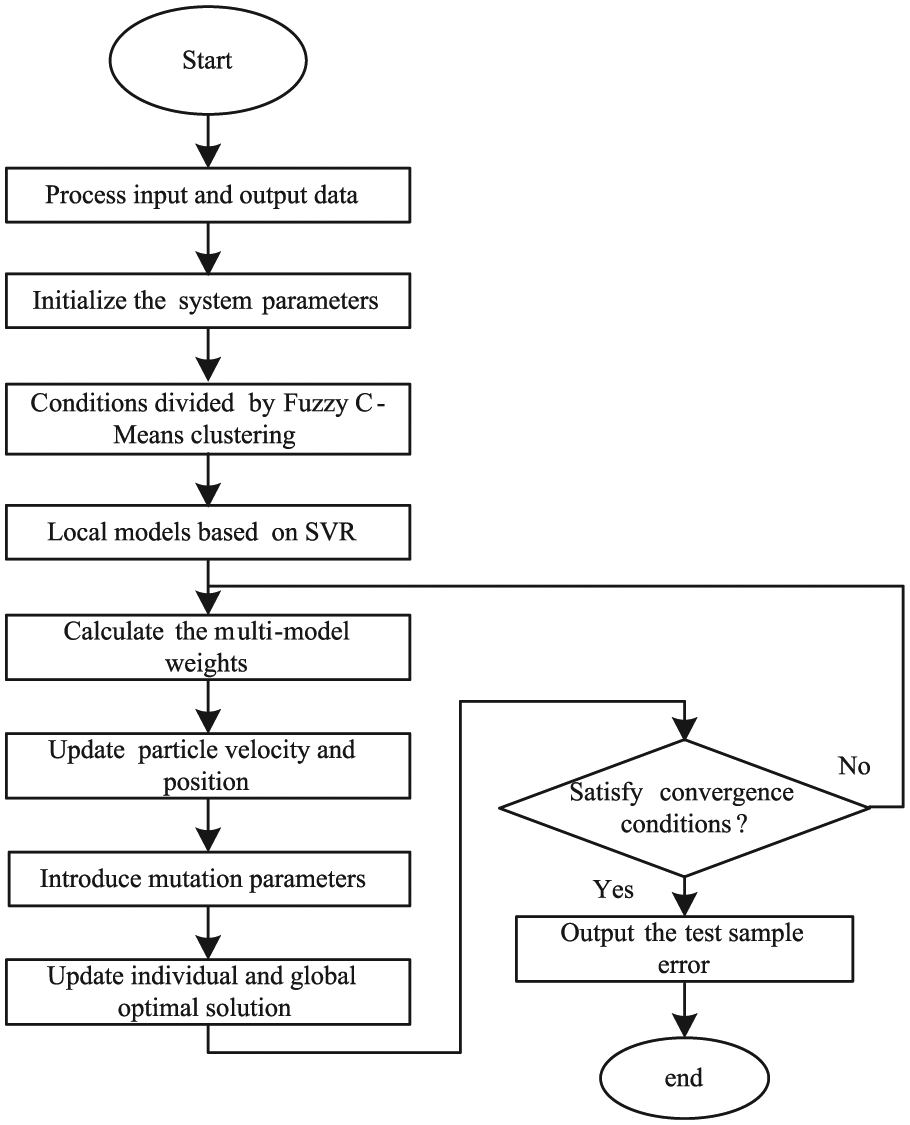
The flowchart of multi-model.
Application experiment
In this section, a case of TE chemical process is presented to analyze the performance of the proposed multi-model prediction method. First, classify the operation conditions using FCM clustering algorithm, next establish the local quality prediction models of multiple operation conditions using SVR, then obtain local model weights using AMPSO, and implement the quality prediction of complex production process by combination of the local models. Finally, the results of the best method are compared with local model, back propagation (BP) neural networks, and SVR prediction method. All methods are coded in MATLAB (2009a) and used the LIBSVM toolbox from Chang and Lin. 22
TE chemical process
TE chemical process is proposed by J.J. Downs and E.F. Vogel, which is the process control case based on the Eastman practical industrial process, as shown in Figure 3. The TE process is a complex system with multi-inputs, multi-outputs, and multiple coupling relations between variables. McAvoy and Ye 23 have obtained a certain control effect of TE process using cascade control method and two final products of the composition of the G/H as process control targets, but the control method is unstable. The simulation in this article is based on the TE process in fault 1 mode corresponds to the 50/50 G/H product ratio, a shift fault, which means A/C feed ratio change, B composition constant.

Tennessee Eastman process.
TE process is a complex nonlinear process, and there are five major unit operations in the process: a reactor, a condenser, a recycle compressor, a separator, and a stripper. It contains eight components: A, B, C, D, E, F, G, and H. The four reactants A, C, D, and E and the inert B are fed to the reactor where the products G and H are formed, and a byproduct F is also produced. The process has 22 continuous process measurements, 12 manipulated variables, and 19 composition measurements sampled less frequently. Details on the process description are well explained in Chiang et al. 24
Parameters selected
In this article, 22 continuous process measurements and 8 A, B, C, D, E, F, G, and H purge gas are chosen as the prediction model inputs, final products G and H as model outputs, 25 and A feed and A+C feed as control variables to classify the operation condition; the data of the fault 1 mode in the TE simulation model are used in process quality prediction. Table 1 shows the 22 continuous process measurements, and Table 2 shows the 8 discrete variables.
Continuous process measurements of the TE process for multi-model.

TE: Tennessee Eastman.
Discrete quality variables of the TE process for multi-model.

TE: Tennessee Eastman.
The dataset contains 160 data samples, which run 48 h, and the sampling interval is 18 min in the fault 1 mode of the TE process. The proportions of A feed and A+C feed are the inputs in the clustering algorithm, which are the main factors of the failure mode 1. The proposed multi-model quality prediction method adopts 160 test samples data of 4 classes in fault 1 model, the final products G and H as prediction objects, and 30 process variations as input parameters.
In FCM clustering method, we set the number of clusters to be 4, exponent for the partition matrix is 2.0, maximum number of iterations is 100, and minimum amount of improvement is 1e−5. LIBSVM toolbox is used to establish the local SVR models. We choose epsilon-SVR as type of SVM, 0.4 as the epsilon in loss function of epsilon-SVR, RBF as the type of kernel function, 10,000 as the parameter C, 0.002 as gamma in kernel function, and the others parameters are as defaults. In PSO, maximum number of iterations is 500, swarm size is 200, maximum velocity is 0.8, constants c1 = c2 are both 2, and probability of adaptive mutation rate is 50%.
Experiment results
Performance of FCM clustering algorithm
The computational results of the proposed FCM clustering algorithm are shown in Figure 4 and Table 3. Specifically, Table 3 provides the four centers of FCM in A feed and A+C feed and the number of every clustering. FCM clustering method effectively distinguishes various operating conditions of the TE process fault 1 mode, and the process is divided into four operation conditions.
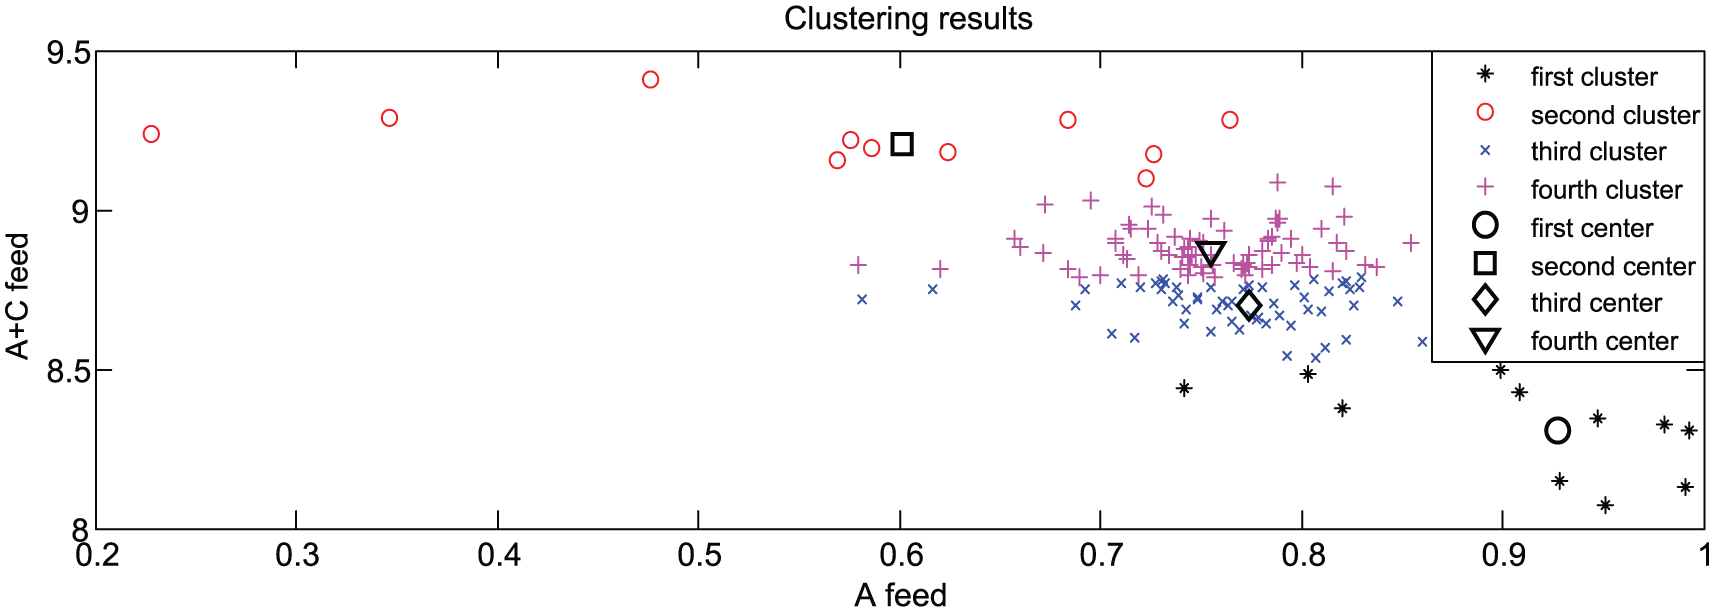
The result of fuzzy C-means clustering algorithm.
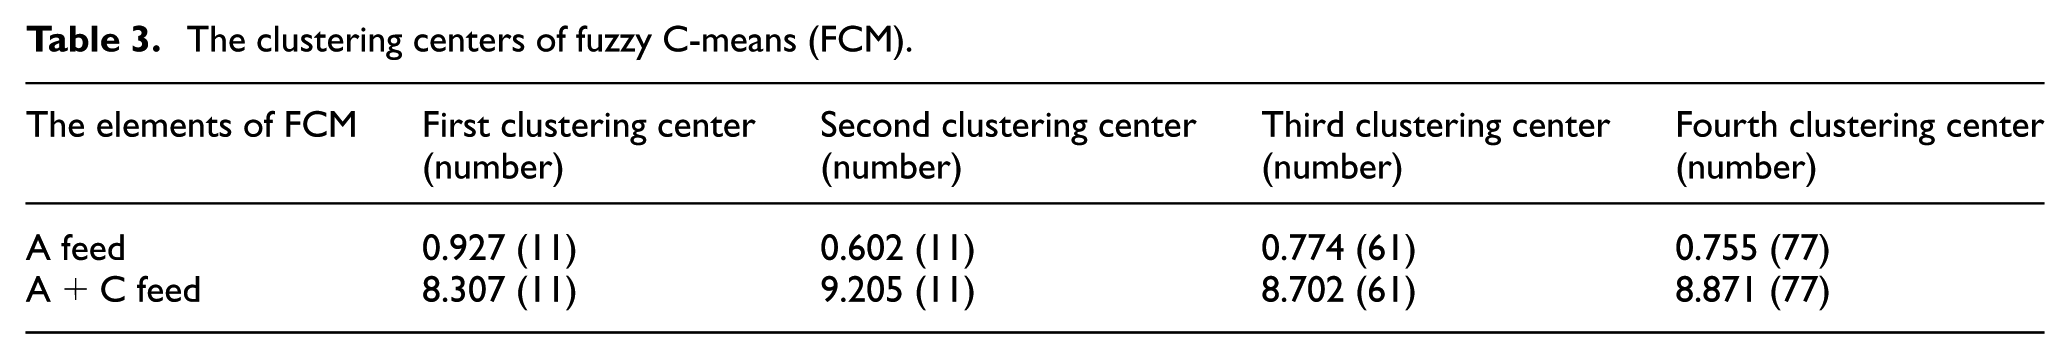
The clustering centers of fuzzy C-means (FCM).
A small number of edge samples are distinguished, such as the first class and second class which only have 11 points, respectively. But the main operating conditions, such as the third class and fourth class, are mainly adopted to predict the quality of a complex model.
Performance of predicting the quality in different models
First, we evaluate the performance of the proposed multi-model quality prediction with different optimization methods to choose the local SVR weight parameters. In the experiments, we apply the four clustering results as the local model data, and the SVR is implemented as the prediction method. The performances of the best SVR parameters with different optimization algorithms are compared in Table 4. The best multi-model weight parameter values are then used in maximizing the prediction accuracies.
The simulation results of G ratio.

BP: back propagation; SVR: support vector regression; MSE: mean squared error; RE: relative error.
In order to investigate the effectiveness of the proposed multi-model method, we have used three other methods: the first one (local model) that simply uses four local model by the data training after FCM algorithm; the second (BP) that chooses BP neural networks algorithm as the prediction method, and the third (SVR) that chooses SVR algorithm as the prediction method using original data. The results of the RE and MSE are shown in Tables 4 and 5. Figure 5 shows the prediction results of composition G and composition H.
The simulation results of H ratio.

BP: back propagation; SVR: support vector regression; MSE: mean squared error; RE: relative error.

Prediction results of the proposed method: (a) composition G and (b) composition H.
Simulation outputs and the actual G and H ratio of TE process using the proposed method are in good match; the RE of composition G and H is controlled in <1%, and MSE also shows a low ratio value. Compared with the other methods, the RE and MSE have been greatly improved, and they are better in the prediction of the entire system. This method can analyze the trend of the complex production process, although it cannot predict the accurate data value. It helps people understand the quality of products and adopt effective approaches to adjust the production process in unsuitable production states, guaranteeing the quality of production.
In total, four local models use SVR method to predict the complex production process using the classified data of the FCM clustering as the training set. From Figure 6 and Tables 4 and 5, the results show that first class and second class of G and H output ratio display much worse than the local model of the third class and the fourth class, but it shows good match with the result of FCM clustering. But the results of first class of G play better than fourth class because AMPSO method is not stable and thus influences the local model results, but it does not affect the superiority of this method. And the results of third class and fourth class play much better because they are the main operating conditions, and the prediction results are much closer to the global model.
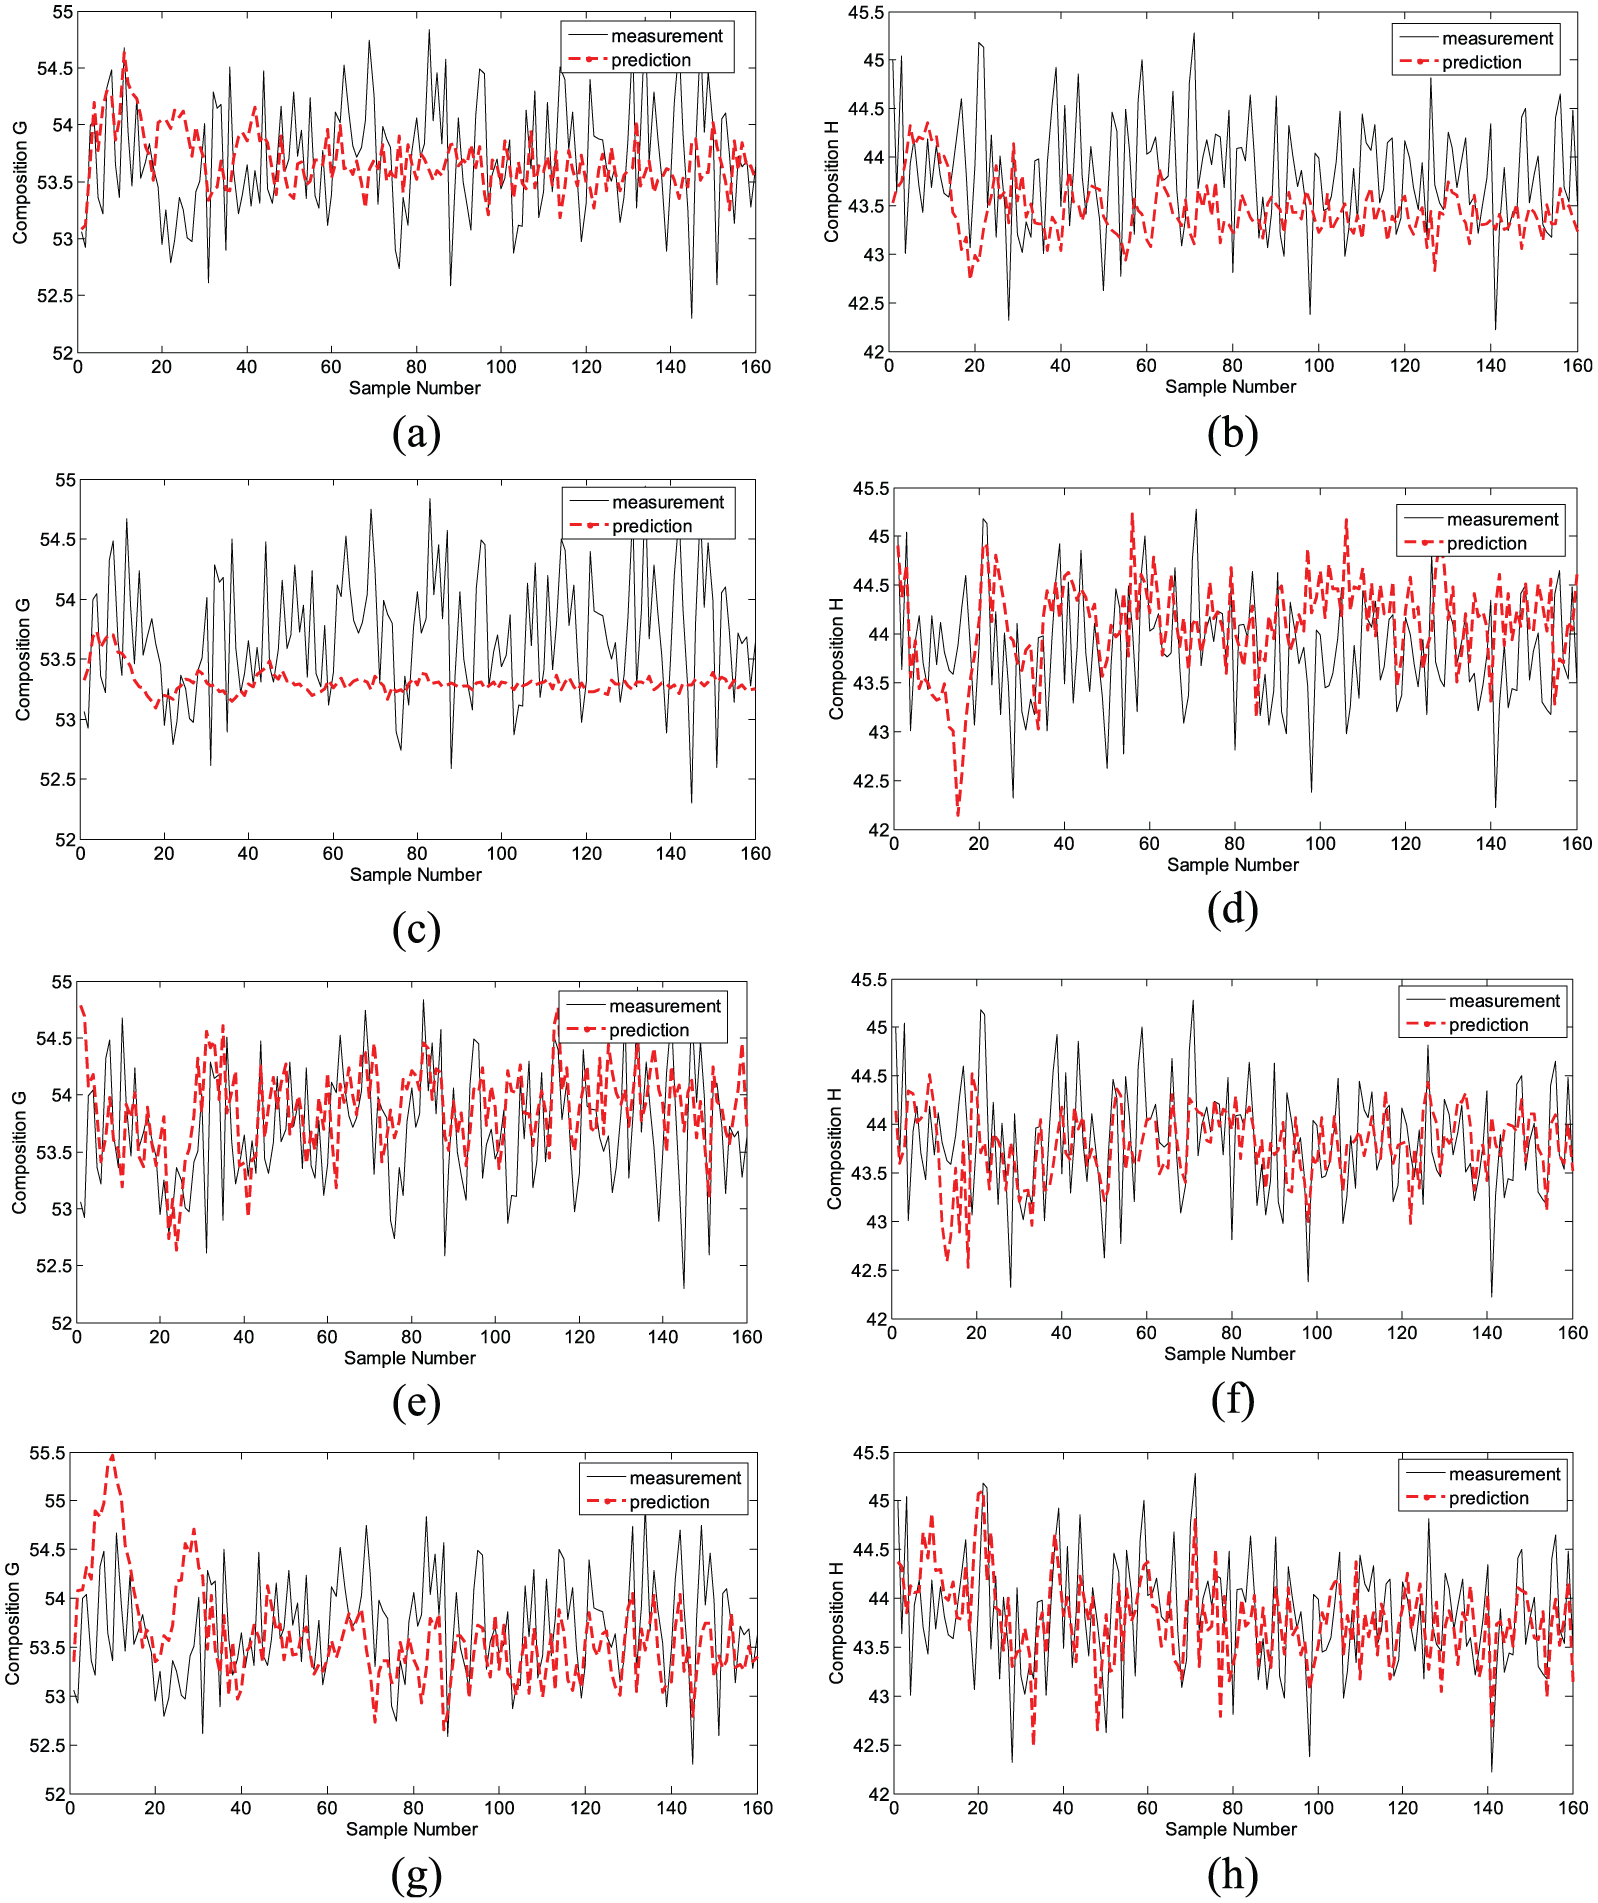
Prediction results of four local models: (a) composition G of the first local model, (b) composition H of the first local model, (c) composition G of the second local model, (d) composition H of the second local model, (e) composition G of the third local model, (f) composition H of the third local model, (g) composition G of the fourth local model, and (h) composition H of the fourth local model.
BP neural network algorithm and SVR algorithm are used to do the comparative study. From Tables 4 and 5, the results show that the prediction accuracy of multi-model is much better than these two methods. At the same time, the RE and MSE of SVR are better than BP neural network, especially the G output ratio, the reason is that BP neural network depends on the quantity and quality of the sample data, but as only 40 training samples are considered in this study, it belongs to the small sample noise problem. Figures 7 and 8, respectively, show the prediction result of BP and SVM.

Prediction results of BP method: (a) composition G and (b) composition H.

Prediction results of SVR method: (a) composition G and (b) composition H.
Performance of AMPSO algorithm
To study the influence of AMPSO algorithm, we test the proposed multi-model-based quality prediction system. AMPSO is used to solve the weight values of the multi-model. Each particle is constituted by four dimension local model parameters, and 0.5 is chosen as random operator in the multi-model problem. The MSE between the multi-model output and actual output is used as the fitness function. Optimization process of composition G and composition H with five different runs of the program with 500 steps is, respectively, shown in Figure 9. They demonstrate that AMPSO can find the best optimum values effectively.

The best fitness evaluation for different runs: (a) composition G and (b) composition H.
Conclusion
Complex production process has the characteristics of sub-process mutual coupling; data show nonlinear, multi-inputs and multi-outputs, and a multi-model is proposed to implement quality prediction of complex production process. First, FCM clustering algorithm is used to deal with complex data, make the complex process divide into relatively simple conditions, and provide effective database for the realization of the complex process quality prediction. Based on the operation condition division, we establish the local quality prediction models using SVR and then obtain the global model by local model weights. AMPSO, which introduces mutation parameters to improve PSO, is used to obtain the best local model weights.
The results of the case study of the TE process as the complex production process demonstrate that multi-model is an exceptionally promising approach to solve quality problems in the complex production process. The prediction results of fault mode 1 in TE process show that the MSE is 0.2359 and 0.2616, and the RE is controlled in <1%, which demonstrate that the proposed method shows good performance. Besides, local model, BP, and SVR model as the comparative studies are used to predict the quality of TE process. The results show that the proposed method is feasible and efficient and evidently improves the prediction accuracy.
Linear weighted strategy is used to realize the local models to the global model in this article, not considering nonlinear weighted strategy. Future research will study the suitable weighted strategy according to the actual production process.
Footnotes
Academic Editor: Murat Uzam
Declaration of conflicting interests
The author(s) declared no potential conflicts of interest with respect to the research, authorship, and/or publication of this article.
Funding
The author(s) disclosed receipt of the following financial support for the research, authorship, and/or publication of this article: This work is financially supported by National Natural Science Foundation of China (NSFC) under Grant No. 51675450 and the Fundamental Research Funds for the Central Universities under Grant No. 2682016CX031.