
Abstract
The auto-body is usually composed of compliant sheet metals. The assembly variation is inevitable in the process of auto-body assembly. A reasonable tolerance allocation method for compliant sheet metal body parts is an important means to control assembly variation and improve the quality of automotive assembly. In this article, on the basis of tolerance–deviation model and tolerance–cost model, a multi-objective optimization model for tolerance allocation of auto-body is established. Part tolerance and manufacturing cost are regarded as design variables in the model. Then, orthogonal design and cumulative sorting strategy are proposed to modify the non-dominated sorting genetic algorithm II. Finally, the process of tolerance allocation is demonstrated through an example of the rear lamp bracket assembly. The results show that the improved non-dominated sorting genetic algorithm II algorithm has obvious optimization effect.
Keywords
Introduction
Auto-body is one of the four major components of an automobile. The quality of auto-body has an important impact on vehicle performance and appearance. However, there is a conflict between quality requirements and manufacturing costs. The variation level of the compliant sheet metal body parts is the key factor affecting the conflict. Therefore, it is of great significance to find a reasonable tolerance allocation method to solve the contradiction between quality and cost.
Tolerance allocation is the process of assigning the known assembly tolerance to the part tolerance according to certain criteria. The traditional method of tolerance allocation is to fit out the relation curve between tolerance and cost by a set of empirical tolerance–cost data, and then get the tolerance–cost numerical model. Typical models are exponential model, 1 reciprocal model 2 and polynomial model, 3 and so on. All these models are based on the lowest cost for tolerance allocation. It is very hard to balance the quality and cost.
In recent years, many studies on multi-objective tolerance allocation have been done. These studies mainly focused on two aspects: the establishment of tolerance allocation model and the selection of optimization algorithm.
Heish 4 put forward a flexible cost–tolerance optimization model by considering the manufacturing cost of the components, the process capability of the manufacturing operations, and the quality loss of products. Li et al. 5 established multilevel optimization for tolerance allocation. Both quality- and cost-driven tolerance allocation problems are formulated. Cui and Zhang 6 presented an integration optimization model of tolerance and maintenance for multi-station sheet metal assembly. Based on the variation propagation state space model, a quality loss model of multi-station assembly processes was built. Zheng et al. 7 proposed an assembly tolerance allocation method using coalitional game theory in an attempt to find a trade-off between the assembly cost and the assembly quality. A multi-objective optimization model is introduced by using the reciprocal function and the worse case function as objective functions. Fan et al. 8 set up a multi-objective tolerance allocation model based on quality loss model and cost–tolerance model. Balamurugan et al. 9 suggested a model for optimal tolerance allocation by considering both tolerance cost and the present worth of quality loss such that the total manufacturing cost/loss is minimized.
Most of recent researches usually regard manufacturing cost and quality loss cost as objective functions. These studies mainly follow the rigid body assembly error theory, which is not suitable for the tolerance allocation of compliant sheet metal parts.
For different models, genetic algorithm, particle swarm algorithm and teaching-learning-based optimization (TLBO) algorithm, and so on are the main methods in current research to optimize the tolerance allocation problem. B Forouraghi 10 used an enhanced particle swarm algorithm to simultaneously optimize product performance criteria, the manufacturing cost, and the stack-up tolerance. Sivakumar et al. 11 presented a new method based on elitist non-dominated sorting genetic algorithm II (NSGA-II) and differential evolution (DE) for the sensitivity-based conceptual design and the tolerance allocation for mechanical assemblies. Rao and More 12 developed a TLBO method for optimal selection of design and manufacturing tolerances. In order to achieve zero percentage rejection, Ramesh Kumar et al. 13 proposed a new approach by implementing the non-traditional techniques: genetic algorithm, elitist NSGA-II, and DE for determining the optimum tolerance, zero percentage rejection, and manufacturing cost considering the varying quality loss constants. Among these optimization algorithms, NSGA-II is one of the most popular multi-objective optimization algorithms for its flexibility and extensiveness.
In this article, a multi-objective model for tolerance allocation of compliant sheet metals is discussed and the NSGA-II algorithm is introduced to solve the multi-objective problem. First, the assembly variation analysis model based on the power balance method is used to get the sensitivity matrix between parts and assembly. Then, the tolerance–deviation model and the tolerance–cost model are developed on the basis of the sensitivity matrix. After that, the multi-objective optimization model for tolerance allocation of the auto-body parts is established by considering the part tolerance and manufacturing cost as a multi-objective problem. Since the Pareto solution set and the convergence rate obtained by NSGA-II algorithm is not ideal, an improved NSGA-II algorithm is proposed by adopting orthogonal design and the cumulative sorting strategy. 14 Finally, the proposed method is illustrated through a case study.
Assembly variation analysis model for sheet metal parts
The commonly used variation analysis methods for sheet metal part are influence coefficient method, 15 static analysis method, and finite element method. 16 Among these methods, the influence coefficient method is the most widely used method. This method assumes that the sheet metal part is in elastic deformation range and the stiffness matrix can be extracted by using finite element simulation software. Based on the influence coefficient method, the power balance principle is used in this article to set up the assembly variation analysis model. The sensitivity matrix between part and assembly can be obtained from the model. The assembly variation analysis model according to the power balance method 17 is shown as formulas (1) and (2)


where
According to formulas (1) and (2), we can obtain the sensitivity matrix as follows

The stiffness matrix
where
Multi-objective optimization of auto-body tolerance allocation
The assembly deviation has a great influence on the final assembly quality. The tolerance–deviation and the tolerance–cost models are introduced by considering the assembly deformation. On the basis of these models, the multi-objective optimization model for tolerance allocation is established by taking the manufacturing tolerance of parts as the design variable. The optimization model takes into account the manufacturing and process tolerance of the parts. It can be used to analyze the effects of variation propagation and manufacturing deviation on the tolerance allocation.
The tolerance–deviation relationship model
In section “Assembly variation analysis model for sheet metal parts,” the sensitivity matrix of part deviation and assembly deviation is obtained by using the power balance method, and the linear relationship between them is established as
where
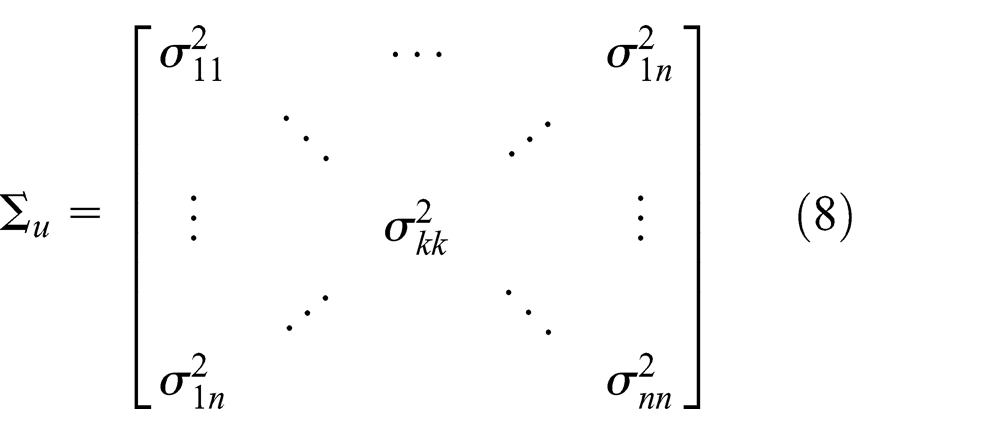
The covariance matrix of assembly variation can be defined as follows
where
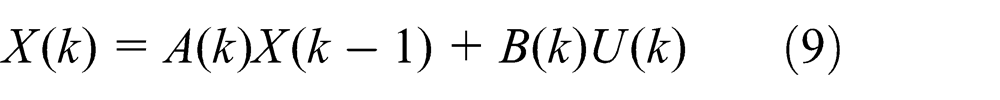
The variation propagation in multi-station assembly system can be regarded as a discrete, linear system, so we can use the discrete state space method19,20 to get the assembly system model. The dimension deviation of parts can be expressed as follows
And

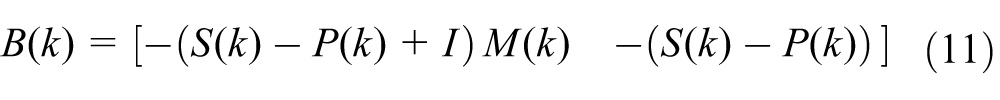
where
Assuming that the part deviation statistics are independent, that is, the covariance is zero, so the covariance relationship can be derived from the formulas (7) and (8)

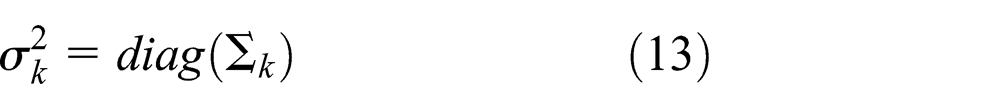
where
Formula (13) contains the KPC variance of the part, so the tolerance–deviation relationship between KPC and KCC (key control characteristic) can be obtained. 5 That is


where product tolerance
In the article, the scope of the product tolerance is
The tolerance–cost relationship model
Reducing tolerance will increase the cost, while using large tolerance will lower the product quality and increase the product repair rate. Cost is divided into manufacturing cost and fixed cost. Manufacturing cost is related to the machining accuracy, fixture layout, and production specifications. Fixed cost includes clamping, loading and unloading, handling, and other operations. The most commonly used tolerance–cost model is exponential model and reciprocal model. In this article, the exponential model is applied to represent the cost of the sheet metal assembly system. For the n-dimensional product tolerances and m-dimensional process tolerances, the tolerance–cost relationship can be expressed as

Multi-objective optimization model for tolerance allocation
The optimization model for tolerance allocation is developed based on the tolerance–deviation model and the tolerance–cost model. In this model, tolerance allocation takes into account both cost and quality, which is a multi-objective optimization problem. The model can be written as
Objective function

Constraint conditions


The optimization model consists of two objective functions
Improved NSGA-II algorithm
Since the Pareto solution set and the convergence rate obtained by NSGA-II algorithm is not ideal, the NSGA-II algorithm is improved by using orthogonal design and the cumulative sorting strategy.
The initial population based on orthogonal design
The initial population is generated by the stochastic method in standard genetic algorithm, so the distribution of the initial population is not uniform and it is difficult to produce a good, representative individual. However, individuals obtained by the orthogonal design method can be more uniformly distributed in the solution space, which helps the NSGA-II algorithm to search the entire solution space and easy to bring good individuals.
As we know, the orthogonal design method is usually used for continuous space, while the problem to be solved in this article is discrete, so we need to quantify the continuous space. Each value in
The steps of generating the initial population by orthogonal design method can be referred to Chen and Cai. 21
The cumulative sorting strategy
NSGA-II algorithm uses SBX (Simulated Binary Crossover) operator. The search ability of SBX operator is weak, which makes the Pareto sorting values cannot well reflect the density information of individuals. Therefore, the search ability of NSGA-II algorithm is decreased and the good individual may be eliminated.
In order to take into account the Pareto sorting values and density information of individuals, the cumulative sorting strategy is adopted in this article. The cumulative sorting method is as follows: first, each individual’s Pareto sorting value
The tolerance allocation based on the improved NSGA-II algorithm
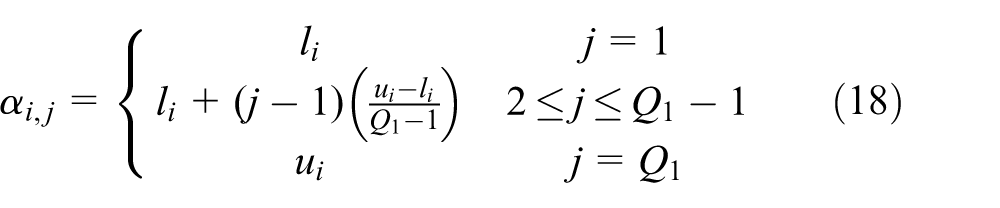
Algorithm flow of the improved NSGA-II is shown in Figure 1. First, the initial population is generated by orthogonal design method and the non-dominated sorting and crowding distance calculation are carried out. After selection, crossover, mutation, and other basic genetic operations, the newly generated offspring population is combined with the parent population. Then, non-dominant sorting and crowding distance are calculated again. After that, the cumulative sorting method is applied to generate a new population. The new population is the same size as the initial population. Continue the loop until the condition is terminated.
Flow chart of the improved NSGA-II algorithm.
Application
Case study description
Rear lamp bracket is a typical auto-body panel, it has the characteristics of space curved surface, asymmetric shape, and high surface quality. Assembly variation is easy to accumulate at the rear lamp bracket which affects the stability of the rear lamp and the appearance of the automobile. This article takes a rear lamp bracket assembly as an example to illustrate the tolerance allocation based on improved NSGA-II algorithm. The rear lamp bracket assembly is shown in Figure 2.

Rear lamp bracket assembly.
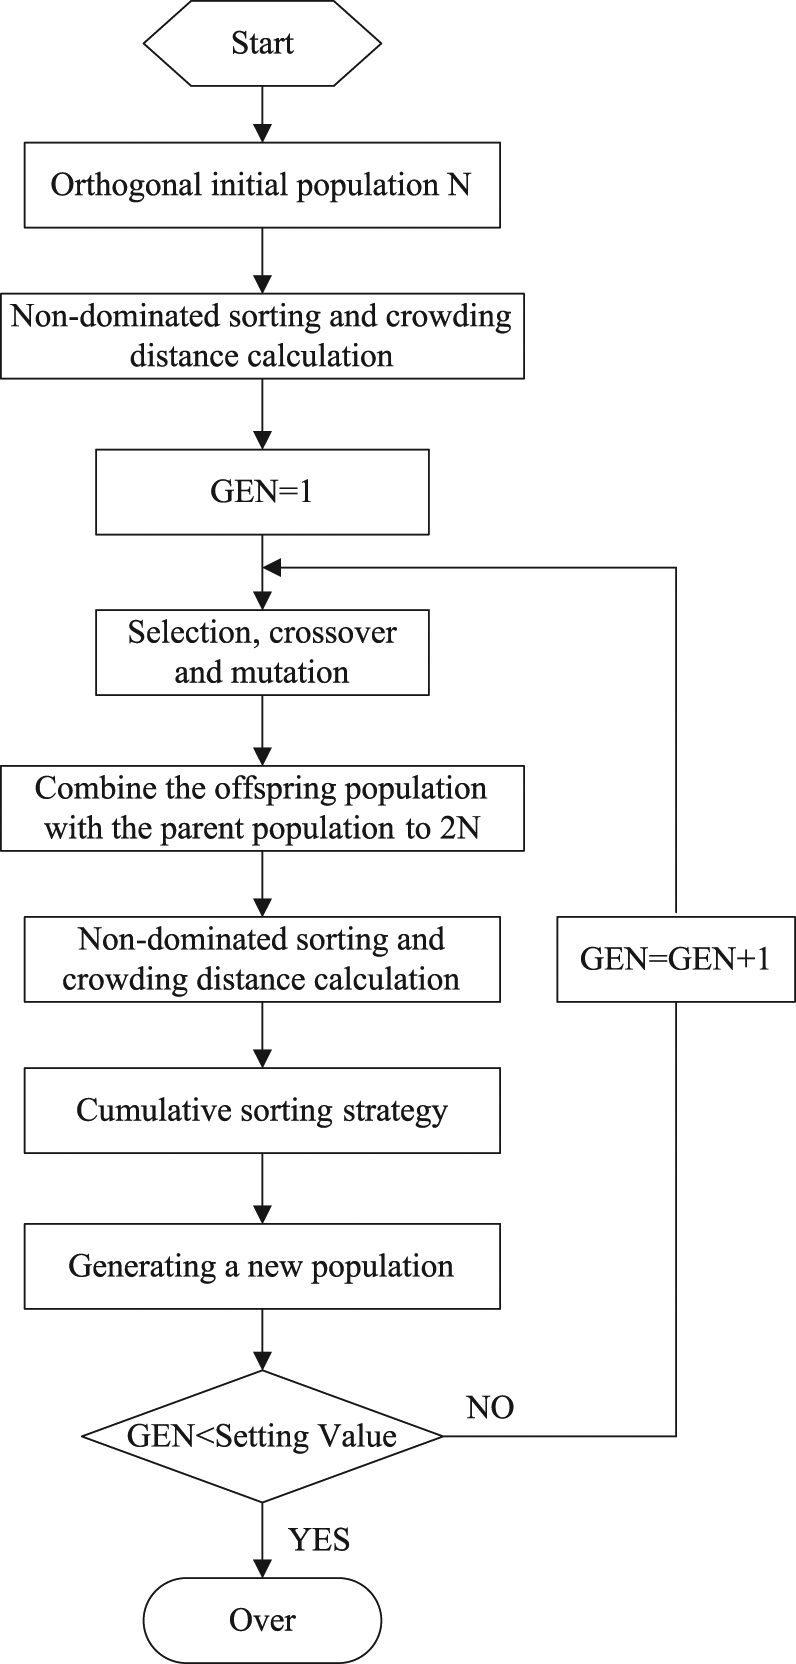
The finite element software ABAQUS is used to simulate the assembly process of the rear lamp bracket. The mesh models are shown in Figure 3. The material of the two rear lamp brackets is low-carbon steel, which Young’s modulus is 210 GPa and Poisson ratio is 0.3. The thickness of the outer rear lamp bracket is 1 mm, and the thickness of the inner rear lamp bracket is 1.5 mm.
Finite element analysis model of rear lamp bracket assembly: (a) the outer bracket, (b) the inner bracket, and (c) the rear lamp bracket assembly.
Key measurement points
The common method of evaluating the assembly quality is to select some key measurement points on the part and use the quality of these points to reflect the quality of the assembly. In the article, 12 key measurement points are selected to evaluate the assembly quality of rear lamp bracket assembly. In these 12 points, 6 points are arranged on the outer rear lamp bracket and 6 points are located on the inner rear lamp bracket. The 12 key measurement points are shown in Figure 4 and the coordinates of these points is shown in Table 1.

Measurement points of rear lamp bracket assembly.
Coordinates of measurement points of rear lamp bracket assembly.

Assembly variation analysis based on power balance method
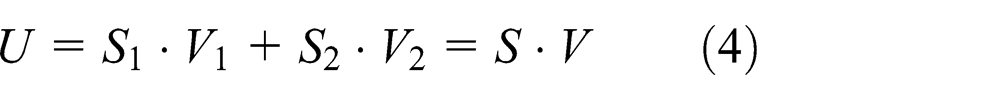
Assembly variation of the rear lamp bracket assembly is analyzed by using the power balance principle. The assembly variation analysis model is shown in formula (4).
Using finite element software ABQUAS, we simulate the assembly process of the rear lamp bracket. We can get the sensitivity matrix [S1], [S2]. The results are shown in Tables 2 and 3. Table 2 is the sensitivity matrix of the inner rear lamp bracket and Table 3 is that of the outer rear lamp bracket.
Sensitivity matrix of inner rear lamp bracket.

Sensitivity matrix of outer rear lamp bracket.

Optimization and results
The improved NSGA-II algorithm is applied to solve the multi-objective optimization model of the rear lamp bracket assembly. The relevant parameters are as follows: the crossover rate: 0.9, the mutation rate: 0.1, the maximum generation
The optimization model of the rear lamp bracket assembly is based on formula (17). The objective function and constraints are written to the MATLAB toolbox. After 100 generation iterations, the results are shown in Figure 5.

Pareto set of NSGA-II and Improved NSGA-II.
Figure 5 shows the comparison of the Pareto solution set of the NSGA-II algorithm before and after improvement. Before improvement, the individual distribution is not uniform; cost individuals are mostly distributed in 0–1 and 3–5 intervals; there are many overlapping individuals. After improvement, the Pareto solution set is closer to the non-dominated front, and the distribution of the Pareto set is obviously improved. The results show that the improved NSGA-II algorithm can get better Pareto solution set. Based on the optimization results, we can make the products tolerance allocation according to the product quality requirements and manufacturing cost plan.
After getting the Pareto solution set, we need to figure out the most suitable solution from the solution set according to the actual production requirements. The methods commonly used to select the suitable solution are: AHP (Analytic Hierarchy Process) method, ELECTRE (Elimination Et Choice Translation Reality) selection method, and TOPSIS (Technique for Order Preference by Similarity to Ideal Solution) method. In this article, the TOPSIS method is adopted to select the appropriate solution from the Pareto solution set.
Let sample space is
Step 1. To standardize the elements in

Step 2. To determine the positive and the negative ideal solutions


Step 3. To calculate the distance between positive and negative ideal solutions


Step 4. To figure out the relative adjacent degree between target value and the ideal solution

Step 5. To sort the Pareto solution sets by descending order according to
In the article, tolerance and cost comprise target vector
Optimization result of tolerance allocation.

Conclusion
In the automobile manufacturing industry, quality and cost is always a pair of prominent contradictions. The traditional model which uses the lowest cost as a means to evaluate tolerance allocation will lead to the poor applicability of the allocation scheme. It is difficult to adapt to the development of globalization and the cooperation in different places. In this article, the tolerance–deviation model and the tolerance–cost model are discussed based on the sheet metal tolerance variation analysis model. Then, the multi-objective optimization model of tolerance allocation is obtained. The improved NSGA-II algorithm is used to optimize and control the multi-objective model. Finally, the effectiveness of the optimization model is verified by the case of rear lamp bracket assembly. The method presented in this article has certain theoretical and engineering application significance. It can be used to solve the multi-objective optimization problem of auto-body assembly.
Footnotes
Academic Editor: Xichun Luo
Declaration of conflicting interests
The author(s) declared no potential conflicts of interest with respect to the research, authorship, and/or publication of this article.
Funding
The author(s) received no financial support for the research, authorship, and/or publication of this article.