
Abstract
The transportation system is synthesized by people, vehicles, roads, and environment, and people factor is initiative and plays a key role in the intermediate link between complex environment and vehicles. Virtual driving test is designed to research driver’s dynamic visual characteristics under different road conditions. This article applies faceLAB 5.0 eye tracker, Blue Tiger virtual driving device, and others to record eye movement changes of a driver in different road conditions, collect driver’s eye movement data, and analyze eye movement variation. Also, by comparing, checking, and disciplinary analyzing the measured data in different driving phases, this article conducts an analysis of eye movement changes of a driver while driving. In virtual driving test, drivers have low blinking frequency and long blinking duration in started section. When the section is complicated, drivers have increasing blinking frequency but shorter blinking duration and disperse visual fixation points. In decelerating section, drivers slow down and stop the vehicle. The research results provide the basis for safe driving, when date is more than a variable value, which can determine the driver unsafe driving. The research also has an important and practical role in the research of the driver’s behavior process in multi-source information environment.
Introduction
With the development of our national transportation infrastructure, traffic environment has become increasingly complicated with a rising trend of traffic accidents. From 1996, the traffic accident has become a worldwide public hazard. 1 According to statistics, traffic accidents caused by the driver’s negligence accounts for 78.55% of all traffic accidents. According to a traffic accident analysis 2 in seven countries by International Association for Driver Behavior (IDBRA), the impact of the driver factor on traffic accidents is the most important.
Being stimulated by the outside, a driver experiences psychological stress, distraction, and suffers a reduced judgment and visual acuity with a narrow vision field, slow movements, behavior disorders, and other physiological changes. 3 Therefore, it is of great importance to analyze relationship between driving and eye movement changes as a way to research safe driving.
Virtual driving system is featured by real time, safety, accuracy, and other characteristics. When simulating a traffic environment in a virtual driving system, 4 people can avoid actual traffic and accident loss, such as real property loss and casualties. This article analyzes driving safety via the Virtual Driving Test. Two groups of candidates, including experienced and inexperienced drivers, are chosen for virtual driving test. Experienced drivers need to have more than 5 years of driving experience and can be skilled in a variety of road driving; inexperienced drivers are novice drivers. By collecting and analyzing eye movement change data, the Virtual Driving System reports the relationship between eye movement change and traffic environment. Research results provide a basis for traffic accident analysis.
Despite significant efforts to improve driving safety, many studies have been done. Dynamic vision is a complex eye movement activity. Currently, researches on driver dynamic vision focus on visual search scope, visual attentional 5 region scope, and visual fixation order, but are short of researches on specific eye movement parameters. Until now, there are few comprehensive researches on the relationship of virtual driving scene, the driver’s blink frequency, blink duration, and visual fixation. 6 This article combine virtual driving scene with the driver’s eye movement test to study the driver’s driving the process blink frequency, blink duration, visual fixation. This article conducts an analysis of eye movement changes of a driver while driving, and the research results provide the basis for safe driving.
Research contents and test design
Research contents
Virtual Driving Test is mainly designed to research the direct relationship of the change of the driver’s visual characteristics and the change of the road environment. The experimentation includes the following contents:
In virtual driving test, it need to conduct base driving (driving without any obstructions) test for drivers to measure the free eye movement without any interference.
Experienced (more than 5 years driving experience) and inexperienced (novice driving) drivers are selected for testing. In a virtual operational laboratory conditions, use the eye tracker faceLAB 5.0 to accurately locate the driver’s pupil, eyes, and face, and obtain eye movement test data.
Virtualize driving behaviors under different road conditions, including at corners, junctions, and traffic lights. Different drivers are repeatedly tested on the same route to analyze the driver’s eye movement changes and reasons.
Select different drivers to analyze personality and states of different drivers so as to determine the driver’s driving behavior more accurately. The use of different data to judge a driver’s adaptive state provides a basis for driving behavior analysis.
Integrate multiple visual information data for analysis. Changes in driving behavior may not be caused by a single factor. Only the objective analysis is able to make an accurate decision. For example, by combining the visual system, we can determine whether the driver’s blinking frequency change is caused by driver fatigue or the road condition.
Test design
Select the driver and the virtual driving route, through the virtual driving; collect driver’s eye movement data through the virtual driving; mark the driving behavior; and analyze eye movement data. The specific process is shown in Figure 1.

Virtual driving test design.
Two groups of testing drivers are selected, and each group contains 50 people. One group contains experienced drivers (more than 5 years of driving experience), and another contains inexperienced drivers (novice driving). Two groups of testing drivers are familiar with virtual driving. Every testing driver is not familiar with the driving route; they are tested on the same route under fixed conditions. 7 In this way, test results can greatly avoid route changes and environmental differences caused by the external interference. The selected virtual driving route is shown in Figure 2.

Virtual driving road map.
The route selection strategy
The selected route is a circular route with the same start point and end point, and many turnings. The selected route can examine drive coordination of drivers. For inexperienced drivers, they are easy to have collisions caused by operational errors. There are no interference branches in the route. If a driver wants to successfully reach the end, he has to make the right traveling decision at the intersection. The correct traveling direction on the route has been indicated by the black arrow. The faceLAB 5.0 eye tracker is fixed on the Blue Tiger virtual drive machine.
For every driver, the eye tracker can accurately track changes in pupil angle, blinking frequency, blinking duration, and visual fixation duration and collect the accurate experimental data.
The virtual driving operation follows the above location process. When a driver changes gear to start, the driver activates the data recording mode. The virtual driving operation is shown in Figure 3.
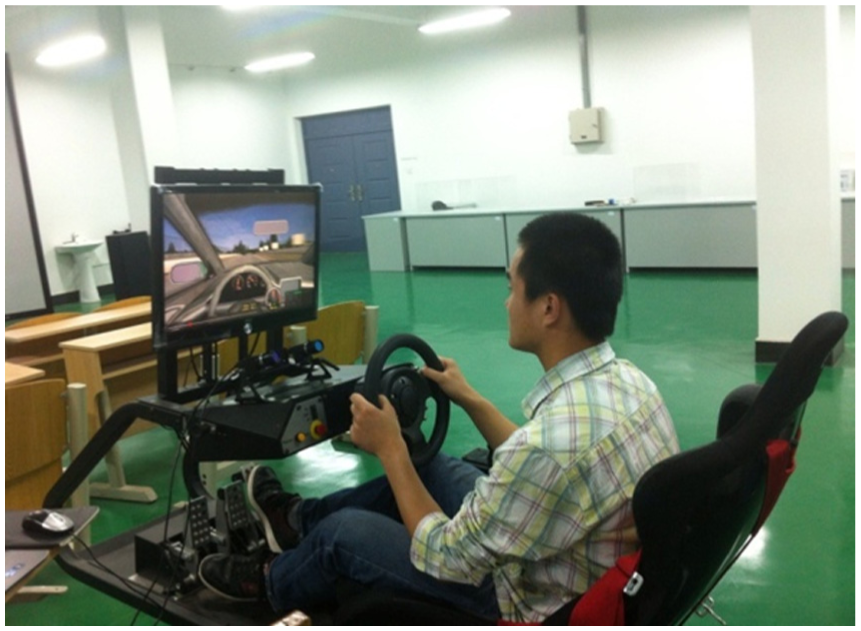
Virtual driving device operation.
Eye movement analysis in virtual driving
The output of Blue Tiger virtual driving machine is in accordance with the basic features of human vision. Virtual reality technology makes the scene presented on the computer screen in front of the driver. By fixing faceLAB 5.0 eye tracker, calibrating the eye tracker, tracking the location of the driver’s face, pupil, and eyes, and selecting the lane, the driver data can be collected when driving on the virtual route. It is shown in Figure 4.

Eye movement data collection of virtual driving.
For the selected route, experienced drivers take, on average, 101 s to complete the whole virtual driving, but inexperienced drivers spend 106 s to complete the whole virtual driving on average, 5 s more than experienced drivers; inexperienced drivers are slower than experienced drivers. Based on the virtual driving duration, the base driving (driving without any obstructions) duration is limited to around 100 s.
Different drivers take virtual driving on the same lane, and initial eye movement data can be obtained. The collected data are labeled after experiment. SPSS software is applied to analyze the imported eye movement data 8 and to verify the correlation, in order to ensure certain traffic condition; the changes in eye movement data will not occur at the same time. 9 Data samples are then analyzed. Each driving behavior will go through correlation analysis by taking 300 pieces of data. This article then analyzes driving behavior–related eye movement change data, plots curve graph, and analyzes the trend of eye movement. 10 Blinking frequency, blinking duration, and visual fixation can reflect drivers’ driving and physiological state. Furthermore, this article compares the curve graph of eye movement with different road conditions in order to get the impact of road conditions on the changes of driver’s eye movement.
Blinking frequency analysis
Under complex road conditions, eyes need to accept more external signals to determine road conditions. Suppose in the virtual driving test, the blinking frequency increases as the traffic becomes complex and is higher than that when driving in the base.
During the test, each blinking generates a pulse signal. The test can obtain images of blinking pulse variation in different driving phases of the experiment, as shown in Figure 5.

Driver’s eye beat frequency in different sections: (a) driver’s eye beat frequency of driving in base, (b) driver’s eye beat frequency of starting in field driving, (c) driver’s eye beat frequency of field driving in complex section, and (d) driver’s eye beat frequency of deceleration and stop in field driving.
According to Figure 5, it can be concluded that when traveling in the base, blink pulses are the minimum, and so does the eye beat frequency; in started section, blinking pulses blinking increases and eyes beat frequency arises; in complex section, blinking pulses become dense and sometimes there will be a continuous blinking; in decelerating section, blinking pulses reduce and eye beat frequency decreases.
According to the measured eye movement data, data curve graph can be plotted. Based on the pattern variation analysis, the rule of blinking frequency in base driving and virtual driving can be studied.
In base driving section, the data curve about blinking frequency versus time is shown in Figure 6.

Driver’s blink frequency curve of driving in base.
From Figure 6, it can be concluded that in base driving section, the experienced drivers have smaller blinking frequency than inexperienced drivers, and blinking frequency does not range greatly, from 0.1 to 0.2 Hz. In virtual driving, curve graph about blinking frequency versus time is shown in Figure 7.

Driver’s blink frequency curve of virtual driving.
From Figure 7, it can be concluded that blinking frequency in the virtual driving environment is higher than that in base driving environment. In virtual driving environment, experienced drivers have lower blinking frequency than inexperienced drivers. The virtual driving environment includes started section, complex section, and decelerating section. At the started section, blinking frequency is low. In initial complex section, the driver’s blinking frequency increases. In complex section, drivers need to receive more traffic information, and blinking frequency becomes consistently high. At the stage of parking, drivers stop their cars stables and do not experience any interference of other complex roads; so the blinking frequency decreases.
Blinking duration analysis
In base driving section, curve graph about blinking duration versus time is shown in Figure 8.

Driver’s blink duration curve of driving in base.
From Figure 8, it can be concluded that in base driving section, experienced drivers have very small blink duration variation and have a higher duration, inexperienced drivers have large blinking duration variation, range from 0.1 to 0.2 s (the normal range is 0.1–0.2 s).
In started section, curve plot about driver’s blink duration is shown in Figure 9.

Driver’s blink duration curve of virtual driving.
From Figure 9, it can be concluded that the blinking duration of testing drivers is located within the normal range (0.1–0.2 s). In the testing process, blinking frequency in virtual driving is smaller than that in base driving. In the entire virtual driving environment, experienced drivers have longer blinking duration than inexperienced drivers. In started section, blink duration is relatively long. In complex section, blinking duration is reduced. In decelerating section, drivers stop near a road with safety, but blinking duration increases continuously.
Data collected are put into SPSS software to do variables import analysis. For the analysis, the standard deviation of the sample data is obtained, and the standard deviation reflects the degree of deviation of the data and the data mean in the group and the degree of discretization (Table 1).
Correlation analysis of virtual driving eye movement data sample.

The mean standard error is used to measure the sampling error. The mean standard error is smaller, indicating that the smaller the accidental error caused by the sample heterogeneity, the greater the reliability of the extracted sample.
Visual fixation analysis
At the stage of driving, intersection of two formed angle vision is called visual fixations. Virtual driving computer screen (48-cm wide, 28-cm high) is used as visual distribution plane, with the diagonal center as a reference point, as shown in Figure 10.

The schematic of driver’s head model and computer graphic model of virtual driving.
In the process of data collection, the eye fixation point of head model falls on the front of the computer graphic model, and a yellow dot is in the projected position, or the position of visual fixations is located on the computer screen. In the virtual driving environment, 11 the position and the distribution of a driver’s fixation points are obtained and the driver’s visual rule according to discrete variation degree of the driver’s fixation point is analyzed. 12 Next, selected the average time of 1 min in the started section, the complex section, and the decelerating section to note video views in the unit of centimeters in diameter. The distribution of driver visual fixations points in virtual driving is shown in Figures 11–13.
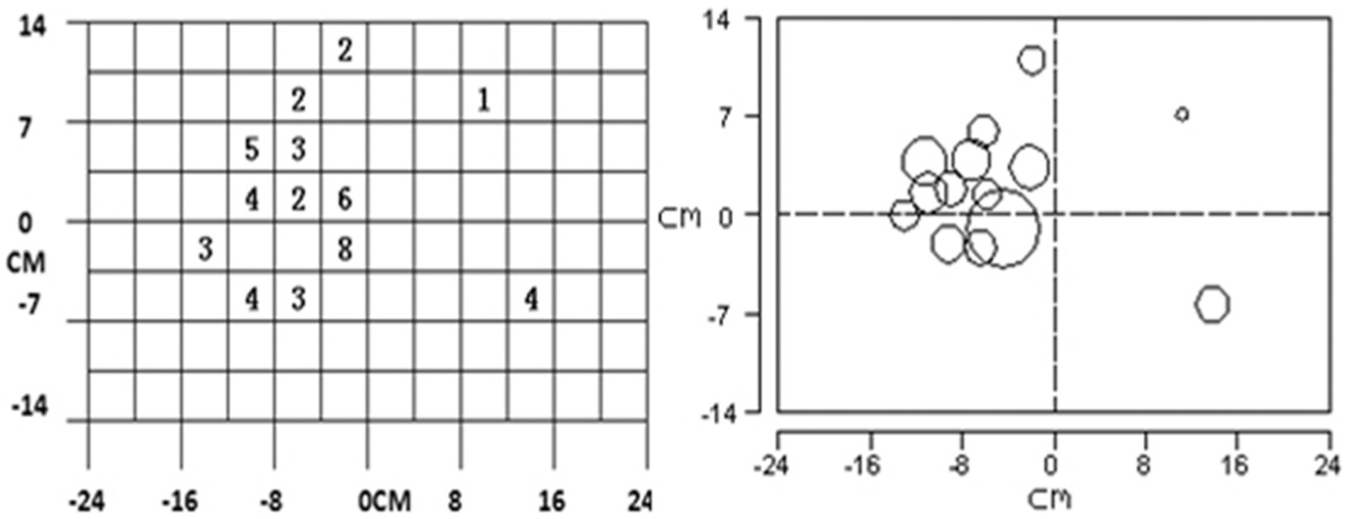
Driver’s visual fixations in started section.
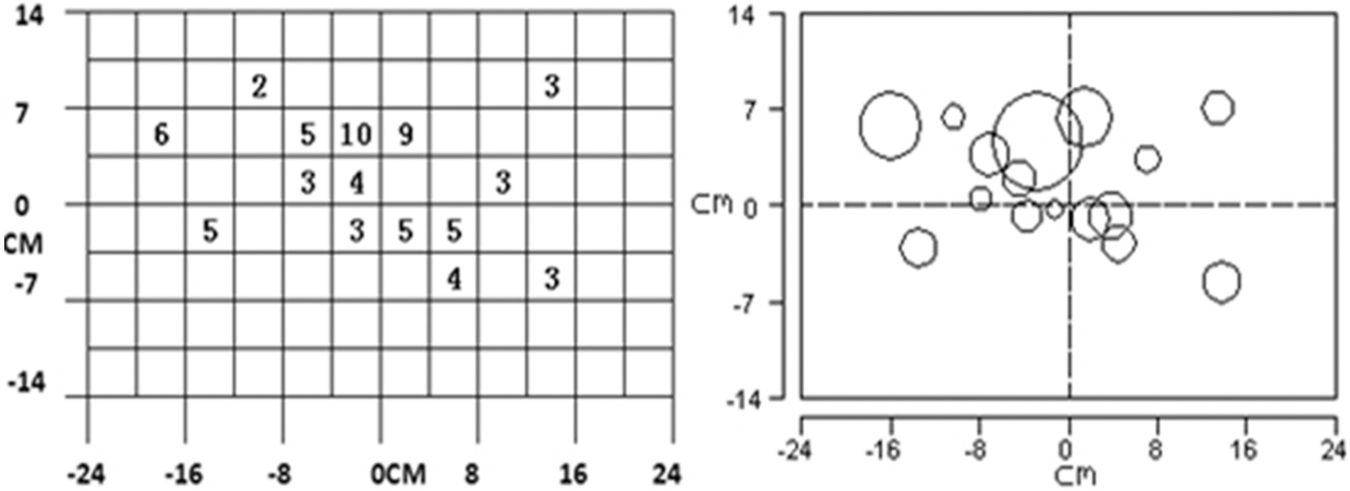
Driver’s visual fixations in complex section.

Driver’s visual fixations in decelerating section.
The position of a circle is the location of the driver’s visual fixation on the computer screen. Larger diameter indicates the higher visual fixation frequency. It should be noted that the number visual fixation represents the number of driver’s visual point of interest. 13 More fixation points represent that driving information in the area is more important.
From Figure 11, it can be concluded that in started section, the driver’s visual fixations are the most concentrated. From Figure 12, in complex section, visual fixations become disperse. From Figure 13, in decelerating section, visual fixations are relatively concentrated.
In the virtual driving environment, a comparative analysis on visual fixation points between experienced drivers and inexperienced drivers in complex section are conducted, as shown in Figures 14 and 15.

Inexperienced driver’s visual fixations in complex section.

Experienced driver’s visual fixations in complex section.
From Figures 14 and 15, it can be concluded that inexperienced drivers have longer visual fixation duration and more visual fixation times in vertical direction, but shorter visual fixation duration and fewer visual fixation times in horizontal direction. Furthermore, inexperienced drivers do not have many point of interest in the surrounding road or large search scope. On the contrary, experienced drivers have shorter visual fixation duration and fewer visual fixation times in vertical direction, but longer visual fixation duration and more visual fixation times in horizontal direction. Therefore, for experienced drivers, their visual points of interest are mainly concentrated in the horizontal direction, with more points of interest in the surrounding road and large search scope.
Conclusion
Using faceLAB 5.0 eye tracker, Blue Tiger virtual driving device, and other equipment, this article record the drivers’ eye movement variation under different traffic states in virtual driving test. From the analysis on eye movement variation in virtual driving test changes, conclusions are as the following:
When driving on the same road under the same traffic environment, experienced drivers have smaller blink frequency and longer blinking duration than inexperienced drivers do.
Test analysis indicates that blinking frequency is related with blinking duration. The higher the blinking frequency, the shorter the blinking duration. The shorter the blinking frequency, the longer the blinking duration.
In virtual driving test, visual fixation points of experienced drivers are mainly distributed in horizontal direction, and visual fixation points of inexperienced drivers are mainly distributed in vertical direction.
In started section of virtual driving test, road conditions are simple, and drivers have low blinking frequency, long blinking duration, and centralized visual fixation points. When entering the selected route, drivers have wider search scope, shorter fixation duration, higher blinking frequency, shorter blinking duration, and disperse visual fixation points. In safe decelerating section, drivers slow down and stop the vehicle and experience shorter blinking frequency, longer blinking duration, and somewhat centralized visual fixation points.
Eye tracking system used in the vehicle can effectively track the eye movement of the driver changes. It can be used in driving safety and reliability by eye movement analysis of the driver’s driving state and physiological changes in the driver during driving.
In future, there is a need to study the differences of eye movement between different groups and analyze drivers’ microscopic differences with data.
Footnotes
Handling Editor: Yongjun Shen
Declaration of conflicting interests
The author(s) declared no potential conflicts of interest with respect to the research, authorship, and/or publication of this article.
Funding
The author(s) received no financial support for the research, authorship, and/or publication of this article.