
Abstract
The safety state of road network in the bridge–tunnel groups is an important factor in evaluating road traffic safety. This article describes a case study simulating brittleness behavior of road traffic safety statue in the bridge–tunnel groups. First, the safety state of road network and brittleness behavior characteristics are analyzed; second, the relationship between brittleness behavior and safety entropy is also introduced, and the collapse process of the travel system of road traffic network in the bridge–tunnel groups is simulated, which is based on the adaptive agent digraph theory. Finally, the rear-end accident data from Liu’an mountainous freeway are verified through the reasonability and feasibility of adaptive agent digraph theory. The case study has shown that there is a certain delay in the collapse of whole system; the key of vertex collapse will lead to the collapse of the whole system in a short time; the initial value of each vertex has a significant impact on the collapse of the whole system. The findings in this study provide scientific guidance to potentially improve the current mountainous freeway design and traffic management policy.
Introduction
With the rapid development of China’s national economy, especially in the implementation of the western development strategy, the mountain freeway is undergoing a period of major change and rapid development. The construction of freeways in mountainous area provides favorable driving conditions, which has greatly improved the transportation situation in the mountain area. It helps to promote economic development in the mountain areas and also help to improve traffic–economic exchanges between west and east cities of the mountain areas.
However, due to the limitation by the topography and geological conditions, the bridge–tunnel groups (BTGs), such as bridges, tunnels, and the bridge–tunnel connection section, are found everywhere in the mountain freeway. Accompanied by a corresponding increase in motor vehicles and traffic accidents, road traffic accidents significantly increase with increased length of mountain freeway (km), which is a serious harm to people’s lives and property. It is also a new challenge to improve the road traffic safety and security in the mountain freeway. The BTGs of the mountain areas are composed of bridges, tunnels, the bridge–tunnel connection section, and the basic road; Traffic environment of BTGs system is complex, with the characteristics of accident-prone. The traffic accidents happened in the road sections of BTGs caused mostly high death rate and serious casualty accidents. Hence, currently, it is a major topic to study the traffic safety of BTGs in mountainous freeway.
Literature review
BTGs, with the three types of structure, are a combination of bridges, tunnels, and connected road segments. The travel system of road traffic network in BTGs of the mountain freeway is an open complex giant system, which involves a large number of influencing factors. The related research has been done on vehicle design, roadway design, traffic speed, accident prediction, risk assessment, skill and defects in driver’s behavior, and also the properties of shipped hazardous substances.1,2
Mountainous freeways usually exhibit complex geometry features such as steep gradients or sharp curves, 3 which make it challenging for designers and engineers to construct roads according to engineering standards. Furthermore, mountainous freeways experience adverse weather conditions more often than non-mountainous counterparts, which make the traffic driving environment more complicated. In recent years, there have been many studies on road safety along mountainous freeway, and different topics or evaluation approaches have been attempted to examine freeway operating environment for safety design and operation,4–6 especially in the BTGs of the mountainous freeway. 7 Traffic crashes along mountainous roads are higher than non-mountainous roads, and it has been confirmed by road traffic crash data from different countries, such as Sabah, Malaysia, 8 Guangdong, 9 Sichuan, 10 and Shin-Meishin Freeway. 11 In order to explore the causes of the accidents, Yeung and Wong 12 conducted a research in the Singapore freeway tunnels and found that road traffic accidents are more likely to occur when entering the tunnel than exiting. In the continuous long downgrade sections, Chen et al. 13 found that the traffic accident rate is highest when the grade value of continuous long downgrade section is in the range of 3%–4%. The average death and injury intensity on sharp horizontal curves are much higher than those on straight sections of the freeway in China.
During the past two decades, researchers have made significant contributions to the road safety analysis and evaluation. To explore the safety of the traffic driving environment in freeway tunnel, a risk-assessment approach based on multiple safety indices has been proposed by Chen and colleagues,5,6 and these safety indices for the traffic driving environment include road environment, traffic operation environment, traffic engineering facility environment, and weather environment. Similarly, some extreme situations, such as under evacuation or serious congestion, are also discussed by Chen et al. 14 In order to further reduce numbers of traffic accidents in the mountainous freeway, it is important that accident risks are assessed as accurately as possible. Deublein et al. 1 proposed a Bayesian probabilistic network model to estimate the number of accidents involving personal injury. Cai et al. 15 simulated the wind–vehicle–bridge system and their interactive effects. For the traffic safety assessment of tunnel groups, Guo et al. 7 developed a relative different function of the variable fuzzy theory. Moreover, they built a safety assessment model for tunnel groups. Li et al. 16 found that long freeway tunnel had already become main space distribution and accident black point of the road traffic accident. At the same time, traffic accidents in tunnel easily cause fire with dense smoke and cause difficulty for evacuation. These researches provide a theoretical basis to enhance freeway safety management and to improve the driving safety on mountainous freeway.
In order to improve traffic safety in the mountainous freeway, road traffic safety researchers have recommended numerous countermeasures from the perspective of engineering and/or management. As one of the most important countermeasures, it is necessary to set up reasonable speed limiting in mountainous freeways.16–18 Reasonable speed limit suggestion values are put forward earlier by Pei and Cheng. 19 They suggested that the values of 85th and 15th percentile speed are the maximum and minimum speed limits, which should be determined by the curvature changing rate of single circular curve (CCRs). That is, when the value of CCRs is estimated to be [0, 5)°/km, the reasonable speed limit suggestion value is 70 km/h; next, when the value of CCRs is estimated to be [5, 10), [10, 15), [15, 20), and [20, +∞)°/km, the corresponding speed limit suggestion values are 65, 60, 55, and 50 km/h. Then, following previous researches, Rusli et al. 8 found that the odds ratio of “out-of-control” crashes and the crash involvement due to speeding are about 4.2 times and 2.8 times higher on mountainous than non-mountainous roads, respectively. The other is, for proactive incident management and strategic planning, lots of research results also exist in proactive prevention of collision with freeway tunnels. For instance, Sohn and Shin 20 used the pattern recognition for road traffic accident severity in Korea. In addition, distribution characteristics of traffic accidents and regularity in freeway tunnel group were analyzed by Zhang et al., 21 such as distribution of time, distribution of space, traffic accidents’ form and vehicle types. Later, the associations of spatial characteristics, including geometric and land use factors, were explored by Khattak et al., 22 and they also presented secondary and non-secondary incident records from Hampton Roads in Virginia. Compared with the car, Dai et al. 23 proposed a vision-based method to detect over-height trucks. Ho and Hsu 24 introduced disaster resilient network for tunnels and bridges.
In summary, it is shown that the previous work mainly focuses on the characteristics of road traffic accident, which mainly include crash type, crash severity, roadway geometric features and environmental factors, and road user/vehicle characteristics. Meanwhile, different methods or data-mining techniques have been attempted to examine the factors influencing crash occurrence and injury severity of traffic crashes on the mountainous freeway. Unfortunately, there are few research studies about the vehicle safety situation in the BTGs exist, and these mathematical models or technologies are not practically working well in China. Moreover, there are less complexity theories and system methods exist in the current research methods. In a consequence, in this article, we use the complex adaptive agent simulation modeling, which belongs to the complexity theory, to simulate the vehicle’s safety situation among BTGs for the purpose of providing a novel idea for the traffic accident analysis and prevention in the mountainous freeway.
Road traffic safety status in BTGs
Types of BTGs
The BTGs are composed of bridges, tunnels, and connecting sections, which mainly include bridges and tunnels. In the mountainous freeway, generally speaking, as the length of bridge–tunnel connection section is short, interactions between the bridge and tunnel increase. For instance, some connection sections of BTGs with no road link, the bridge abutment, and tunnel entrance are designed tightly close together. Simultaneously, there is only a very small construction joint between them. However, some of them are designed as a whole structure. According to the connection closeness between the bridge abutment and adjacent tunnel entrance, BTGs are divided into three types: (a) integrated type of BTGs, (b) appressed type of BTGs, and (c) connection type of BTGs.
Integrated type of BTGs is a type of BTG in the mountainous freeway, which is illustrated in Figure 1. In Figure 1, the integrated type of BTGs is made of bridge, tunnel, and tunnel entrance. However, in terms of the structure, bridge abutments and tunnel entrance are integrated as a whole, not separated from each other. However, from the stress and deformation, both of them bear loads together with a consistent deformation. As this integrated structure plays a fundamental role in tunnel entrance and bridge abutments and the structural mechanics calculation is complex, if there is a structural problem, its adverse effects and consequences will be more serious.
Appressed type of BTGs is the second type of bridge–tunnel groups in the mountainous freeway, which is illustrated in Figure 2. In Figure 2, the appressed type of BTGs is made of bridge, tunnel, bridge, and two tunnel entrances. In the space of BTGs, the bridge abutments and tunnel entrance are connected as shown in Figure 2, that is, it seems like there is no road connection between them. But they are also separated in the structure, because there is a construction joint between them. In the view of physical deformation and displacement, under the normal circumstances, due to the existence of construction joints, the physical deformation and displacement of bridge abutments and the tunnel entrance are independent and unrelated to each other. Moreover, because both the physical deformation and displacement are often uncoordinated, transverse cracks will appear in the bituminous pavement of BTG construction joints, even the dislocation will be formatted between the connection of bridge abutments and tunnel entrance; thereby, the comfortableness of driving will be influenced and the serious traffic safety risks will also be brought.
Connection type is the third type of bridge–tunnel group in the mountainous freeway, which is illustrated in Figure 3. In Figure 3, the connection type of BTGs is made of tunnel, bridge, tunnel, and four tunnel entrances. Bridges and tunnels are not directly related with respect to structure, stress, deformation, and other aspects, both of them are connected by the road section. Although they are connected with the bridges, tunnels, and the connecting sections, the pavement base is different, as the bridge and tunnel pavements are rigid, but the connecting sections may be rigid or semi-rigid. For the drivers, it is difficult to identify the connectivity and smoothness in the BTGs; at the same time, the pavement of bridge, tunnel, and connecting section are associated, and then, the traffic safety of driving is influential.

The integrated type of BTGs: (a) schematic diagram of bridge–tunnel and (b) Wantian bridge–tunnel group in Mengzi highway, Yunnan, China.

The appressed type of BTGs: (a) schematic diagram of bridge–tunnel–bridge and (b) long quanshan bridge–tunnel group in Chengyu highway, Sichuan, China.

The connection type of BTGs: (a) schematic diagram of tunnel–bridge–tunnel and (b) Qinling bridge–tunnel group in Xihan highway, Xi’an, China.
Description of road traffic safety status in BTGs
Road traffic safety status (RTSS) in the BTGs refers to a situation in which vehicles do not have damage or loss in a series of influencing factors or the possibility of losses is in the acceptable range. The evolutionary process of RTSS in BTGs is not only bridge–tunnel traffic system security entropy group dynamic process but also an information receiving, processing, decision-making, application, and feedback process of vehicle safety status.
The RTSS means the system can allocate their resources which is required for each process in a certain order until reach the maximum demand, such as <P1, P2, …, Pn> (which is regarded as the security sequence), so that each process can be completed in an order. The travel system of road traffic network in the BTGs will be in an unsafe condition if it does not have the security sequence.
Road traffic system in the BTGs is a complex system with brittle characteristics. 25 When parts of the subsystem are disturbed by the outside interference, it will also affect other subsystems and lead to collapse because of the associated interaction among subsystems. When there are a sufficiently large number of collapsed nodes and large enough expansion of the collapsed effect, the whole system (note that in this article, the whole system is the travel system of road traffic network in BTGs as follows) will crash, which will finally lead to traffic accidents in BTGs. Brittle characteristics of a complex system S mean that there exists a subsystem or part of the system Si, which has a strong sensitivity to the environment. When Si collapses, due to the disturbance or attack caused by internal and external factors (including information, material flow, and other factors), other parts or subsystem will also collapse, which may led to the collapse of the entire complex system. This behavioral characteristics of complex systems have been called brittle characteristics. 26
The collapse process of a complex system is actually a diffusion process of entropy increase. 27 A complex system includes a number of adaptive subjects. With the disturbance of outside interference, while the entropy increases rapidly, negative entropy flow will be provided by adjacent subjects to slow down the increasing rate of entropy value and delay or prevent the occurrence of collapse. As time goes on, due to its increasing entropy and outward negative entropy flow, adjacent subjects’ ability of providing negative entropy weakens gradually and collapse trend becomes obvious. Ultimately, the subject collapses when completely lose the ability to provide negative entropy flow. Although the adjacent subjects will absorb negative entropy flow from its adjacent subjects, it will eventually crash. And the other subjects will collapse similarly due to chain reaction. When all subjects have collapsed, the entire system crashes.
Simulation approach for RTSS
Definition for adaptive agent digraph
An adaptive agent digraph (AAD) is a modeling and simulated method of complex systems which combines complex adaptive systems theory with graph theory. The vertex is regarded as the main body of complex adaptive system, and at the same time, the direction and weight of one side in the graph represent the interaction among subjects in the system. A directed graph D is described in equation (1)
where V means vertex set, and every vertex
AAD of travel system in the BTGs
In order to impart the characteristics of its adaptability, the directed graph D should also include six parts: topology, flow, the interaction among the vertices, memory functions of vertex, evolution rules of vertex and global entropy function.
For the travel system of road traffic network in the BTGs, the influence factors are assumed to vertex and the correlation between the factors are assumed to edge. Brittle contact of travel system in BTG is represented by brittle figure
Topology. Topology of travel system network in BTGs is a combination formed within accident causation factors.
Safety entropy flow. The brittle relationship among subsystems of a travel system in the BTGs is implemented by assigning safety entropy flow. Safety entropy flow of vertex

In equation (2),
where

where m means vertex have m kinds of crashes. Hence, the inverse function of function F is
3. The interaction between the vertices. It is a transfer behavior of collapse which is generated by the exchange of safety entropy in subsystems of travel system of road traffic network in the BTGs. So, the interactive form among vertices is determined by the exchange of safety entropy flow among vertices, transmission form of safety entropy flow, as well as topological structure.
The arc

where
4. Memory functions of vertex are used to store the safety entropy flow and status of vertices. For example, a memory function of store status can be set in equations (6) and (7)


where
Vertices status and safety entropy are stored by real-time memory function. The remaining information which is helpful to system analysis can also be stored through the establishment of other functions.
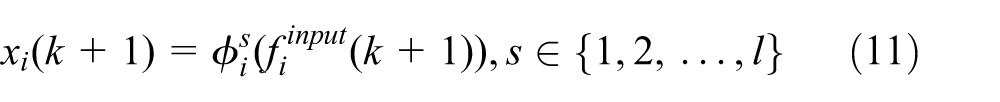
5. Evolution rules of vertex. An evolution equation of discrete dynamical system is used to represent the evolution rules of its brittle behavior
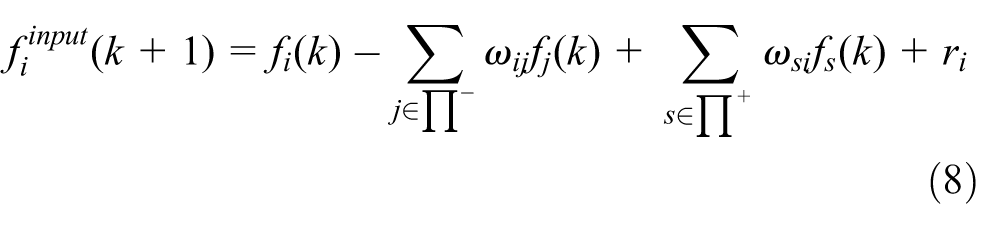
In equation (8), the left term represents the safety entropy input of vertex i from moment k to moment
The principle of IF/THEN has been built in equations (9) and (10)
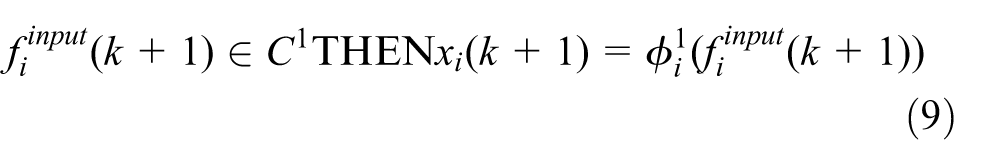

where
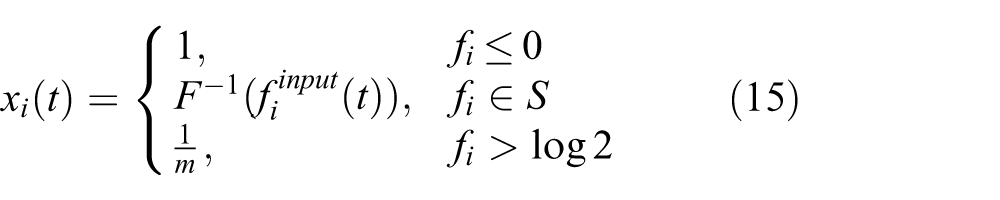
The state equation is
where
According to the interactive process of safety entropy, we can know the safety entropy output of vertex i from the equation

6. Global entropy function. The global entropy function is defined as

The global entropy function mentioned above reflects the disorder in the whole system and also a collapse index of the whole system. Based on the above six points, an AAD about brittle links among subsystems of travel system of road traffic network in the BTGs is established.
Case study—Liu’an mountainous freeway
Data source and collection
The study examines RTSS in BTGs with data 25 for the period 2007–2012 from Liu’an mountainous freeway, Anhui Province, China. The main influence factors come from 100 traffic accidents with rear-end collision, which include overspeed factor, fatigue driving factor, failure to keep a safe distance factor, vehicle factor, road factor, and environmental factor. In the traffic accident data, the accident number, the death toll, the number of injured, and the economic losses are collected for the AAD simulation.
The adjacency matrix can be obtained by the principal component analysis (PCA) method, 29 as shown in equation (14)

Simulation process and results
Every secondary causation factor is regarded as vertex of the graph, and each side has its weight to represent the transfer of safety entropy flow. At the same time, every vertex consists of safety entropy flow
Step 1: initialize parameters. Set collapse on vertices at initial moments and safety entropy flow
Step 2: update vertex status and safety entropy flow. The status and safety entropy flow of vertex at the next moment can be determined according to equations (8), (12), and (15).
In addition, the vertices are listed using the PCA method, and these are as follows: the first vertex (fatigue driving), the second vertex (over-speed), the third vertex (failure to keep a safe distance), the fourth vertex (vehicle), the fifth vertex (road), and the sixth vertex (environment). Of these six vertices, the first four vertices can absorb not only positive entropy but also negative entropy. This is because with the adjustment of driver or external factors, these four factors can promote the security of other vertices and the whole system. If unchecked, it will have harmful effects on other vertices and the whole system. According to the prescribed standards, the energetic driver can control the deviation of speed and headway well. This is also helpful in maintaining the performance of vehicles well. If the driving time is too long and there is no rest during driving, the driver’s over fatigue can lead to great deviation in speed as well as headway, improve the speed, and increase the distance between vehicles unconsciously. Driving a vehicle for a long time will cause performance degradation. Since vehicle vertex and road vertex cannot absorb negative entropy, after reaching the upper bound of entropy, they can no longer provide negative entropy. There is a requirement for the service life of vehicles and roads, and as time goes on, vehicle performance and road status gradually transmit into bad aspects and the effect of negative entropy can only slow the trends rather than change radically.
Step 3. Update weights according to equation (5).
Step 4. Calculate the global entropy function according to equations (13) and (15). If the termination condition is reached, the cycle ends; otherwise, it returns to step 2.
Assume that the safety entropy flow is passed between the external factors and vertices of brittle elements, and then, the status and safety entropy flow of brittle element vertices will change. At the same time, the global entropy value of AAD D will also change. The simulation results are shown in Figures 4 and 5.

Entropy flow and state change curve of each vertex: (a) entropy 1(L) and state 1(R) in vertex 1, (b) entropy 2(L) and state 2(R) in vertex 2, (c) entropy 3(L) and state 3(R) in vertex 3, (d) entropy 4(L) and state 4(R) in vertex 4, (e) entropy 5(L) and state 5(R) in vertex 5, and (f) entropy 6(L) and state 6(R) in vertex 6.

Change curve of system global entropy.
From the curve graph, we can see that safety entropy value of vertex 1 reaches the highest rapidly and reach the collapse status quickly. Vertex 2 and vertex 3 are sensitive to the influence of vertex 1 and also quickly reach the maximum value of safety entropy and collapse status. It will also affect vertex 4, vertex 5, and vertex 6, which also reach the maximum value of safety entropy and collapse status when the step length reaches to 4. With its influence, the global entropy value of the whole system reaches a peak when the step length reaches to 4. It is visible that vertex 1 has a large impact on other vertices and the entire system, and the greater the disturbance, the faster conversion to a state of collapse. Fatigue driving can easily lead to accidents, which is consistent with the national statistical rules of road traffic accidents over the years.
Considering that the outside world can have manual intervention on each vertex, the principle of IF/THEN can be built, that is, when the security entropy of a vertex reaches to maximum, negative entropy is provided by the outside world to reduce the positive entropy, so that order degree of the vertices increases. Thus, the security and stability of the whole travel system in BTGs can be increased. Its changes are shown in Figures 6 and 7.

Updated entropy flow and state change curve of each vertex: (a) updated entropy 7(L) and state 7(R) in vertex 1, (b) updated entropy 8(L) and state 8(R) in vertex 2, (c) updated entropy 9(L) and state 9(R) in vertex 3, (d) updated entropy 10(L) and state 10(R) in vertex 4, (e) updated entropy 11(L) and state 11(R) in vertex 5, and (f) updated entropy 12(L) and state 12(R) in vertex 6.

Updated change curve of system global entropy.
Figures 6 and 7 illustrate that initially six vertices have emerged due to entropy fluctuations, and as time goes on, with the intervention of external factors, the safety entropy of these six vertices become stabilized, showing a shock state; with the change in safety entropy value, their status also change—significant fluctuations in the beginning and showing a shock state later. Along with safety entropy change and state change of six vertices, global entropy of the entire system also changes, showing a shocking behavior.
The maximum vertex value of safety entropy flow in travel system of road traffic network is lg2. And termination conditions are safety entropy of all the vertices in systems has reached the maximum value and at the same time the state of all vertices is 1. With the above-mentioned regulations, we can get two curves for vertex 1, that is, the collapse probability curve of a system after it collapse, together with the system safety entropy change curve, in which collapse probability refers to the probability that all six vertices collapse. Figure 8(g1)–(g3) shows the change in collapse probability by the time steps. Similarly, Figure 8(h1)–(h3) shows the change in system global entropy by the time steps.

Collapse probability and system safety entropy change curve of different initial value: (a) initial value (1.00 0.494 0.463 0.308 0.282 0.167)T, (b) initial value (1.00 0.694 0.363 0.708 0.202 0.567)T, and (c) initial value (1.00 0.394 0.403 0.208 0.882 0.767)T.
The initial value of six vertices in travel system of road traffic network of the BTGs can be selected randomly several times, and then, three main state changes can be concluded as shown in Figure 8(a)–(c). Simulation result 1: Figure 8(a) shows that collapse of one vertex will lead to the collapse of the whole system in short time. Simulation result 2: Figure 8(b) presents that after the collapse of one vertex, the system appears to be at shock state, and after a period of time, the entire system collapses because other vertex crashes. Simulation result 3: Figure 8(c) displays that collapse of one vertex does not lead to the collapse of the whole system or only causes part of the vertices to collapse rather than collapsing all vertices, showing a shock state.
Conclusion
In the past three decades, China has sustained unprecedingly rapid development in mountainous freeway. BTGs, as a part of mountainous freeway network, play an important role in the western development strategy of China. The road traffic safety statue with the brittle behavior characteristics in BTGs is a dynamics complex situation. Hence, the AAD theory and simulation approach are applied; meanwhile, the brittle behavior characteristics of BTGs are also analyzed, for the purpose of revealing the cause of the road accident and the evolutionary process of the road traffic safety statue in the mountainous freeway.
This article has presented an AAD simulation model for road traffic safety statue in BTGs, taking into account the brittle behavior characteristics of road traffic in BTGs. The proposed simulation model is motivated by the fact that the drivers in the travel system of road traffic network of BTGs are multi-agents, who can adjust/adapt their status or behaviors according to the road traffic safety statue and traffic environment. The following points summarize our additional findings.
The entire system (travel system of road traffic network in BTGs) will be influenced when one vertex collapses, because there exist brittle links between vertices and it is realized by the communication and delivery of safety entropy flow. Since the collapses of key vertex have more influence on the system and may lead to travel system collapse in a short time, it is important to focus on monitoring and protecting the key vertex. When the key vertex is disturbed, taking timely measures to prevent its collapsing behavior or delay the time of crash behavior is the key to maintaining security and stability of the entire system. Available resources can be taken from outside to suppress internal entropy increase in vertex, which can prevent the vertex from breaking the threshold value and collapse.
There is a certain delay in the occurrence of collapsing behavior of the whole system (travel system of road traffic network in BTGs). Every vertex has a certain recovery capability, and vertex repair can also be derived from the systems outside intervention. Collapse control of vertex in subsystem can be implemented through the following channels: first, restraining the safety entropy accumulation of vertex itself, such as reducing the value of transition probability, increasing the security constraints of subsystems, and using redundancy technique; second, improving the maximum safety entropy of vertex itself; third, with the introduction of negative entropy which comes from outside, the accumulation of safety entropy inside the vertex can be relieved.
The initial state values have a significant impact on the collapse of the entire system. Assuming that the correlation coefficient of vertex is decided, the whole system’s collapse behavior is determined by the value of each vertex initiate state. The AAD theory can not only be used to reveal the evolution trends of RTSS in BTGs but also provide new ideas for safety evaluation of dynamic vehicle status and achieve macro security of systems by controlling the micro factors.
It should be noted that despite the improvement in the modeling results, there are still notable estimation errors remaining in the AAD simulation method. This is likely resulted from the three types of BTGs, which are integrated type of BTGs, appressed type of BTGs, and connection type of BTGs. The brittle behavior and brittle characteristics of three types are different in the road traffic system. Similarly, some dynamic factors with regard to freeway operations such as driver gender, travel purpose, and major types of accidents will also affect the simulation results of RTSS in BTGs. In addition, regarding our basic data source and collection of the Liu’an mountainous freeway, there were some challenges involved in simulating the RTSS in the travel system of road traffic network of BTGs. First, there was no information on the ratio of effect of other factors on RTSS. Second, a limited information with AAD was obtained from the rear-end accidents in the Liu’an mountainous freeway. Notwithstanding its limitation, this study provides excellent results even considering these challenges for choosing good models. Moreover, during the process of simulation in our study, the six vertices of AAD are chosen by the rear-end collision data, and the PCA method is used for standardization of influence factors. Furthermore, these problems could be solved if more accurate accident data and types of accident are provided. In the future study, we will continue to focus on the road traffic safety statue of BTGs, not only the single freeway, but also the whole freeway networks. Based on this, the traffic network operating state of mountainous freeway will be evaluated by the information technology for the road administrators and drivers.
Footnotes
Academic Editor: Fen Wu
Declaration of conflicting interests
The author(s) declared no potential conflicts of interest with respect to the research, authorship, and/or publication of this article.
Funding
The author(s) disclosed receipt of the following financial support for the research, authorship, and/or publication of this article: The work described in this paper was mainly supported by the open fund for the Key Laboratory for Traffic and Transportation Security of Jiangsu Province (No. TTS2016-04, TTS2017-07); the Public Technology Application Foundation of Zhejiang Province of China (No. 2016C33256); the Natural Science Foundation of Zhejiang Province, China (LY17E080013); Philosophy and Social Science Program of Zhejiang Province, China (17NDJC130YB); and Natural Science Foundation of Ningbo City, China (2016A610112). The anonymous reviewers are appreciated for their constructive comments and valuable suggestions to improve the quality of the paper.