
Abstract
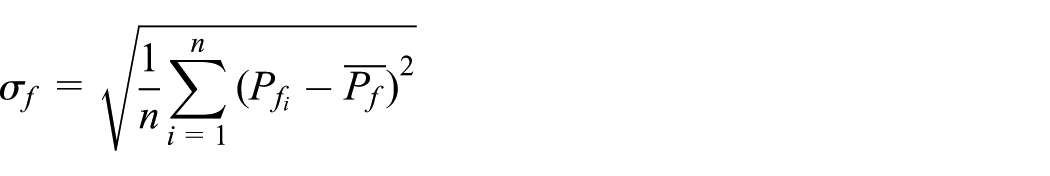
Gas kick detection is an essential part of safe well control process in deep water drilling. The conventional gas kick detection methods are based on the drilling mud flow velocity measured near the well mouth which often results in a high probability of delay. For deep water drilling, the gas kick detection method based on non-intrusive detection at mud line is one of the most commonly used methods with low cost and strong timeliness. In this article, the reflection model of continuous Doppler ultrasonic wave in multiphase fluid was analyzed and an improved gas kick detection method at mud line was proposed. The proposed method gives a comprehensive judgment on gas kick state based on continuous Doppler shift frequency (multiphase flow velocity), amplitude, and spectral shape. Experimental results on water and
Introduction
Multiphase fluid, especially gas–liquid fluid and gas–liquid–solid fluid, has been the research hotspot in fluid mechanics. Since the flow characteristics of multiphase fluid are influenced by initialization/boundary conditions, fluid properties, and even temperatures and pressures, existing methods mainly focused on simulations and/or experiments, which summarize and analyze characteristics of multiphase fluids by observed results and experiences. Researchers have conducted various experiments and simulations on gas–liquid multiphase fluids in vertical pipes. Recently, Lin et al. 1 studied void fraction, bubble size, liquid velocity, bubble rise velocity, and solid fraction in gas–liquid fluids through experiments. They indicated that radial forces become more uneven if bubbles in fluids are bigger, thus making bubble shape changeable and influencing the flowing properties of the whole fluid. Therefore, bubble size is one of the influencing factor of flow regime. On the other hand, they found in experiments that big bubbles concentrate in center, while small ones are close to pipe walls. This was later verified by Ozar et al. 2 and Wang. 3 According to the above-mentioned experimental results, although the accurate relationship between void fraction and flow regime could not be gained, it can be sure that void fraction and gas-phase fluid velocity under the turbulence are higher than those under steady flow regime. Julia et al.2,4 explored void fraction, bubble size, and flow regime in annulus used in deep sea drilling thoroughly. For fresh water–air fluid, the flow regime basically has linear relationships with void fraction and bubble size. The fluid is basically identified as bubble flow regime when void fraction is lower than 0.3, when most bubbles are small ones and the flow regime is relatively steady. In deep sea drilling, influences of gas dissolution and precipitation on flow regime shall be considered. Wang and Sun 5 made corresponding theoretical and experimental analyses. Since the seabed mud line is the boundary point of temperature changes (temperature in seawater is negatively correlated with depth, while temperature in rock formation is positively correlated with depth), the surrounding areas of the mud line are generally the critical scope of precipitation and dissolution of methane gases.
Current gas kick detection methods are mainly based on pressure in annulus and fluid velocity at well mouth. 6 However, abundant methane gases are very close to the sea level when gas kick causes evident changes of pressure and fluid velocity at the well mouth, which requires urgent treatments and is easy to cause serious accidents like blowout. To make earlier and more accurate gas kick detection, some researchers detected gas kick by setting pressure sensors at down-hole.7,8 Although these methods have advantages in accuracy and timeliness, they are much more expensive. Because long-term experimental verifications are required for additional devices at down-hole would influence the drilling process. Moreover, the complicated environments (e.g. pressure and temperature) at down-hole often lead to extremely high requirements on usage life and high installation costs due to the complex failure mechanisms of devices/components.9,10 With comprehensive consideration to feasibility and cost, the mud line is a reasonable position for gas kick detection in offshore oil drilling. 11 On one hand, the mud line is generally 1500 m away from the sea level and it takes a long time for methane gases to rise from the mud line to the seal level, which leaves adequate time to cope with gas kick accidents. On the other hand, temperature and pressure at mud line are relatively stable, which can provide a relatively stable detection environment for detection devices and reduce influences of environmental interference on detection results as well as manufacturing and installation costs of detection devices. Gas kick detection methods generally can be divided into two types: intervention detection and non-intervention detection. For gas kick detection at mud line, the intervention detection has to destroy the annulus structure and will surely bring high additional costs and risks. Non-intervention detection mainly includes pressure detection, ray imaging detection, ultrasonic detection, and so on. Among them, the pressure detection method is easy to be interfered but with low accuracy. The detection method based on ray imaging must consider costs and environmental protection, which decrease its feasibility. The ultrasonic detection has advantages of non-intervention, low cost, mature technology, and environmental protection. However, the ultrasonic attenuation is very high in drilling mud. 12 Traditional ultrasonic detection methods based on impulse are difficult to obtain effective reflection signals in drilling mud. According to previous experimental and research results, attenuation of drilling mud is too serious to be solved by increasing ultrasonic transmission power only. This will increase volume and cost of devices significantly and may introduce more interference sources. Recently, Zhou et al. 13 proposed a detection method based on continuous Doppler ultrasonic wave to test flow velocity of drilling mud. However, the received signal based on continuous Doppler ultrasonic wave is nonstationary signal which could not be analyzed efficiently based on traditional methods, such as fast Fourier transform (FFT), sparse fast Fourier transform (SFFT), short-time Fourier transform (STFT). Methods based on wavelet are widely studied and have been proved to be more accurate in data processing with nonstationary signals.14–18 The inadequacy of wavelet methods is that additional hardwares and performance are needed. This could be a restriction when only battery supply was provided.
Thus, combining with practical applications in deep sea drilling, the following conclusions could be deduced:
1. Under normal working conditions, flow regime of drilling mud in annulus at the mud line is steady when there is no gas kick.
Because under normal working conditions, the injected drilling mud velocity is steady, while the distance from the mud line to the down-hole is 10 times larger than the pipe diameter. The drilling mud in annulus at mud line shall be relatively steady.
2. Under low fluid velocity, influences of small solid particles on flow regime of drilling mud could be neglected.
Since solid particle shape is generally constant, it will not influence the surrounding fluid. Under low fluid velocity, forces along different directions are approximately stable under steady flow regime. Therefore, influences of small solid particles on flow regime of drilling mud can be neglected when the fluid reaches the steady state.
3. Under small gas kick, the flow regime close to the mud line is stable bubble flow regime.
When there is small invasion of methane gases, that is, the void fraction is small, big bubbles collapse into small ones under the effects of radial forces, and small bubbles scatter around in the space, resulting in the low probability for small bubbles integrating into big bubbles. Under this circumstance, small bubbles distribute in annulus uniformly. At the same time, drilling mud in annulus at mud line is stable bubble flow regime under low constant velocity.
4. Under high gas kick volume, the flow regime is disordered, accompanied with different bubble sizes and different moving directions.
When there is high gas kick volume, distance between small bubbles decreases, which is conducive for integration of small bubbles into big ones. According to experimental results, 1 the instability of big bubble shapes influences running of surrounding fluid seriously, resulting in disorder of flow regime of drilling mud at mud line. The fluid velocity has component parallel to annulus and component perpendicular to annulus.
5. There are big bubbles when there is serious gas kick. Big bubbles concentrate in center, while small ones approach to the pipe wall.
According to viscosity characteristics of drilling mud, the velocity of drilling mud in the center of annulus is higher than that close to the pipe wall. Therefore, flow regime in the center changes earlier than that close to the pipe wall, increasing the probability of forming big bubbles.
The above five points are summary of motion characteristics of drilling mud close to mud line in deep sea drilling. Since characteristics of ultrasonic wave in drilling mud are related with bubble size distribution and flow regime except for the fluid property, these conclusions are important bases for gas kick detection based on ultrasonic wave. Based on this, the propagation reflection law of continuous ultrasonic wave in annulus and drilling mud will be further investigated in this article. Meanwhile, a more accurate fluid velocity and gas kick detection method will be proposed by combining Doppler principle.
The organization of this article is arranged as follows: in section “Gas kick detection methods,” a mathematic model of continuous ultrasonic wave is constructed based on the results of theoretical analysis of the relationship between properties of received ultrasonic waves and different distributions of bubbles in different flow regimes, the destitution of partials velocity, incident angles, reflection angles, distance, and attenuation. In section “Gas kick detection algorithm,” a set of gas kick detection algorithm is introduced, including fluid velocity detection algorithm, void fraction detection algorithm, and the final gas kick detection algorithm. In section “Gas kick simulation platform,” a simulation platform is introduced, which is designed to verify the proposed method and algorithms. In section “Experiments,” experiments results are shown to prove the proposed theory and algorithms are applicable. In section “Conclusion,” the conclusions of this article are drawn.
Gas kick detection methods
Continuous ultrasonic wave
Time information is one advantage of impulse ultrasonic detection compared to continuous ultrasonic detection; the impulse ultrasonic detection can screen information effectively based on time of received signals. For example, when detecting fluid velocity in pipes, it can determine the reflection position of the signal in the pipe according to reception time of signals. This means that most of the noises such as signals reflected near pipe wall, multiple reflections signals, etc, are avoided by time selection. Therefore, impulse ultrasonic detection is used more compared to continuous ultrasonic detection. Nevertheless, continuous ultrasonic wave is superior to impulse ultrasonic wave in gas kick detection. This is mainly because impulse ultrasonic wave is difficult to receive effective reflection signals due to the strong attenuation of ultrasonic wave in mud. Under same ultrasonic transmission power, continuous ultrasonic wave can acquire stronger effective reflection signals.
First, according to propagation characteristics of ultrasonic wave, the reflectivity of ultrasonic wave is related with acoustic impedance of materials at two sides of the interface. Based on experimental data,
11
reception efficiency of effective signals based on impulse ultrasonic wave can be calculated. The annulus is made of steel and its density is

In Figure 1, if the propagation distance of ultrasonic wave in mud is

Attenuation computation.
For continuous ultrasonic wave, pathways of ultrasonic signals reflected by different reflectors are different since there is continuous ultrasonic acoustic field in a large field. As a result, these different reflected signals may be superposed and form a reflected wave with stronger energy. In Figure 2, reflected ultrasonic waves by two reflecting bodies with different reflection angles intersect and superpose at the place of red circle. If frequency phases of two reflected waves are similar, the superposed reflected wave has stronger energy and longer propagation distance. Since the quantity, size, shape, position and motion state of the reflectors in fluid is random, it is difficult to build a general accurate model. However, given abundant reflecting bodies and enough long time, superposed waves with stronger energy will occur according to statistical behavior, which have shown a longer propagation distance than reflected signal of impulse wave, thus overcoming the large ultrasonic attenuation in mud effectively.

Refraction and wave mode conversion.
Emission frequency and angle
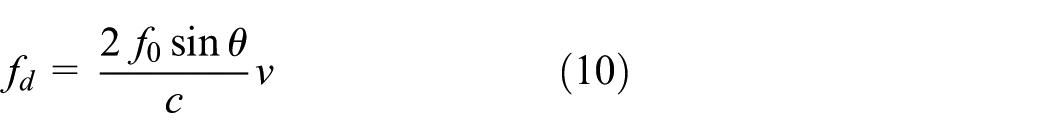
Frequency, emission and reception angles are important factors in fluid velocity measurement based on Doppler Frequency Shift principle. Suppose the incidence angle of ultrasonic wave is

On the other hand, the incidence angle of ultrasonic wave will affect the propagation distance of ultrasonic wave in fluids. Note from Figure 3 that in steady fluid, the propagation path of ultrasonic wave reflected by the same reflector is longer when

Propagation distance and emission angle.
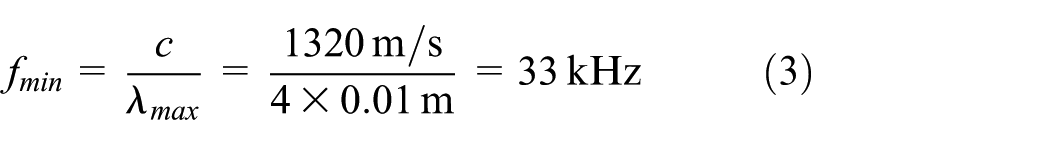
For gas kick detection, ultrasonic attenuation is one of the main difficulties under study. Low-frequency ultrasonic wave shall be chosen to receive effective reflection signals as more as possible. However, lower frequency ultrasonic wave has lower accuracy and requires larger reflectors. Otherwise, no effective reflected signals will be gained. Actually, bubble size distribution is correlated with various factors, such as void fraction, fluid velocity, initial state, fluid viscosity, and temperature. According to experimental observations and empirical estimation, bubble size after full collapse reaches the millimeter level when void fraction in drilling mud is larger than 3%. To protect stable signal output when void fraction in drilling mud is higher than 3%, the 1/4 wavelength of ultrasonic wave used for gas kick detection shall be at millimeter level. Since
The upper limit of the ultrasonic wave frequency is related to the power of the ultrasonic emission sensor, the mud density, the mud recipe, emission angle, and other factors. The higher the frequency, the higher the accuracy. However, measurement is on the base of received signal.
Traditional model generally does not use vertical incidence (

The ultrasonic acoustic field emitted by the ultrasonic transducer is actually in a fan shape with small divergence angle (Figure 4). The reflection angle of ultrasonic wave is changing continuously during the small bubble rise in the continuous ultrasonic acoustic field,

Reflection of bubbles at different positions.
In reality, different reflection angles determine the relationship between amplitude of reflected signal and frequency. It can be seen from Figure 3 that two reflectors with same velocity v produce two different echo signals (
Wave mode conversion and lamb wave
Wave mode conversion
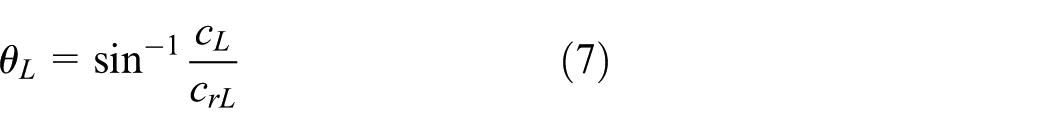
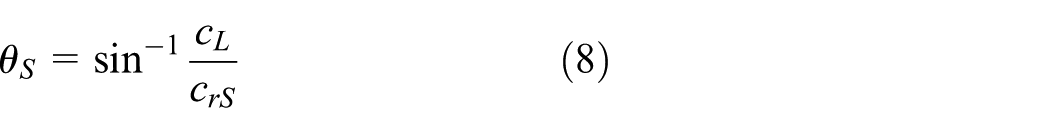
Based on the wave propagation theory there are not only wave refraction and reflection, but also wave conversion when the ultrasonic enters into the interface of two different materials through oblique incidence with a certain angle, as shown in Figure 5.

Refraction and wave mode conversion.
Moreover, no transverse wave exists in the fluid. Thus, the spread speed of the longitudinal wave of the ultrasonic in the drilling mud is


If
According to the experimental measurement result, the spread speed of 64 K ultrasonic in drilling mud with a density of
Lamb wave A0
This could be further illustrated by the related theory of lamb wave. In elastic medium, Rayleigh–Lamb equation is21,22
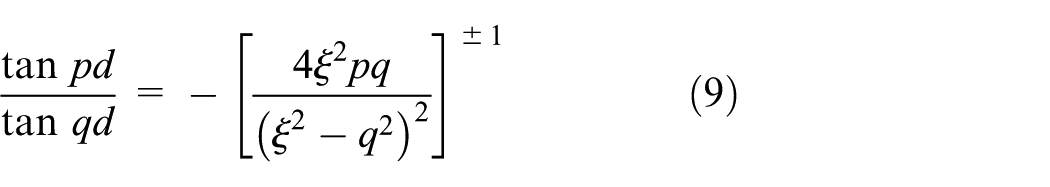
where

Velocity components and probability model
Radial motion of fluid is an important parameter to judge whether it is a steady fluid. In theoretical model of fluid, assuming that steady fluid has no radial motion and only has the velocity component parallel to the pipe. The motion of unsteady fluid is very complicated. It has both parallel velocity component and vertical velocity component. In Figure 6, velocity of the unsteady fluid is decomposed in the cylindrical coordinate system. On the cross-section plane of the pipe, the velocity component

Velocity components in unsteady fluid.
Therefore, the reflected ultrasonic Doppler frequency of different flow regimes is influenced by superposition of different velocity components. Three models were established in the following sections.
Steady flow regime (without rotations)
When the fluid is in steady state without any rotation, the particles in the fluid have no radial motion approximately. Steady fluids include laminar flow, steady bubble flow regime, and so on. In these fluids, Doppler frequency is correlated with fluid velocity directly. The model of steady fluid is introduced in section “Emission frequency and angle.”Equation (2) can be rearranged as
For steady fluid regimes, radial position of ultrasonic reflector in the fluid is relatively fixed and it can be viewed that the reflector passes through the ultrasonic acoustic field at a constant rate. In Figure 4, the variation range of

Equation (10) reveals that ultrasonic frequency, fluid velocity, and ultrasonic acoustic velocity are contributed by solids. Thus, the received ultrasonic shift

The measured frequency differences have both positives and negatives, which is caused by the simultaneous entering of different reflectors into the ultrasonic acoustic field. The mud flow direction is determined in the annulus. In this article, the absolute value of ultrasonic shift is applied to simplify the model (the following analyses use positive shift). Therefore

If the distance between the reflector and the pipe wall is d (Figure 3), the propagation distance before the reflected wave entering into the pipe wall is

If the amplitude of ultrasonic wave before the reflection is
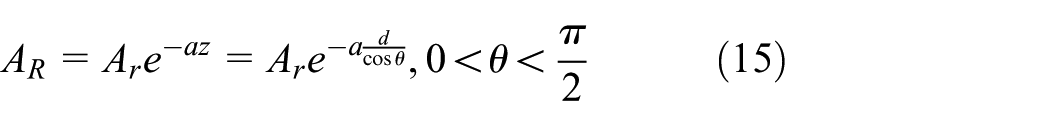
On the other hand, reflector distribution in steady fluid is relatively stable (e.g. in steady fluid, small bubbles approach to pipe wall, but big bubbles tend to concentrate in pipe center2,3). Suppose the energy for ultrasonic wave penetrating the pipe wall and entering into the fluid is

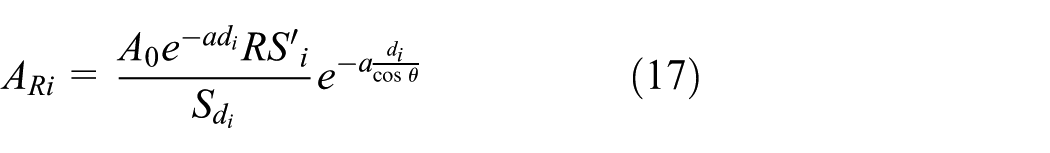
Combining equation (15) and the relationship between received ultrasonic signal and initial amplitude of the transmitted wave could be concluded
The reflector distribution in viscous steady fluid is linear due to the higher velocity at center. In other words, there are more reflectors as approaching to the pipe center. However, there is now determined authority conclusion on the specific distribution law. Furthermore, this article used drilling mud as the final research object, in which the propagation distance of ultrasonic wave is very short. Suppose that the positions of reflectors in the steady fluid is follow a uniform distribution. The probability density function of any reflector is

where

where

Due to the randomness of reflector position and occurrence time, the ultrasonic acoustic field is not always steady, indicating that equation (20) could not get universal definite results. For instance, the whole acoustic field will be reflected completely when there is a bubble with diameter larger than width of the acoustic field. In other words,
For a given fixed acoustic field, received signal strength of any reflector shows monotone decreasing with the increase of

where
Since ultrasonic attenuation in drilling mud is very large and the ultrasonic acoustic field scope is small, this article hypothesizes that the reflector positions in this acoustic field obey to the uniform distribution. In other words, the mean

Actually, equation (20) represents the total signal that the whole pipe could be received. However, only few signals could be detected in actual measurement due to limitations of size and position of receiver sensors. Based on the large ultrasonic attenuation in mud, the parts with reflection path larger than twice of

Suppose the ultrasonic acoustic field is steady, then
Steady flow regime (with rotations)
When fluids in a round container reach the steady state and move circularly along the cross-section, the circling motion velocity will affect the Doppler shift. Note from Figure 7 that velocity component of reflectors along the tangent to periphery also has velocity component on the reflection path of ultrasonic wave, thus enabling to produce Doppler shift. Since width of the ultrasonic acoustic field is often far smaller than the diameter of circling motion, this velocity component is very small, indicating that the corresponding Doppler shift is small. Since the velocity component on the reflection direction of ultrasonic wave could not be measured for the moment, the Doppler shift component produced by rotation will be superposed to the received signal of steady fluid model without rotation. The fluid with small rotation velocity can be viewed approximately equal to steady flow regime without rotations.

Velocity component in unsteady fluids.
Unsteady flow regime
The reflector velocity and direction in unsteady fluid are highly random. It is necessary to acquire distribution law of these random parameters before modeling. However, there is no universal authority conclusion on unsteady fluid (e.g. turbulence) model. State of these unsteady flow regimes is closely related with initial conditions, environmental factors, and loading variations in actual situations, such as degradations and variations of stress amplitudes.26–28 In gas kick detection, it is unnecessary to test the unsteady liquid velocity accurately. Since solid and fluid are basically incompressible and difficult to be they have small effect on flow regime transformation. While gas has a great impact on flow regime for its compressibility and shape variation. Hence, it can determine that gas kick occurs when unsteady flow regime is detected.
Although unsteady flow regime has strong randomness, the reflection model of ultrasonic wave and the model in the steady fluid are same at a certain moment, but they have no statistical law of uniform distribution any more in a certain period. Steady of flow regime could be determined by detecting instability of received signal frequency spectral shape.
Distinguishing between solid-phase and gas-phase reflectors
In petroleum drilling process, drilling mud plays an important role in bringing rock fragments to the drilling platform to ensure the normal service of drilling. Under actual working conditions, drilling mud contains lots of rock particles. Both solid particles and bubbles can generate Doppler effect in fluid. Therefore, it is unreliable to detect gas kick rely on the amplitude of the received ultrasonic wave signal alone. In theoretical model, solid-phase and gas-phase reflectors have some differences:
Different ultrasonic reflectivity R: air density is about
Different shape: the shapes of rock fragments are strongly random, accompanied with multiple edge angles and rough surface. Air supply is continuous due to the influence of surrounding liquid pressure. Particularly, pressures along different directions in steady flow regime are stable and the bubbles are approximately spherical. Since solid particles have discontinuous shapes, the corresponding
Different masses: the velocity directions of rock particles and air are different, because the rock particle density is higher than the mud density and air density is smaller than the mud density.
Different deformation features: rocks are solids and rock particles in mud have fixed shape under normal conditions, while the air shape changes quickly upon the stress.
Based on difference A, rocks and bubbles could be distinguished by the amplitude of received ultrasonic signals. This requires calibration under same conditions in advance. Based on difference B, the dispersion degree of amplitude variation could be calculated by monitoring variation range of each frequency point under same fluid velocity, which could be used to distinguish solid-phase and gas-phase reflectors. It also requires calibration in advance. The prerequisite to distinguish solid phase and gas phase based on C is that the flow velocity of drilling mud is known, which is very difficult in reality. The difference D is one of the important reasons for different influences of gas and solid on flow regime, so the solid-phase and gas-phase reflectors could be distinguished by variations of flow regime.
Gas kick detection algorithm
Fluid velocity detection algorithm
Equation (21) reveals that Doppler shift has a certain relationship with the amplitude. The weighting coefficient is related with the natural logarithm e except for the sin function. Processing of received signal frequency spectra is mainly divided into two steps: one is calculating weighting coefficients of different frequency points in the frequency spectral range and the other one is processing frequency spectral amplitude by the natural logarithm e. The specific algorithm steps are as follows:
Calculate the maximum theoretical frequency difference
Design corresponding digital low-pass filter based on
Make frequency transformation of
Get the corresponding power spectrum of background noise (
According to the frequency range of power spectrum, generate the corresponding weighting coefficient of
Calculate result


Let
Correct results according to abundant experimental data and standard flowmeter data M, obtain the corrected parameter
The calculation of

Step 7 is based on the steady fluid model, when the angle of reflection is a uniform distribution. Therefore, the fluid velocity is calculated by the mean angle of reflection. Measured ultrasonic acoustic velocity will have certain errors, which is related with different experimental environments, resulting in the difference between theoretically calculated results and actual results. As a result, results shall be corrected by abundant experiments, getting corresponding corrected parameters.
Detection algorithm of void fraction
Void fraction could be detected by amplitude of received signal frequency spectrum according to equation (22). In practice, it is greatly difficult to calibrate
Construct the experimental platform for gas kick simulation. This platform can control void fraction by quantitative injection of methane gases and mud velocity simultaneously.
When no gas is injected (void fraction = 0), the received signal frequency spectra under different fluid velocities v are recorded
Inject a certain amount of gas and let the void fraction =
Increase the gas injection to increase void fraction every
Calculate the effective frequency spectra with influences of environmental factors eliminated

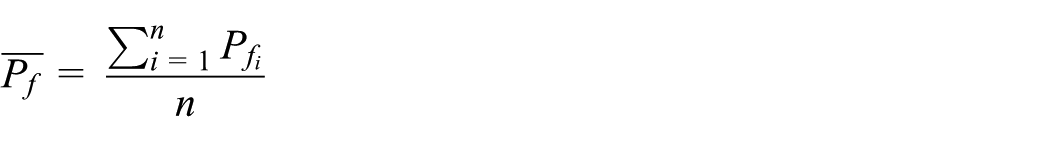
Calculate the frequency spectral mean as the final effective value

Repeat the experiment for M times (Steps 2–6), getting the M frequency spectral means under different void fractions:
Process M frequency spectral means according to the error theory, getting
The fitting curve parameter of
Gas kick detection methods
Based on modeling and analysis results in section “Gas kick detection methods,” this article detected gas kick mainly from two aspects. One is to make preliminary judgment on gas kick according to variations of received signal amplitude and fluid velocity. The other one is to recognize changes of flow regime according to shapes of received signal frequency spectra, thus confirming the results. Specific steps are as follows:
Under normal working conditions without gas kick, the received signal frequency spectra are tested
The signal within m seconds under normal condition is acquired, then it is divided into n segments (m > = n). Based on signal frequency spectrum conversion of each segment, the judgment threshold (
According to technological process of the drilling platform, the variation threshold of mud velocity in annulus (
Based on experimental results of the simulation platform, the empirical parameter (
According to the fluid velocity detection algorithm in section “Fluid velocity detection algorithm,” the mud velocity
When
Void fraction is tested based on the void fraction detection algorithm. If
Repeat Step 2 to calculate the recognition threshold
In Step 5, the mud velocity and amplitude mean of frequency spectra are detected every s second in order to solve power consumption problems of the gas kick detection device. Under the original drilling technology, gas kick detection at mud line is powered by the battery only and interval detection can reduce the overall power consumption of the device to a large extent. Moreover, the mud line is often over 1000 m below the sea level and fluid velocity detection involves the power supply problem. This algorithm aims at battery supply method.
Judgment of flow regime in Steps 2 and 8 can be accomplished by many methods based on pattern recognition, including machine learning and neural network. Limited by processing capacity of the detection device and real-time demands, error method and correlation detection method which have low requirements on processing capacity were applied in this article. It can be determined from the gas kick model and analyses on unsteady and steady fluid models in section “Velocity components and probability model” that flow regime in annulus will change from steady one to unsteady one when gas kick occurs and reaches to a certain extent. This phenomenon can be used as one important basis of gas kick detection. The major difference of frequency spectra between unsteady flow regime and steady flow regime lies in the different statistical characteristics of frequency spectral amplitude. This is caused by different probability distribution patterns of reflector velocity and position.
Error method
Variations of flow regime are determined by dispersion degree of amplitude changes of frequency spectra at different frequency points. Specific steps are as follows:
Implement frequency spectrum conversion of n segments of signals, getting
Calculate amplitude mean of each frequency point
Calculate variance of each frequency point
Substitute
Correlation detection method
Make frequency spectrum conversion of n segments of signals, getting
Divide

Select one segment
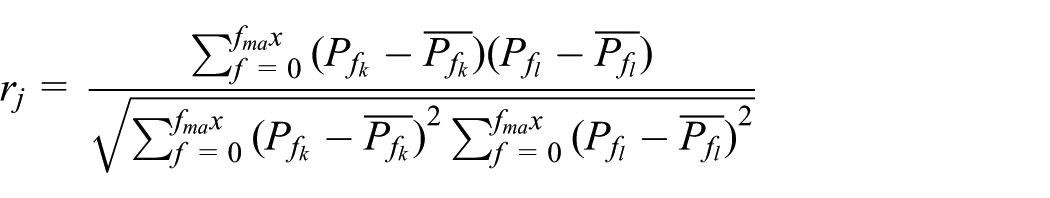
Repeat Step 3 and get
Gas kick simulation platform
The gas kick simulation platform is designed to simulate actual situations of drilling mud in annulus at mud line. The structure is shown in Figure 8. The whole platform is composed of main pipe, mud injector, methane gas injector, and detection device.

Structure of the gas kick simulation platform.
The main pipe consists of a segment of closed circulating pipe, driving motor and blade and deflector. Besides, thermometer, pressure gage, and flowmeter are installed on the pipe. The main pipe is the important place of simulation experiment. The cooperation between the driving motor and transducer can generate different thrust, thus controlling mud velocity in the pipe. The deflector is used to filter mud disturbance by motor blade, avoiding disorder of flow regime in the measurement segment. The thermometer and pressure gage are used to measure environmental parameters, while the intervention flowmeter is used to calibrate mud velocity.
The mud injector consists of air compressor, mud tank and mud recycling tank, and the balance piston
The methane gas injector consists of high-pressure nitrogen cylinder, natural gas cylinder, and piston
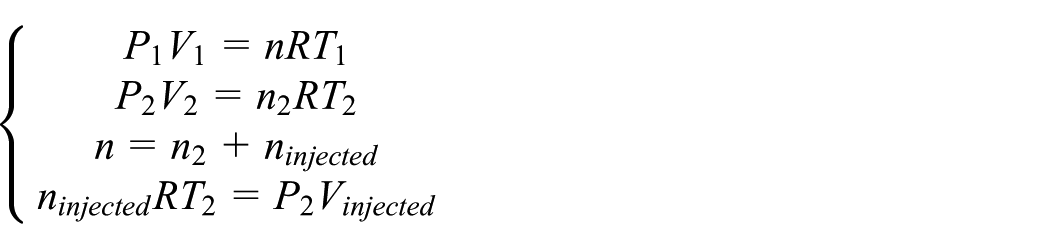
The steps to quantitative gas filling are as follows:
1: Close all the valves, monitor pressure
2: Open F15, F6. Use regulator value F2 to inject gas from N1 to P1.
3: When the pole was extended fully, close F6 and F15. Then get
4: Open F14, F1, then the methane gas will be injected into the main pipe by the high pressure from N2, when finished close F1 and F14. Get the final data
Then, the injected methane gas can be calculated as follows


The detection device mainly consists of sine wave generator, transmitter and its drive circuit, receiver and correction detection circuit, signal acquisition card, and PC. First, a 64 kHz signal is generated by the sine wave generator and then is amplified to drive the transmitter to send ultrasonic signal, followed by correlation detection through the matching echo signal received by ultrasonic receiver and the generated signal. The detected signal covers the frequency difference between echo signal and transmitted signal. The differential signal is passed through a low-pass filter and acquired into PC by a signal acquisition card for analysis.
The physical structure of gas kick simulation platform is shown in Figure 9. There is another fresh water experimental facility with the same principle. Due to the poor transparency of mud, it is impossible to observe real situations in mud; some experiments have to be observed and verified in the fresh water platform, which is conducive to analyze phenomena and problems in mud experiments.
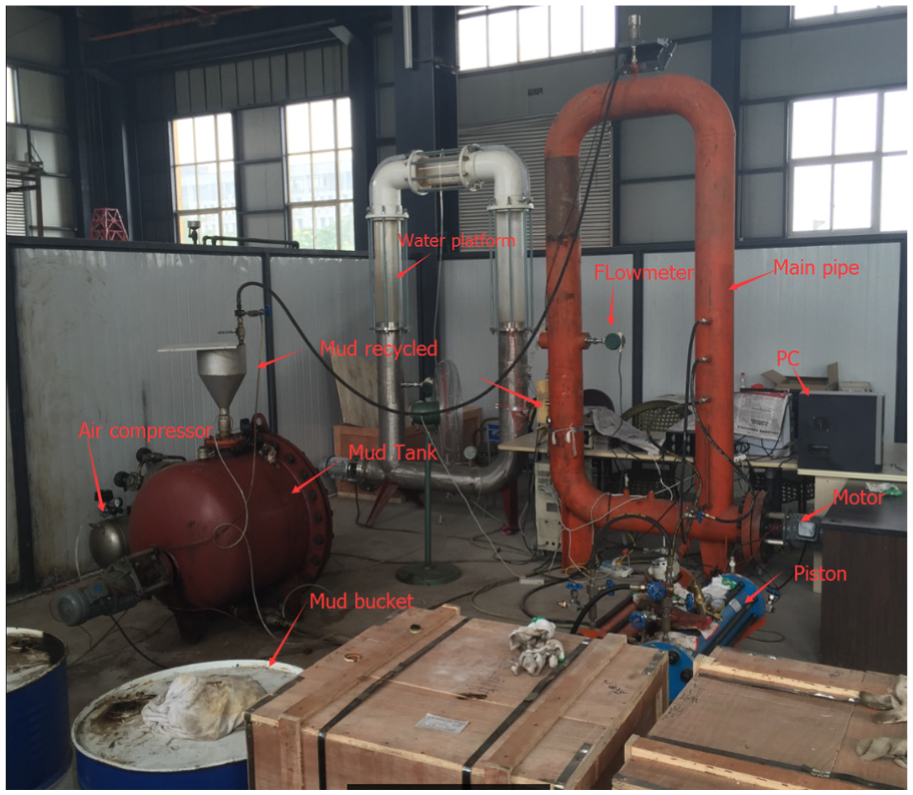
Gas kick simulation platform.
Experiments
In the whole experimental process, the signal sampling frequency, ultrasonic transmitted signal frequency, and signal driving voltage were set to be 80 kHz, 64 kHz, and 75 V. After the received signal is amplified and filtered, amplification and filtering parameters are kept constant in the comparative experiments. Mud density, apparent viscosity, and plastic viscosity of mud in the experiments were determined to be
Lamb wave and method validation experiment
Different from traditional ultrasonic flowmeter, the proposed method is based on lamb wave detection. Hence, an experiment was designed first to verify the existence of lamb wave.
In Figure 10, one end of the steel pipe was sealed up, so the steel pipe became a container. Fresh water was added into the steel pipe, while mud and acoustic materials (plastic foams) were used to analyze ultrasonic characteristics of the pipe. Experimental results are shown in Figure 11.

Empty pipe experiment.

Results of empty pipe experiment.
To eliminate the influences of lamb wave propagated through the pipe wall, the transducers are under water. The experiment result is that there is no retrieved signal when the pipe is empty. When the added water is close to the ultrasonic transducer, the received signal amplitude increases significantly and reaches the maximum when the container is filled with water, indicating that some ultrasonic wave passes through fresh water and arrives at the transducer. When acoustic material is inserted into water in the pipe, the received signal amplitude decreases significantly. The higher the intervention depth of the acoustic board, the smaller the received signal amplitude will be. Similar results were achieved in the mud experiment. This experiment verifies that lamb wave is generated upon the incidence of fluids in the pipe to the pipe wall.
In the experiment process, this can be verified by variation of transducer positions. The traditional ultrasonic detection device has strict requirements on the installation position of the transducer. There is no specific requirements on receiver and transducer in this article. In this experiment (ultrasonic frequency = 64 kHz, mud density = 1.1 g/cm3, and the driving voltage peak of transducer = 75 V), the receiver can receive effective signal carrying the frequency difference information when the distance between the receiver and transducer is controlled within 1 m and there is no point of weld between them. Due to the large ultrasonic attenuation in mud, the received signal cannot be the direct incidence signal of mud when the distance between the receiver and transducer is longer than 0.1 m. This further verifies the existence of lamb wave in pipe wall.
The accuracy of the proposed method could not be proved since the mud could not be observed directly. It is verified first in the fresh water experimental platform. At the same time, driving water flow by blade in the pipe will surely produce bubbles. To eliminate influences of these bubbles, environmental noise, and motor on signals, the proposed method was verified using plastic beads as reflectors. It can be seen from Figure 12 that the received ultrasonic signal has continuous variation of frequency and amplitude when the plastic bead passes through the transducer. When the plastic bead departs from the transducer, the signal recovers to the steady state, which confirms that the detection method based on continuous non-directional ultrasonic wave is effective.

Experiment with plastic balls.
Fluid velocity experiments
Water experiment
Variations of flow regime, bubble size, and content in fluids could be observed clearly in water. The fresh water experiment is an important step to verify and optimize the proposed method. In Figure 13, the fluid velocity is about 0.07 m/s in the intervention flowmeter when the transducer power is 5 Hz. Under this circumstance, the signal waveform is relatively stable and low-frequency component is the main component of frequency spectrum, while frequency amplitude (>100 Hz) and the background noise are equivalent. It can be seen from the transparent observation window that water flows at a stable and slow velocity, but basically no visible bubbles are found in water. Since some gas bubbles are adsorbed on the pipe wall, they come into running water randomly. Under such condition, the received signal waveform and frequency spectra are relatively stable. However, the occasional big bubbles cause continuous changes of the maximum Doppler shift component, thus increasing the measurement error.

Experiment result when water velocity of 0.07 m/s.
Under high flow velocity, bubbles in water increase, showing bubble flow regime. Since there are many bubbles and positions are random, the received signal presents strong randomness. In Figure 14, the water flow velocity reaches 0.42 m/s when the transducer is adjusted to 40 Hz. Evident random characteristics are seen from signal waveforms. The high-frequency component amplitude in the frequency spectrum is significantly higher than that when the water flow velocity is 0.07 m/s and the shift components (>100 Hz) are all higher than 30 dB. Such frequency spectral variation is consistent with the continuous ultrasonic reflection model results. This is the theoretical evidence of validity of the proposed method.

Experiment result when water velocity of 0.42 m/s.
Based on 10 groups of experiments, the Doppler shifts measured by the proposed method when the transducer frequency increases from 5 to 50 Hz are shown in Figure 15. On the whole, the measured shift presents a linear increasing trend. The detection result has big errors at low frequency, which is attributed to the occasional big bubbles. Under high flow velocity, the flow regime in the pipe is extremely instable and bubble distribution and size are strongly random along the motion direction. Bubble behaviors under this circumstance could not be equivalent to uniform distribution any more, decreasing flow volume under high flow velocity and increasing the error accordingly.

Doppler shift frequency result calculated with proposed method.
High error data at two ends which are determined by fitting parameters are neglected, because the proposed method is based on the uniform distribution. The final calculation formula of fluid velocity is gained by the second-order curve fitting as

The comparison between final detection results and flowmeter results is shown in Figure 16. The maximum error is smaller than 15% and the measurement error range is close to the range of flowmeter results.

Comparison between results of proposed method and flowmeter results.
Mud experiment
Flow velocity experiment
In mud experiments, no effective signal is detected, because there is no mixed gas in mud. Hence, the following fluid velocity detection experiment was accomplished when the void fraction was kept 3.6% by injecting a certain quantity of nitrogen. When the transducer frequency is lower than 10 Hz, the mud velocity is relatively low and it could not mix gases at top of main pipe into the mud, thus failing to detect effective signals. When the mud velocity is 0.18 m/s, only few gases are brought into the mud. It can be seen from Figure 17 that the received signal amplitude is relatively small. However, gases at top of the annulus are almost mixed into the mud when the mud velocity is higher than 0.6 m/s, resulting in the high received signal amplitude which is shown in Figure 18. On the frequency spectrum, the mud experimental results are similar with water experiment. The amplitude of low-frequency component is always higher than that of the high-frequency component. Besides, the amplitude of high-frequency component increases with the increase of flow velocity.
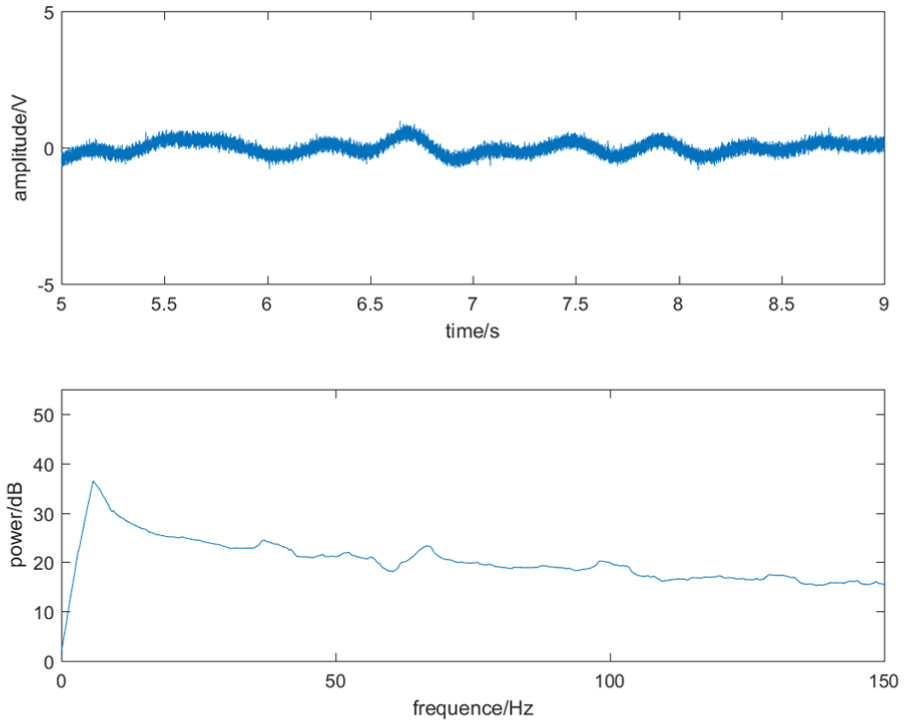
Experiment result when mud velocity is 0.18 m/s.

Experiment result when mud velocity is 0.69 m/s.
The Doppler shifts calculated by the proposed method in the mud experiment are shown in Figures 19 and 20. Results are similar with that of water experiments. The calculated Doppler shift achieves a linear growth with the increase of velocity. Meanwhile, the measurement errors at low frequency and high frequency are relatively big.

Doppler shift frequency result calculated with proposed method.

Comparison between results calculated with proposed method and flowmeter results.
The relationship between frequency difference and flow velocity can be gained by the second-order curve fitting (equation (26)). The comparison between finally calculated results and flowmeter results is shown in Figure 20. The maximum relative error is <9% and the absolute error of calculated results is relatively big, especially under high flow velocity. This has two reasons: one is that the proposed method is inapplicable to when flow regime is unstable under high flow velocity. The other one is that a steady high-level filtering algorithm is inbuilt in the standard flowmeter, making it adapt to fluid velocity detection in unsteady fluid

Void fraction experiment
In gas kick simulation platform, natural gas is injected at middle of annulus and mud is discharged to piston at the bottom, realizing experimental conditions for fixed void fraction. Since mud is fluid and incompressible, the discharged mud volume could be measured accurately by measuring the extended role length of piston. The discharged mud volume is total volume of methane gases in annulus. Since gases at top of annulus could not be mixed completely into mud under low velocity, experimental data are all collected under 30 Hz of the transducer (0.49–0.81 m/s).
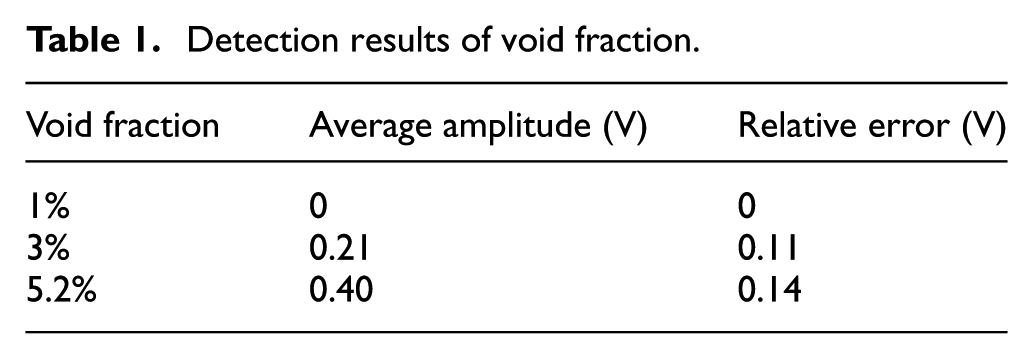
When the measured signal amplitude is twice smaller than the background noise signal, this signal was viewed as invalid. Calculated results of void fraction in 10 groups of experiment are listed in Table 1. When void fraction is smaller than 3%, it is impossible to detect continuous effective signal. Continuous effective signal can only be detected when void fraction is close to 3%. Meanwhile, the signal amplitude increases with the increase of void fraction. It has to note that results in Table 1 were tested in 2 min after the mud was put static for a certain period and the mud circulation was started. Since the mud is mixed completely with gases gradually, bubbles will collapse continuously and the signal amplitude will decrease as the mud circulating continues, thus decreasing calculated results of void fraction.
Detection results of void fraction.
Gas kick simulation experiment
Solid particles could not be added on the gas kick simulation platform to simulate rock fragments due to the platform design, which is against to determine amplitude threshold and velocity threshold in the proposed method. Therefore, it is impossible to accomplish an integral experimental verification. We designed an experiment to simulate gas dissolution and precipitation and verified the validity of the proposed gas kick detection method from the perspective of void fraction.
The experimental process is as follows:
The annulus is filled with mud first and then methane gases are injected to discharge mud to the piston, maintaining the void fraction at about 8%. With the resistance of piston movement, the pressure in annulus is about 0.5 MPa.
Compress the piston by the high-pressure nitrogen cylinder to make mud in piston rejected into annulus. Under this circumstance, gas bubbles in the annulus are compressed, so the void fraction decreases and the amplitude of received signals decrease continuously.
Considering the positive correlation between methane solubility in mud and pressure, methane gases begin to dissolve in mud, resulting in continuous reduction of void fraction and thereby the signal amplitude.
Stop compression when no effective signal is detected.
Make a reverse experiment on precipitation of methane gases. In other words, the piston pressure is released to make mud return to the piston from annulus. At this moment, gases begin to be precipitated and bubbles are produced. Void fraction increases and the detected signal amplitude increases accordingly.
Experimental results are shown in Table 2. Solubility of methane gases in mud is limited and both dissolution and precipitation cost long time. High pressure is needed to keep void fraction at 0 for a long time, that is, to mix gases into mud completely. The maximum pressure used in the experiment was15 MPa, which still failed to dissolve gases completely. The void fraction was about 0.5%. Therefore, data higher than 2.5 MPa in Table 2 are neglected. When the pipe pressure increases to 2.5 MPa, the void fraction in annulus is about 1.2%, where no effective signal is detected. When the pipe pressure decreases to 1.5 MPa, the void fraction exceeds 3% and strong signal is detected. This is consistent with experimental results of void fraction.
Detection results of void fraction.

Methane gas morphology and volume changes in the rise process in deep sea are simulated in the dissolution and precipitation experiment. According to detection results, the proposed method can recognize gas kick effectively when the void fraction caused by gas kick is higher than 3%.
Conclusion
Non-intervention gas kick detection based on ultrasonic wave at mud line can solve gas kick detection problems in deep sea drilling with a low cost. By analyzing the non-directional Doppler principle of continuous ultrasonic wave in annulus, a gas kick detection method based on lamb wave detection is proposed. Meanwhile, a continuous ultrasonic detection model of steady flow regime based on a uniform distribution is constructed. Some conclusions are drawn according to water and mud experiments:
Most signals received by the receiver from the pipe wall are lamb wave. Lamb wave is formed by reflected ultrasonic wave in mud on the pipe wall.
The signal frequency spectrum of Doppler shift is consistent with theoretical model results. The low-frequency component maintains high content, while the content of high-frequency component increases with the increase of velocity.
The proposed method can detect changes of void fraction and gas kick when void fraction is higher than 3%.
The proposed method can detect mud velocity. The relative error between detection results and flowmeter results under steady flow regime is smaller than 10% and the detection accuracy is lower than 9%, which is close to intervention flowmeter.
Footnotes
Academic Editor: Dong Wang
Declaration of conflicting interests
The author(s) declared no potential conflicts of interest with respect to the research, authorship, and/or publication of this article.
Funding
The author(s) disclosed receipt of the following financial support for the research, authorship, and/or publication of this article: This work is supported by National Science and Technology Major Project of the Ministry of Science and Technology of People’s Republic of China (no. 2011ZX05026-001).