
Abstract
Ground deformation, which is a common consequence of surface loads, construction activities, subterranean cavitations, soil subsidence, and so on, poses a serious threat on buried pipelines in the vicinity. Aiming at the influence of ground deformation on continuously welded underground pipelines, this article presents a real-time technique for pipeline health monitoring using wireless micro-electro-mechanical system inclinometers. Based on the multi-point inclination measurements, a strategy is proposed to achieve the two-level target: (1) detection and localization of the abnormal event and (2) estimation of pipeline flexural deflection in virtue of the elastic foundation beam model and cubic spline interpolation. Numerical studies are carried out to investigate the applicable conditions of the strategy and the influence of sensor placement and measurement error on the estimation accuracy. Field testing is finally conducted on a 24-m buried steel pipeline to validate the effectiveness of the proposed method for safety monitoring of the pipeline subjected to ground deformation.
Keywords
Introduction
As a major lifeline infrastructure to deliver water, gas, and other energy media, pipeline plays an important role in modern society. For the convenience of distribution and construction, most pipelines are buried underground. Ground deformation, which is a common consequence of surface loads, construction activities, subterranean cavitations, soil subsidence, and so on, poses a serious threat on buried pipelines in the vicinity.1–3
A significant feature of the influences that ground deformation brings to the pipelines is the superposition of longitudinal bending. The flexural deflection is a key performance index for safety evaluation of the buried pipelines. Linear variable differential transformer (LVDT) is widely used for displacement measurement of a beam-like structure, but the installation of LVDT onto underground pipeline is extremely difficult. Some laser or vision-based non-contact techniques4,5 are recently developed to measure structural deflection, but they are either unsuitable for underground application or have to interrupt the regular service of pipeline. A conventional way to monitor uneven settlement of pipelines in practice is to place pipe deflection indicators at critical locations for leveling process and then evaluate pipe stress based on various mechanical models. Limura 6 developed three formulae to estimate the stress in the pipeline using the discrete leveling measurements. To improve the accuracy of pipe stress estimation, some researchers7,8 take the measurement error into account when the deflection equation is derived by a non-iteration numerical algorithm. Despite all these efforts, this method requires large numbers of the deflection indicators, which costs intensive labor for leveling practice and usually leads to low identification precision.
Regarding this, some novel methods are proposed for geotechnical applications specifically aiming to permanent ground movement. Fiber optic distributed sensors (FODSs) have been increasingly used in geotechnical engineering for their particular advantage allowing the monitoring of a desired parameter along the optical fiber and achieving a truly continuous measurement. 9 Some FODSs for strain measurements, like Brillouin Optical Time Domain Reflectometry/Brillouin Optical Time Domain Analysis (BOTDR/BOTDA) or SOFO, have been developed for health assessment of pipelines due to ground movement or deformation.10–12 However, this technique is usually applicable to a new constructed pipeline project since the sensing fiber has to be installed in a distributed way. Interferometric synthetic aperture radar (SAR) technology has been developed to monitor small ground movements over vast geographical areas. But this technique is unsuitable to monitor small-scale pipelines subjected to soil deformation for its low measuring precision. 13
Aiming at the influence of ground deformation on continuously welded underground pipelines, this article presents a real-time technique for pipeline health monitoring using wireless inclinometers. Based on the multi-point inclination measurements, the strategy for detection and location of the abnormal ground deformation is proposed. The flexural deflections are derived based on the elastic foundation beam model for the estimation of pipeline behavior. Numerical simulation and field testing are conducted to investigate the effectiveness of the proposed method.
A pipeline SHM system using wireless inclinometers
Different from the traditional way by placing pipe deflection indicators for artificial level check, an integrated pipeline health monitoring system is proposed using wireless inclinometer. As shown in Figure 1, the inclinometers are attached onto the top surface of the pipeline and connected to a local remote terminal unit (RTU) via cables. By employing wireless transmission techniques (GPRS, ZigBee, or 3G), the data can be instantly uploaded to the database in management center for pipeline health monitoring and safety evaluation. This system is expected to work as a subsystem integrating to gas or water SCADA (Supervisory Control and Data Acquisition System) for management of municipal facilities. The wireless inclinometer developed in our laboratory using micro-electro-mechanical system (MEMS) technique has been calibrated to achieve high measuring precision of 0.005°.
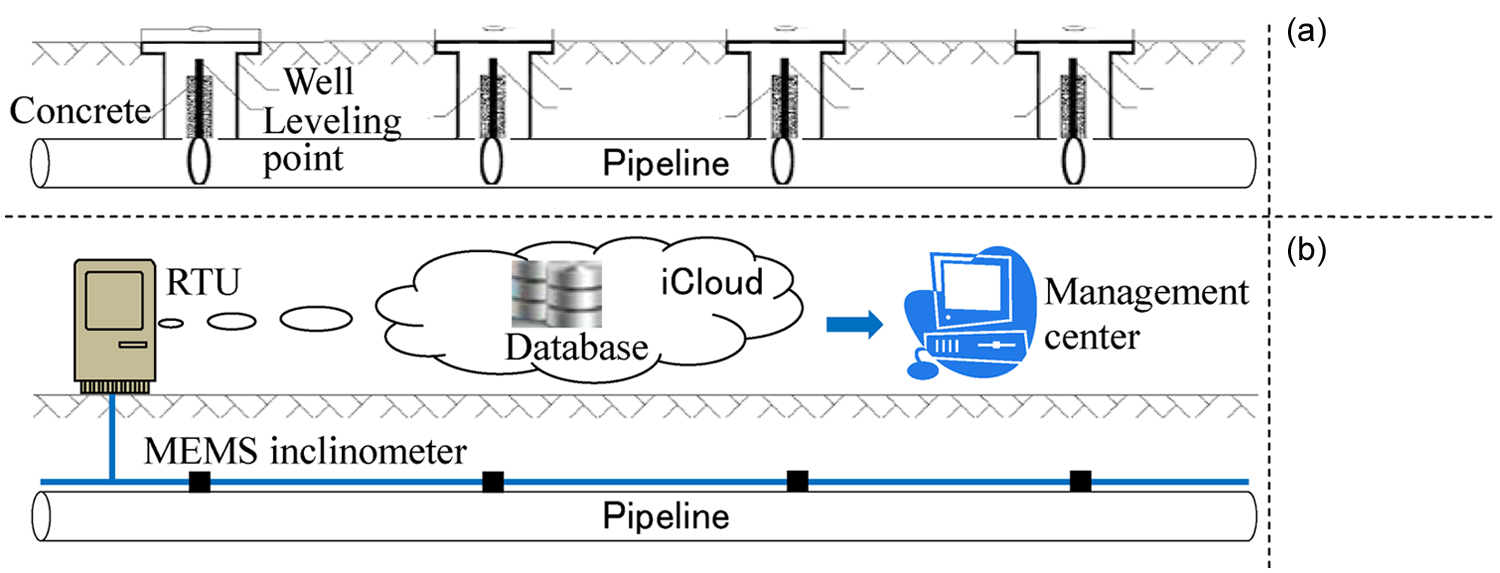
Comparison of the two methods for pipeline deflection monitoring: (a) traditional level check and (b) proposed method using MEMS inclinometer.
Compared with the traditional leveling method (Figure 1(a)), the proposed pipeline Structural Health Monitoring (SHM) system (Figure 1(b)) using wireless inclinometers has many advantages: (1) the traditional leveling method usually costs intensive labor and gets a low measuring precision for manual operation while the inclinometer can be easily installed onto the buried pipeline and achieve a high-precision real-time measurements automatically; (2) leveling method can only measure the settlement of the pipeline, whereas the dual axis inclinometer is able to measure the vertical and lateral deformation simultaneously, which is particularly significant in the case of nearby foundation pit excavation; (3) more important to quantitatively evaluate the effect of soil deformation on the pipeline, the accuracy of deflection identification based on the integral of high-precision inclination measurements is much better than the direct fitting by means of the leveling data.
Deflection estimation method
Elastic foundation beam model for underground pipeline
For a typical continuously welded pipeline, it is reasonable to assume that the pipe segments and the butt welds have the same material properties. A two-dimensional elastic foundation beam model is hereby employed to simulate the underground pipeline, as shown in Figure 2. The elastic foundation is treated by applying a series of longitudinal and vertical springs to the beam model. It is worth noting that this model only uses the inclination measurements around z axis to identify the vertical deflection (y). In a similar way, the lateral deflection (z) can be determined using the inclination measurements around y axis.

Elastic foundation beam model.
The deflection (y) of a beam over the length (x) can be written in terms of the inclination (θ)

Here, C is integration constant determined by boundary conditions. For an infinite beam model on elastic foundation, the deflection of the pipeline can be regarded as zero if the distance from the abnormal event is far away enough, which can be used as boundary conditions to determine the constant C.
Inclination fitting and deflection identification
Based on the multi-point inclination measurements, safety monitoring of underground pipeline subjected to ground deformation is supposed to achieve two-level targets: (1) detection and localization of the abnormal event (e.g. surface load, construction activity, ground settlement) and (2) estimation of pipeline deflection. Since the load pattern is unpredictable and so as the response pattern, numerical interpolation is a common method to reconstruct the inclination curve using the multi-point measurements, based on which the deflection curve can be determined according to equation (1). Considering the inclination function S(x) for a beam under various load patterns is normally cubic or less, cubic spline interpolation is employed here to derive S(x), which is briefly introduced as follows.
Regarding the knots xi (i = 1, 2, …, n), it is known that S(xi) = θi for the inclination measurements and meanwhile assume

with hi = xi − xi−1.
The double integrals of equation (2) with the known boundaries (S(xi−1) = θi−1; S(xi) = θi) lead to

As

where

Considering the actual mechanic behavior of a pipeline, it holds

Its physical meaning is that the first and last two sub-ranges are subjected to the exactly same additional load, which is a reasonable assumption for buried pipelines since the abnormal event is usually localized. According to equations (6) and (3), two more equations can be included as follows

The combination of equations (4) and (7) yields

whereby the solution of
Numerical investigation
Numerical simulations based on finite element (FE) analysis are carried out to investigate the effectiveness of the proposed method by employing the commercial software ANSYS. Consider a steel pipe with the outside diameter (D) of 300 mm and the wall thickness of 10 mm. As shown in Figure 2, the pipe is modeled by PIPE16 with the element size of 10 cm and the springs are applied to each node using the element COMBIN39. According to the guidelines for the seismic design of pipeline system from ASCE (1984), the longitudinal and vertical springs as illustrated in Figure 3 are adopted.

(a) Longitudinal and (b) vertical springs for elastic foundation.
Load pattern
The influence of either surface load or other factors affecting ground deformation on buried pipeline usually act in the form of additional soil pressure, which is similar to a distributed load rather than a locally concentrated force. The actual pattern of additional soil pressure (q) under localized surface load is illustrated in Figure 4(a), which can be approximately simplified as a triangular pattern shown in Figure 4(b). To investigate the feasibility of using a uniform load model (see Figure 4(c)) to represent additional soil pressure, the identified results of pipe deflection due to the triangular and uniform loads are compared as follows.
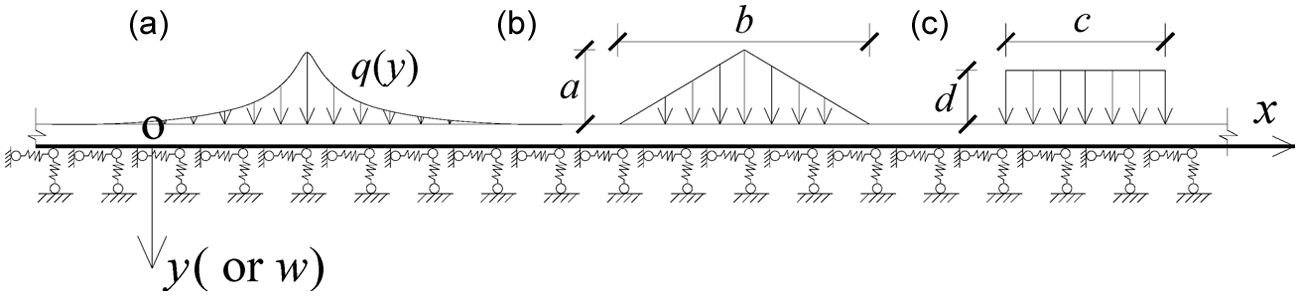
Load pattern for underground pipeline.
The uniform load is taken equivalently to the triangular load by assuming that the maximum deflection, the total force, and its center due to the two loads are same. Consider the case that b = 2 m and the maximum deflection is 10 mm. According to the FE analysis using ANSYS, an equivalent uniform load should satisfy the condition that c = 1.4 m and a = 1.4d. Suppose the sensors are installed at equal intervals and the sensor distance (s) is 1 m. Based on the proposed method, the pipeline deflections under the triangular and uniform loads are identified and both agree well with the results of FE simulation (see Figure 5). Therefore, for the verification purpose, it can simply assume the additional soil pressure on the pipeline as the uniform load.

Identified deflection regarding different load patterns: (a) triangular load and (b) uniform load.
Sensor placement
For a pipeline model as shown in Figure 4(c), the deflection identification is affected by two parameters: the distance (s) of sensors and the distributed length (c) of loads. Define a parameter (η) as the ratio of the load distribution (c) and the sensor distance (s), that is, η = c/s.
Consider four cases of η = 0.125, 0.33, 1, and 3. Adjust the load quantity (“d” in Figure 4) to ensure the maximum deflection is 10 mm. The deflection and rotation responses of the pipeline can be calculated based on the FE analysis. The rotations at the corresponding positions can be then used as the measurements for deflection identification. As shown in Figure 6, the identified results agree well with the set deflections from forward analysis when η ≥ 1. If the load distribution is a bit smaller than the sensor distance (η = 0.5), the identified accuracy is decreased but still can detect and locate the abnormal event. If the sensors are very sparse (η = 0.125) and only one inclinometer presents the effective responses to the load, the deflection identification is not convergent and the external interference can be detected directly using the inclination measurements. It verifies that the method is more applicable and effective in the case of foundation pit excavation or large-scale surface load.

Identified deflection regarding different load distributed length and sensor distance: (a) c = 2 m, s = 16 m, η = 0.125; (b) c = 2 m, s = 4 m, η = 0.5; (c) c = 2 m, s = 2 m, η = 1; and (d) c = 10 m, s = 2 m, η = 5.
Since the ratio (η) is a critical parameter that affects identified accuracy, total 100 numerical cases are conducted regarding different η to investigate the effectiveness of the proposed method in a general way. As the largest error (see “Δ” in Figure 6(b)) usually appears at the location corresponding to the maximum deflection (fmax), Figure 7 presents the relation of the error with η for each case. Most of the identified errors are less than 1 mm (relatively 10%) when η ≥ 1 and better accuracy is achieved with the increase of η. The measuring precision is up to 0.5 mm (relatively 5%) when η ≥ 2.5 and almost no error appears when η is larger than 4. It can conclude that the method is more applicable in the case of foundation pit excavation and large-scale surface load.

Absolute error of deflection identification with the increase of η.
Measurement error
The influence of measurement error on the identification accuracy is a big issue to be addressed when it comes to the inverse analysis on abnormal identification. The signal (θm) including measurement noise of ξ% relative error is simulated as

where θ0 is the accurate inclination with no measurement errors, θp is the measuring precision and for this developed inclinometer is 0.005°, and σ1 and σ2 are the random number with absolute value less than 1.
As mentioned above, safety monitoring of underground pipeline is supposed to achieve two-level targets: (1) detection and localization of the abnormal event and (2) estimation of pipeline deflection. Note that the requirement for identification precision aiming to the first target is much lower than the second. For example, the result as shown in Figure 6(b) is good enough to locate the abnormal inference. Given this fact, the effectiveness of the method on the condition of multilevel measurement error is investigated to achieve the two different targets.
Consider the cases that the maximum deflection (fmax) increases gradually from 1 to 20 mm. For a given fmax, total 200 cases are simulated using the random noise contaminated signals as shown in equation (9). The relative error of deflection identification (δ = Δ/fmax) regarding different measurement errors are plotted in Figure 8 (η ≥ 1) and Figure 9 (η < 1). The horizontal axis is divided into 20 sections. Each section includes 200 cases corresponding to a given fmax. For example, “f1” represents the maximum deflection of 1 mm and 200 relative errors are marked within the first section.

Identified accuracy regarding different measurement errors (η ≥ 1): (a) ξ% = 5%, (b) ξ% = 10%, and (c) ξ% = 20%.

Identified accuracy regarding different measurement errors (η < 1): (a) ξ% = 5%, (b) ξ% = 10%, and (c) ξ% = 20%.
It can be found from the above figures that the identified errors almost keep the same level as the measurement errors when fmax > 3 mm, which verifies that the method is very robust to measurement error and consists with the fact that integral operation is insensitive to error propagation. It can be found by comparing Figure 9 with Figure 8 that a systematic error (30% in this case) exists when η > 1 and the random errors are almost at the same level for both cases. The reason to cause the systematic error is due to the identified inaccuracy as mentioned in section “Sensor placement,” which is affected by the parameter η.
Field testing
Field tests on a 24-m steel pipe are carried out to validate the effectiveness of the proposed method in engineering application. The pipe thickness (t) is 6 mm and the outside diameter (D) is 219 mm. Nine MEMS inclinometers (A1–A9) are attached on the top of the buried pipeline. The backfill height is about 0.6 m. Loading tests are conducted a month after the refilling treatment for soil consolidation. The surface loads are applied at the mid-span of the pipe by placing the bucket, the front wheels, and the rear wheels of a bucket-lift truck, which have been calibrated as 4t, 7t, and 8t, respectively. The details of the buried pipeline, the sensor placement, and the load scheme are plotted in Figure 10.
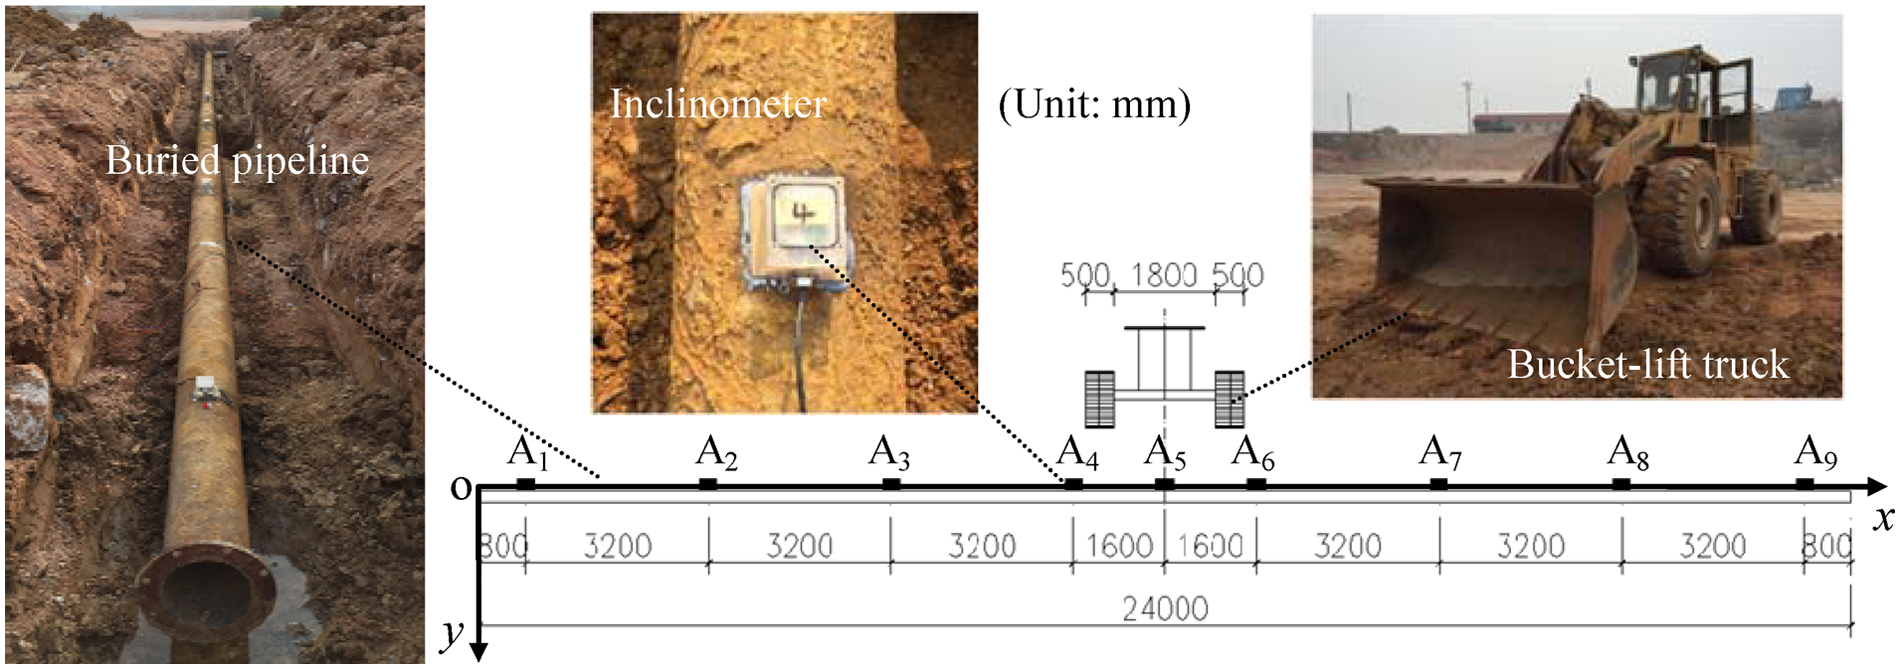
Experimental scheme.
The inclination measurements of the buried pipeline under the three load cases are given in Figure 11(a). It is clear that the inclination measurements can accurately indicate the exact position of the surface loading. With the increase in the load, the larger inclination responses are presented. However, it should be noted that the action area of the surface tire load is localized (c = 0.5 m, s = 3.2 m, η = 0.156) and only the sensors adjacent to the tires (A4 and A6) present the distinct responses. This is similar to the case as shown in Figure 6(a). The identified deflection illustrated in Figure 11(b) displays the similar result and the surface load can be detected directly using the inclination measurements.
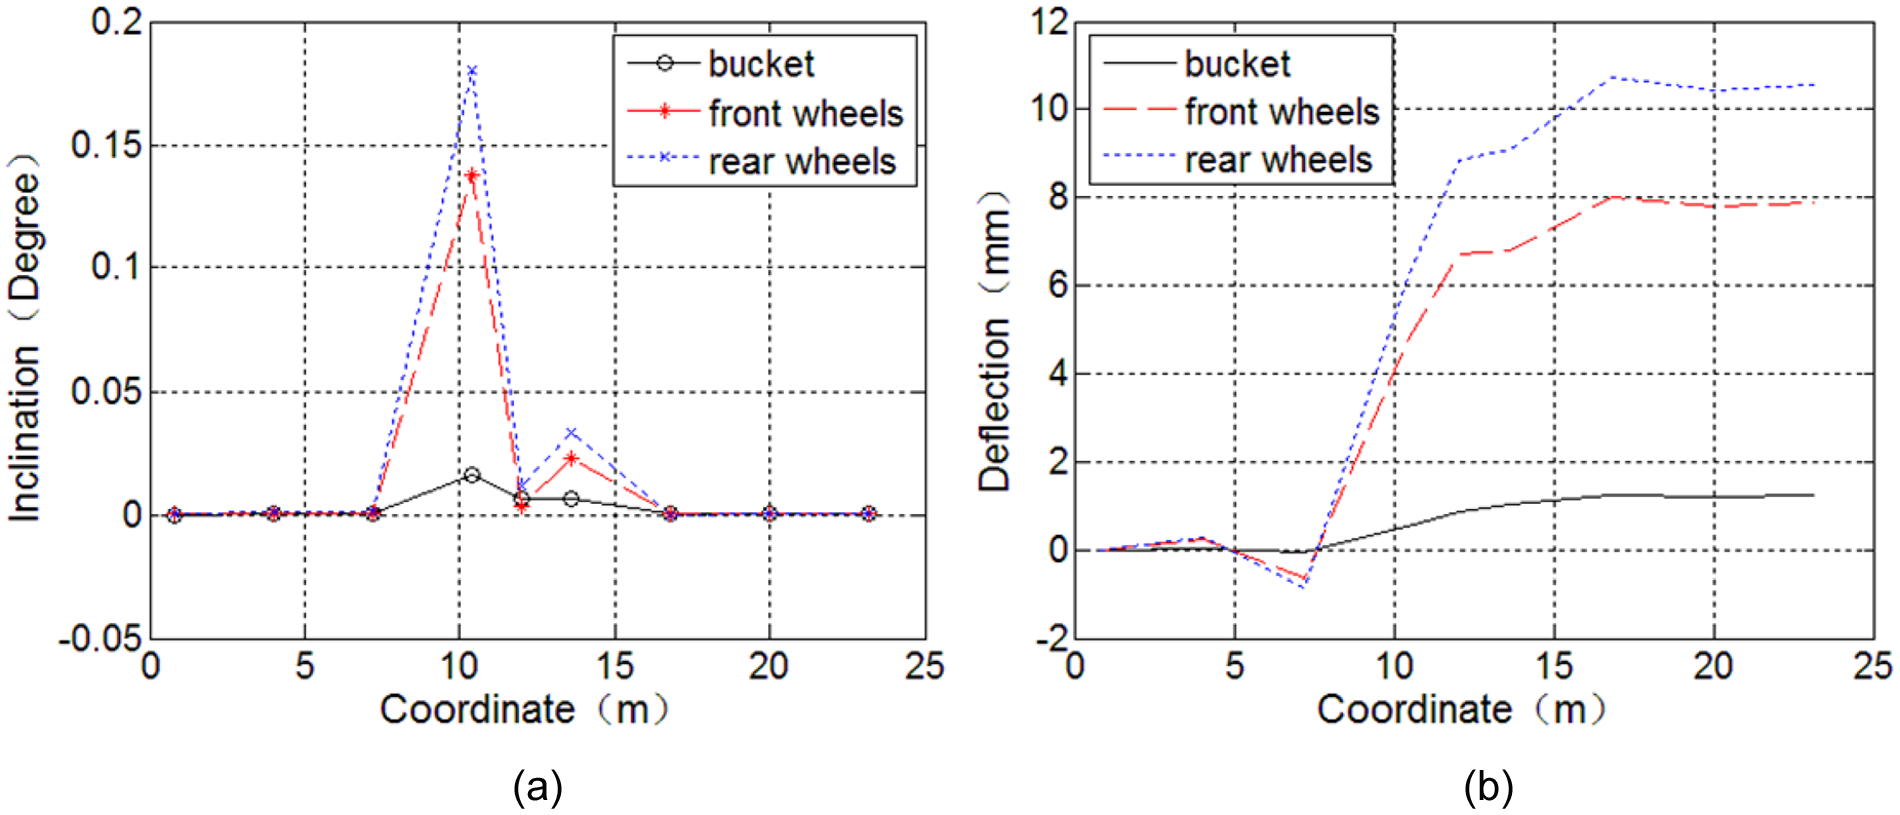
Inclination and deflection of the buried pipeline: (a) inclination measurements and (b) identified deflection.
Conclusion
Aiming at the influence of ground deformation on continuously welded underground pipelines, this article presents a real-time technique for pipeline health monitoring using wireless MEMS inclinometers. The conclusions are summarized as follows:
Compared with the traditional leveling method, the developed system has many advantages including easy installation, low-cost labor, and capability of high-precision real-time measurements.
The proposed strategy can achieve the two-level target: (a) detection and localization of the abnormal event and (b) estimation of pipeline flexural deflection in virtue of the elastic foundation beam model and cubic spline interpolation.
Numerical studies with no consideration of measurement error verify that the ratio (η) of load distribution (c) and sensor distance (s) is a critical parameter that affects the accuracy of deflection identification. Most of the identified errors are less than 1 mm (relatively 10%) when η ≥ 1 and better accuracy is achieved with the increase in η. The measuring precision is up to 0.5 mm (relatively 5%) when η ≥ 2.5 and almost no error appears when η is larger than 4. If the load distribution is a bit smaller than the sensor distance (η < 1), the identified accuracy is decreased but still good enough to detect and locate the abnormal event. If the sensors are very sparse (η << 1) and only one inclinometer presents the effective responses to the load, the deflection identification is not convergent and the external interference can be detected directly using the inclination measurements.
It is verified by error analysis that the method is very robust to measurement error and the identified errors almost keep the same level as the measurement errors when fmax > 3 mm.
The proposed method is more applicable and effective in the case of large-scale ground deformation like foundation pit excavation or large-scale surface load.
Footnotes
Academic Editor: Farzad Ebrahimi
Declaration of conflicting interests
The author(s) declared no potential conflicts of interest with respect to the research, authorship, and/or publication of this article.
Funding
The author(s) disclosed receipt of the following financial support for the research, authorship, and/or publication of this article: The authors are grateful to the National Key Research and Development Program of China (Project: 2016YFC0802406) and the State Key Laboratory of Disaster Reduction in Civil Engineering (Project: SLDRCE14-B-19) for the financial support of this work.