
Abstract
A study on the contribution analysis of interior noise and floor vibration in high-speed trains was conducted using operational transfer path analysis. Initially, noise and vibration measurement at various locations on a high-speed train was conducted with accelerometers and microphones. Measurement positions were selected based on the dominant sources of noise and vibration aboard high-speed trains when traveling at high speeds. From the measurements, the characteristics of interior noise and floor vibration were deduced at various train speeds. In addition, noise and acceleration characteristics of the source positions at various speeds were also suggested. Synthesized results regarding interior noise and floor vibration were obtained from operational transfer path analysis, and the estimation was validated by comparison with measured results. The synthesized results were obtained by combining transfer functions obtained through operational transfer path analysis and measured signals from the sources. After validation, the contribution analysis of the interior noise and floor vibration was conducted from the synthesis of the transfer functions and the measurement results. Finally, the main sources of interior noise and the floor vibration in the frequency domain were derived from the contribution analysis. From the results, wheel noise and center pivot vibration were identified as the main causes of interior noise and floor vibration in a high-speed train at a speed of 300 km/h.
Keywords
Introduction
Excess interior noise or floor vibrations of high-speed trains cause annoyance, fatigue, and stress to passengers. However, it is difficult to reduce interior noise and floor vibration owing to the large number of potential sources, including airborne sources generated by wheel/rail rolling contact, structure-borne sources propagated through the suspension, turbulent boundary layer noise around the moving train, and vibration from ancillary equipment or motive power plants.1,2
For theoretical approaches to analyzing interior noise and the floor vibration, we require knowledge of the transfer functions between the reference sources and the response signals.3,4 Traditional transfer path analysis (TPA) is a very well-known method for obtaining the transfer functions, but it is difficult to derive transfer functions with impact hammers in complicated systems such as trains.5,6 Therefore, it is a very time-consuming effort to determine transfer functions and source quantities such as the operational forces and volume velocities with traditional TPA. 7 In this sense, various new methods related to operational transfer path analysis (OTPA) have been suggested in recent years in order to overcome this limitation.
OTPA is a method for deriving transfer functions directly from operational data.8,9 The method was first proposed for contribution analysis of interior noise in automobiles. 10 In this study, usefulness of the method was verified by the nearly identical results between actual interior noise measured and synthesized interior noise from operation transfer functions in the frequency range of 2000 Hz. However, the component TPA procedure was proposed in order to calculate the total system response resulting from a subcomponent’s source excitation. 11 This method was based on the concept of the frequency response functions of the total system and measurement of the stand-alone subcomponents on a test bench. From this research, physically exact responses at and in front of a gearbox interface were calculated.
After successful verification with automobiles, the OTPA method was applied to various industrial fields. In particular, application in the railway industry was conducted by a railway company using a meter-gauge multiple unit.12,13 The purpose of the research was acoustical performance improvement of running trains on bad tracts, even though the trains satisfied acoustical requirements. The verification in this research showed that the synthesized sound pressure level represents the measured sound pressure level between 50 and 125 Hz at a speed of 75 km/h. In this research, anti-roll bars in the bogie were the major contributors of interior noise between 250 and 630 Hz. However, the OTPA results for the trains compared with those of the cars had limitations and did not show high accuracy in the overall frequency range.14,15
The OTPA method could be more effective than the traditional method in terms of practical applications on moving trains because it does not require physically removing connections among devices to obtain transfer functions. However, it is necessary to eliminate correlated data for selected measurement positions owing to physical connections in order to increase the accuracy of the results.16–18 In addition, careful selection of the measurement position is important in order to minimize correlation effects in the data. If we measure redundant positions for the same sources, it is difficult to clearly identify the contribution of each source.
In this article, a study on the contribution analysis of interior noise and floor vibration is presented using OTPA to obtain effective mitigation measures. At first, noise and vibration measurement positions were selected from structural consideration of the trains. The measurement of the noise and the vibration generated from the operating train was then conducted with accelerometers and microphones. In particular, in order to investigate the causes of interior noise, various noises such as outside windows, ceilings, between-car areas, traction motors, and wheel noise were measured. Moreover, vibrations at various positions at axles, bogies, vertical dampers, and center pivots were measured to determine the causes of floor vibration. From the measurement results, transfer functions between reference measurement points and response measurement points were calculated by singular value decomposition (SVD) and principal component analysis (PCA) methods. 19 Based on the OTPA, the contributions to interior noise and floor vibration were determined from the transfer functions and excitation signals. From the contribution analysis, the main sources of interior noise and floor vibration such as wheel noise and center pivot vibration were identified.
OTPA
Transfer function
In the OTPA method, sound pressure and acceleration at certain points in the vehicle interior are regarded as response signals, and the engine, tires, and so on are regarded as sources or reference signals. We can define the interior noise and floor vibration at specific locations in the vehicle as response signals and sources as reference signals. Moreover, a transfer function represents the relation between the response signal and each reference signal. Therefore, as shown in Figure 1, a response signal is the summation of combinations of transfer functions and reference signals. 20 In this sense, we can deduce the quantitative effect of the respective signals on the response signal by identifying the corresponding transfer functions.
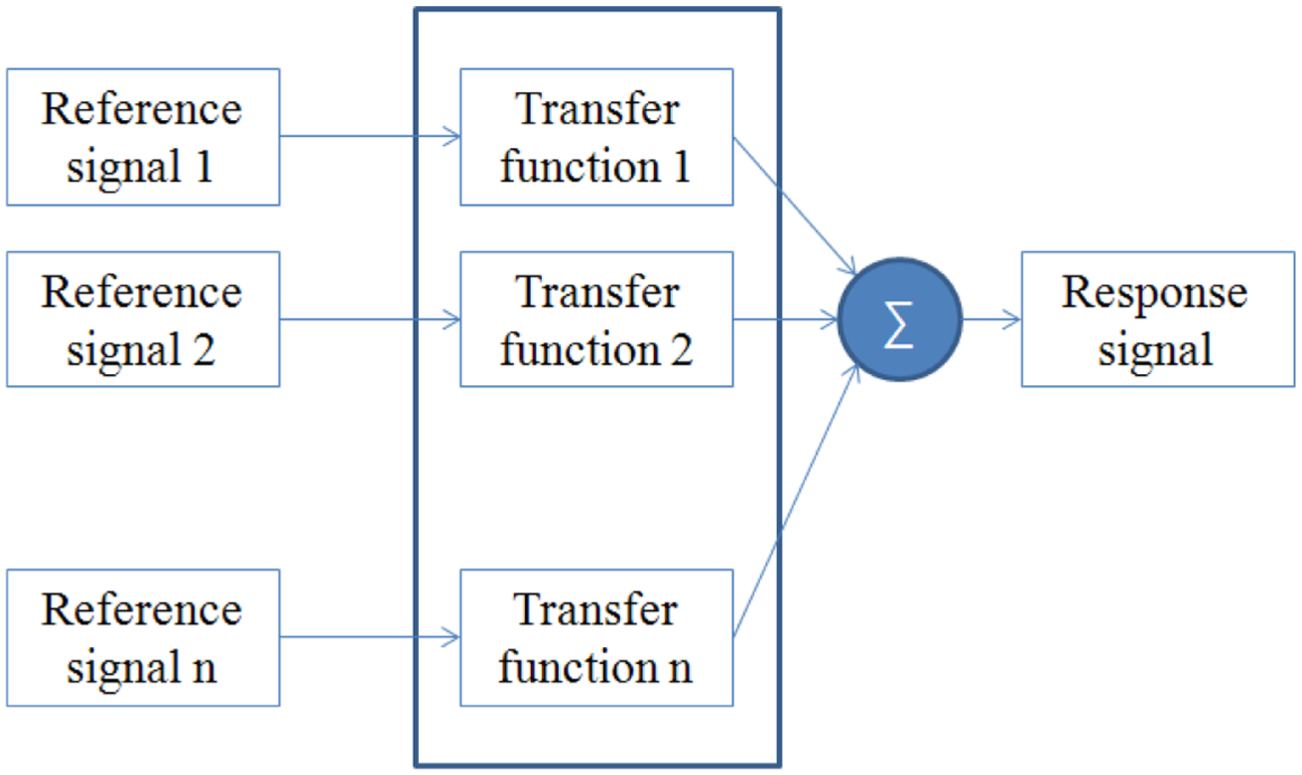
Transfer path between reference signals and the response signal.
However, in complicated systems such as high-speed trains, it is difficult to obtain a clear transfer function with linearly independent reference signals. In particular, in the case of high-speed trains, measurement locations are limited owing to the complexity of the structures of the vehicle. Therefore, it is necessary to apply PCA based on linearly dependent reference signals.
As mentioned before, in order to reduce interior noise and floor vibration in high-speed trains, it is necessary to determine which source is the main cause of noise and vibration. However, because interior noise and floor vibration aboard high-speed trains is induced by complex causes such as rolling noise from wheel–rail contact, aerodynamic noise around the vehicle, and various mechanical and electrical components, it is difficult to determine the main source from measurement data. Therefore, quantitative analysis about the response signal is effective for determining the main underlying causes among complex and various causes.
OTPA
Accelerations and sound pressures near the sources were used to characterize sound sources in OTPA. The sound pressure synthesis is the sum of all contributions 9

where
From equation (1), the transfer function can be derived as

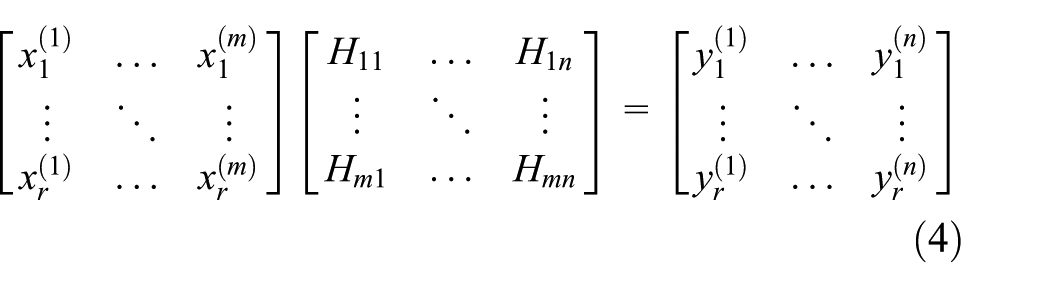
By writing equation (2)

Here, m and n denote the number of input and output degrees of freedom (DOFs). However, taking the transpose does not allow the determination of the transfer function elements. In order to do so, note that during an operational measurement of, for example, a vehicle run-up on a dynamometer, a set of synchronized measurement blocks will be stored to disk. In general, these sets do not have the same contents, as the excitations change continuously during measurement. If one requires, or defines, the relation to hold for each individual measurement block, then one could extend equation (3), writing the equation for all measurement blocks, yielding
This formulation or system model now requires the transfer functions to be linearly independent. However, the acceleration or the sound at the measurement positions is not only generated by the source at that position but also that acting at other source positions nearby. This phenomenon is called “cross-talk.” Therefore, SVD was applied in a cross-talk-cancellation (CTC) technique.
Using principal component regression analysis, SVD is first applied to the measurement data at each reference point. This SVD completely whitens the correlations between the principal components


Next, the singular value matrix, which contains the singular values expressing the magnitude of the principal components in its diagonal elements, is forced. Principal components that are small in comparison to other principal components are considered to be noise components and are discarded. If we measure the positions of unimportant sources, principal components at these sources are small

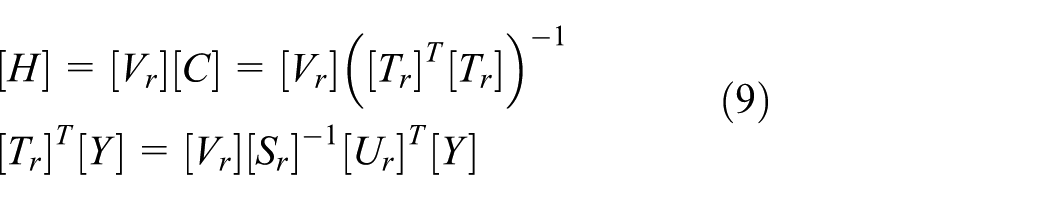
Then, the coefficient matrix

Therefore, the transfer function can be derived as
The most significant advantage of OTPA is that the transfer functions can be derived directly from the operational data. Consequently, this process is effective to handle with both structure-borne and airborne sound sources at the same time. Therefore, this approach has no time-consuming measurements of the transfer functions.
However, highly correlated reference signals are able to influence the accuracy of the estimation of the transfer functions because the transfer functions are derived from operational data in OTPA. Moreover, the correlation between measurement signals depends on the positions of the reference sensors. The measured operational conditions and the selected reference signals become critical. Therefore, the selected datasets should be considered as the different operating conditions. The measurement locations depend on the operating conditions of the target system. For example, in the case of a high-speed train, mechanical equipment noise or rolling noise can be the main noise sources at low speeds, while flow noise generated around the vehicle can be the main noise source during travel at high speeds.
Contribution analysis
Measurement setup
In this study, noise and vibration measurements at various positions aboard a high-speed train were conducted in order to investigate the contribution analysis of interior noise and floor vibration. For the measurements, a newly developed high-speed electric multiple-unit (HEMU) train was selected as the test vehicle. The HEMU train has distributed power systems designed for achieving a speed of 430 km/h, as shown in Figure 2. The experiment was carried out on the Korean high-speed railway line from Busan to Gwangmyeong stations, and the maximum operating speed was 300 km/h, as shown in Figure 3. The running tracks consisted of ballasts and slab tracks. There were also various tunnels and bridges because of mountains along the track.

High-speed electric multiple-unit train.

Train speed on a high-speed railway.
Then, noise and vibration measurement positions were selected at interior and outer locations aboard the high-speed train. In order to obtain reliable results with contribution analysis, it is important to install sensors at positions considered as possible sources. In particular, acceleration sensors should be installed at the main positions of structures along transfer paths. Moreover, surface microphones were used for more accurate measurement of aerodynamic noise sources around the outside of the vehicle. In this measurement, both vibration and noise data were measured based on the same sample frequency of 10,000 Hz.
In this sense, microphones and accelerometers were installed at outside positions of the high-speed train, as shown in Figure 4. At first, surface microphones were placed on the outside windows and ceilings of the train in order to measure noise generated from aerodynamic flows around the trains at high speeds. A surface microphone was installed in the between-car sections where aerodynamic noise was generated. A wheel was selected as one noise measurement position in consideration of rolling noise measured with a surface microphone. The noise from an electronic traction motor with various mechanical equipment such as bearings and gears was measured with surface microphones. Then, accelerometers were installed at various positions, which could affect interior noise and floor vibration. Axles, bogies, traction motors, vertical dampers, and center pivots were considered as the main vibration positions, and vertical and lateral accelerations were measured with accelerometers. The center pivot was located at the center of the bogie, which links the car body and the bogie.

Measurement positions outside a passenger car: (a) noise measurement positions and (b) acceleration measurement positions.
Additionally, microphones and accelerometers were also installed inside the train. In particular, to guarantee accurate measurement, two sensors at symmetric positions were installed. Microphones were installed to measure the interior noise of the train. Accelerations were measured at the side windows and floor, as shown in Figure 5. In addition, vertical and lateral vibrations were measured at positions close to outside center pivots and vertical dampers.

Measurement positions inside a passenger car.
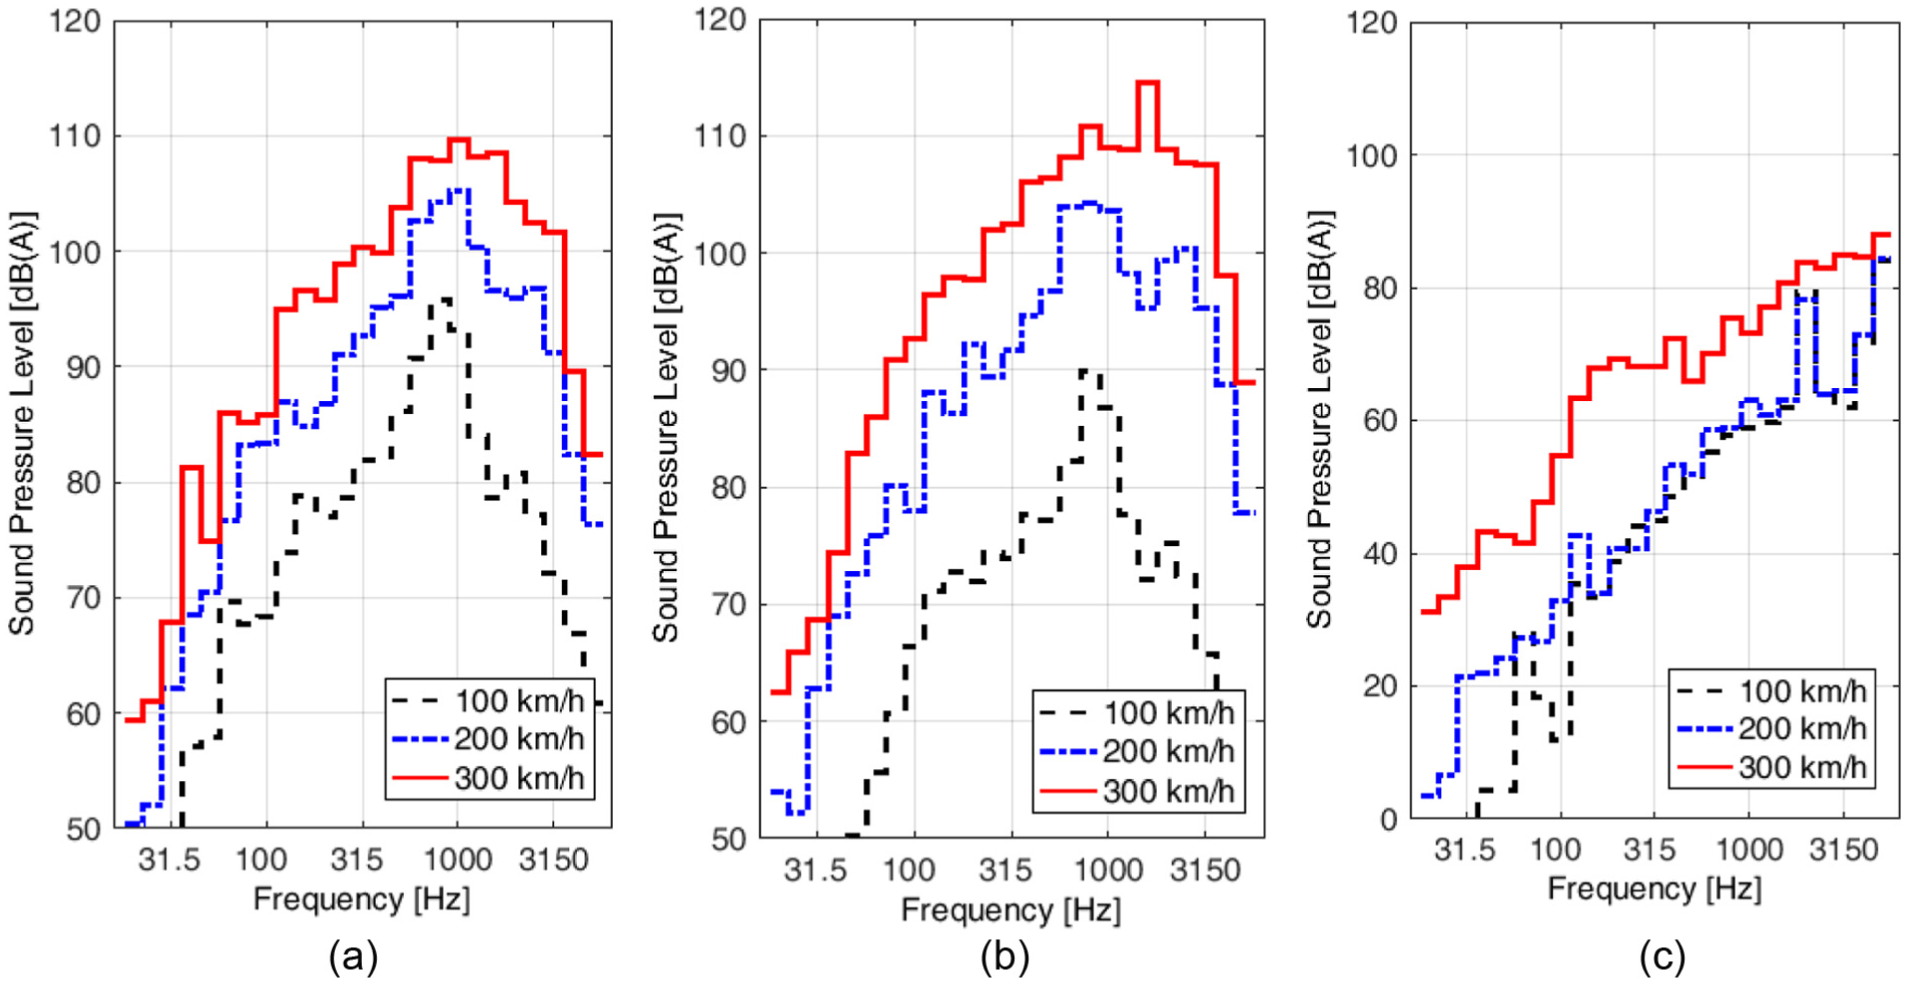
Data analysis of measurement results was conducted. As mentioned above, two sensors were used at the same position in the indoor measurement. From the results, significant differences were not observed between the two sensors. Therefore, the results from one sensor are provided in this article. Furthermore, when operating in various railway vehicle environments, the measured values had instantaneous fluctuations even at the same speed. Therefore, to analyze the frequency characteristics, the average of the measured results based on the operating speed was used. First, interior noise and vertical floor vibration were analyzed, as shown in Figure 6, which illustrates the response signals from contribution analysis. From the results, the interior noise was found to have dominant noise levels at frequencies of 100 and 1400 Hz. In particular, interior noise was widely distributed in the low-frequency region. In addition, vertical floor vibration had peaks at frequencies of 160 and 800 Hz. As mentioned above, the main frequency components can be identified through frequency analysis at the response points. However, based on these results, it is difficult to determine the main causes from among various sources.
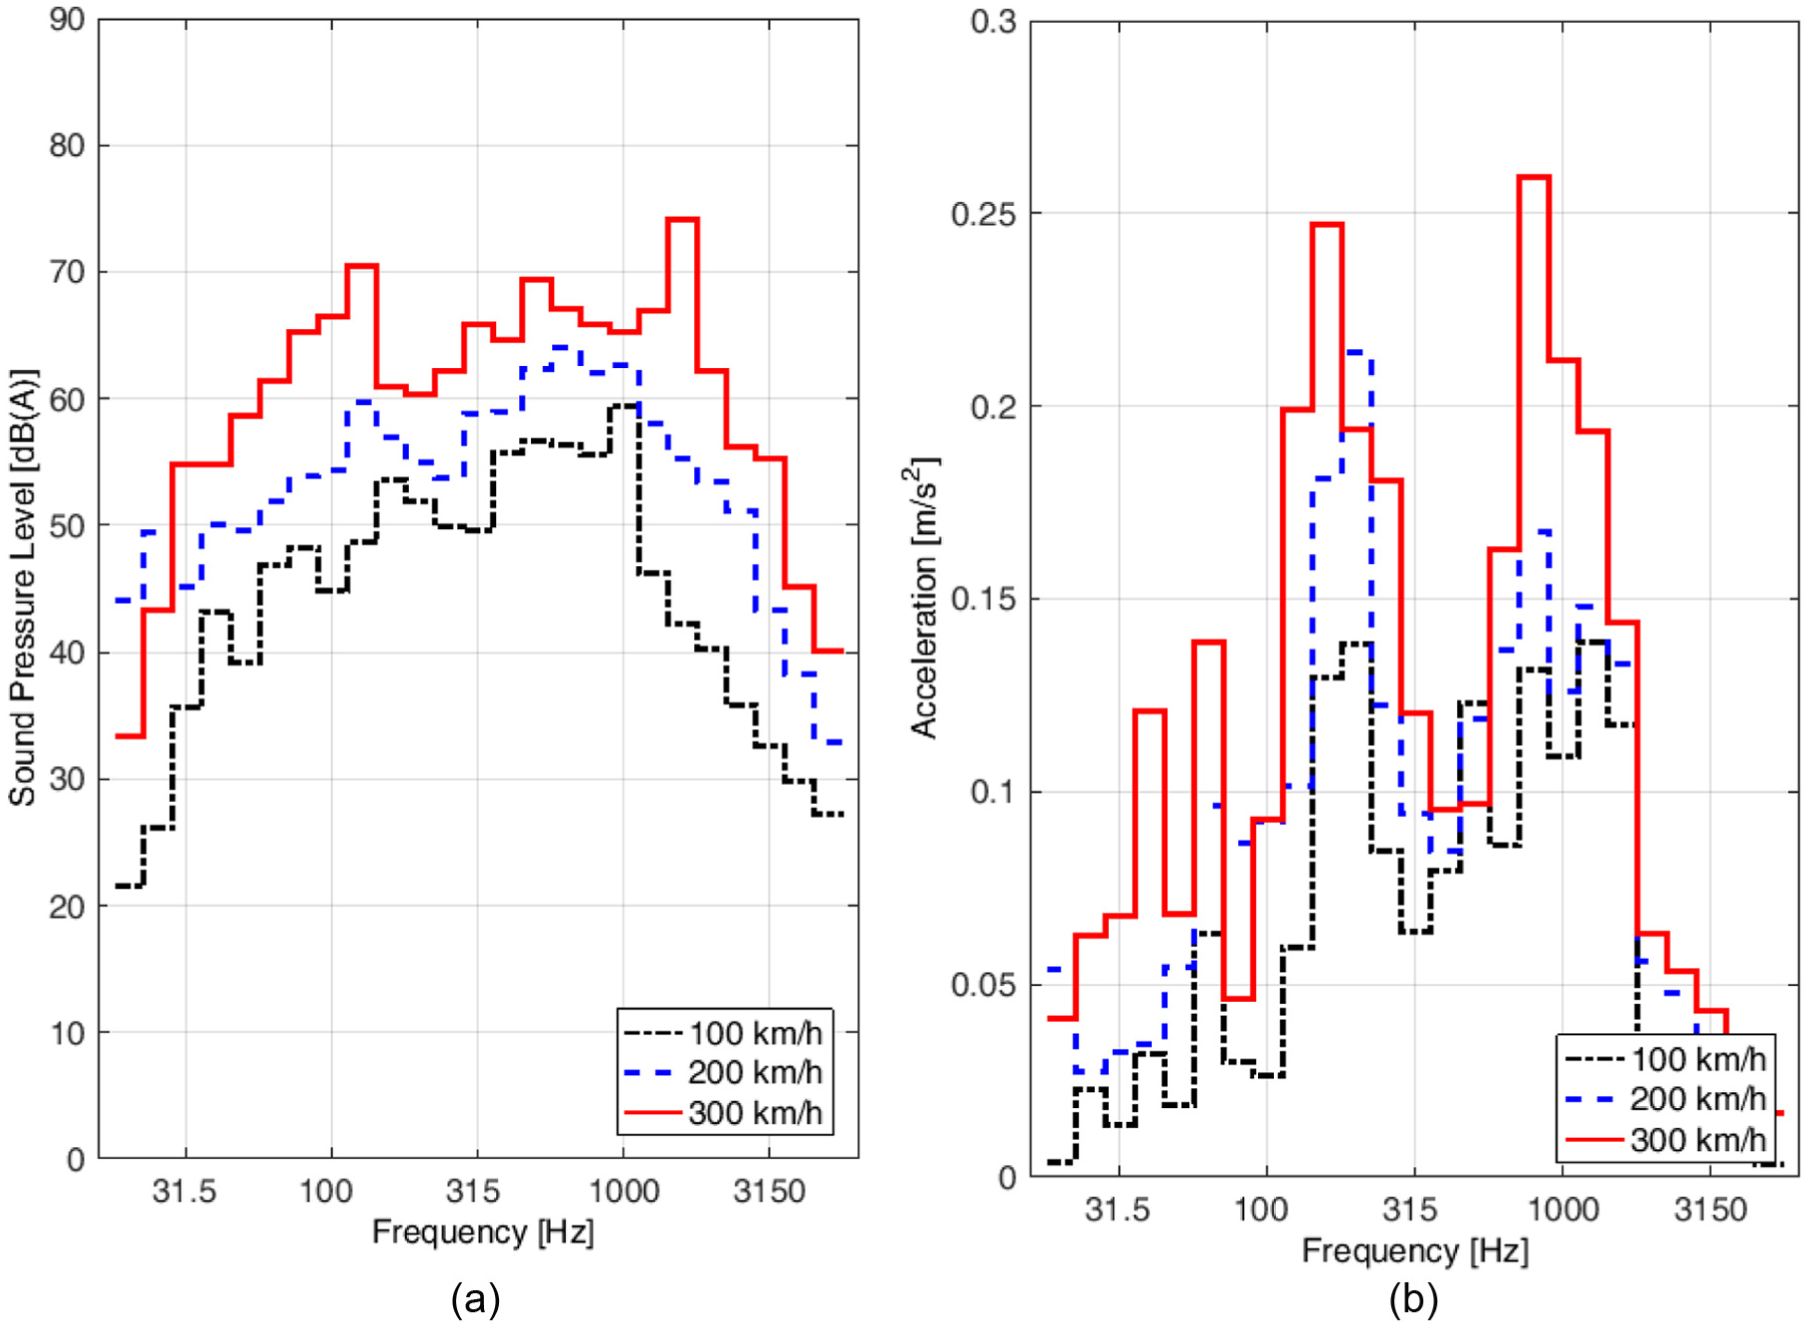
(a) Interior noise and (b) floor vibration at various speeds (1/3 octave band).
Then, reference signals were analyzed to identify the underlying causes of the interior noise and floor vibrations. Aerodynamic noise characteristics of outside windows, ceilings, and between-car areas are shown in Figure 7. Outside windows had high noise levels at a frequency of 1000 Hz. The dominant noise characteristics of the ceilings were at a frequency of 1400 Hz. However, the noise level in between-car sections was relatively small compared to outside windows and ceilings. The flows in-between car areas had vortices in the cavities between the cars, which generated tonal sounds in the low-frequency region. 21 However, in this study, the noise was reduced using side barriers to block the flows. Outside window and ceiling noise showed a similar tendency due to the aerodynamic noise in the surroundings of the vehicle, and the between-car noise had a different frequency pattern owing to the noise generated from closed areas.
Outside aerodynamic noise measurement at various speeds (1/3 octave band): (a) outside window noise, (b) ceiling noise, and (c) between-car noise.
The noise from wheels and traction motors is shown in Figure 8. The roughness of the wheel and the rail is the main cause of generating wheel noise. From the results, the noise of the wheels had a dominant noise level at a frequency of 1400 Hz, which was consistent with wheel vibration at the wheel and rail contact. 22 The noise of traction motors also had a dominant noise level at a frequency of 1400 Hz. Both the traction motor and the wheel were located at the bottom of the vehicle, so they may exert a mutual influence. In particular, as the noise generated by the wheel is higher than the traction motor noise, the influence of the noise on the wheel may be reflected in the result.

(a) Wheel noise and (b) traction motor noise at various speeds (1/3 octave band).
Various vibrations were generated by wheel–rail contacts during the train’s travel. The vibration was affected by the wheel axles and was transmitted to the vehicle body through the vertical damper, bogie, and center pivot. Moreover, the vibration of the traction motor, which supplies propulsion power to the vehicle, also increased as the traveling speed increased. In this sense, the vibrations of the axles, bogies, traction motors, vertical damper, and center pivot were investigated. These vibrations were also increased with the increase in train speed. As mentioned above, various sensor fluctuations occurred at the same speed depending on the driving environment of the vehicle. Therefore, in this study, average data over time are used for the same driving speed. Consequently, the results are limited in their capacity to explain the meaning of the characteristics of each position. First, the vertical and lateral vibrations of the axles had high vibration levels, as shown in Figure 9. The vibration of the bogies can be found, as shown in Figure 10. The traction motor was found to have the highest vibrations compared to other vibration sources, as shown in Figure 11. The vibration of the vertical dampers was generated at a frequency of 800 Hz, as shown in Figure 12. Moreover, the vibration of center pivots had dominant noise at a frequency of 800 Hz in the vertical and lateral directions, as shown in Figure 13. The appearance of the same frequency characteristics is equivalent to measuring a redundant source. Therefore, it is important that each vibration source has different frequency characteristics depending on the speed.

Axle accelerations at various speeds (1/3 octave band): (a) vertical direction and (b) lateral direction.

Bogie accelerations at various speeds (1/3 octave band): (a) vertical direction and (b) lateral direction.

Traction motor accelerations at various speeds (1/3 octave band): (a) vertical direction and (b) lateral direction.

Vertical damper accelerations at various speeds (1/3 octave band): (a) vertical direction and (b) lateral direction.

Center pivot accelerations at various speeds (1/3 octave band): (a) vertical direction and (b) lateral direction.
Contribution analysis
Contribution analysis qualitatively examines the effect of each source on the response signal. The contribution analysis was conducted based on the measurement results. First, measurement points were selected in order to identify responses and reference positions. In this sense, careful selection of measurement points is necessary to minimize correlation effects among measurement results. The transfer functions between reference and response signals were then derived from OTPA. In this process, CTC based on SVD was applied for linearly independent reference signals. Then, the synthesized results for the response signals were obtained from the transfer function and the measured signals. In addition, a comparison between the synthesized and measured results was conducted in order to investigate the reliability of the process. After verification analysis, contribution analysis of the response points was conducted. This process is summarized in Figure 14.
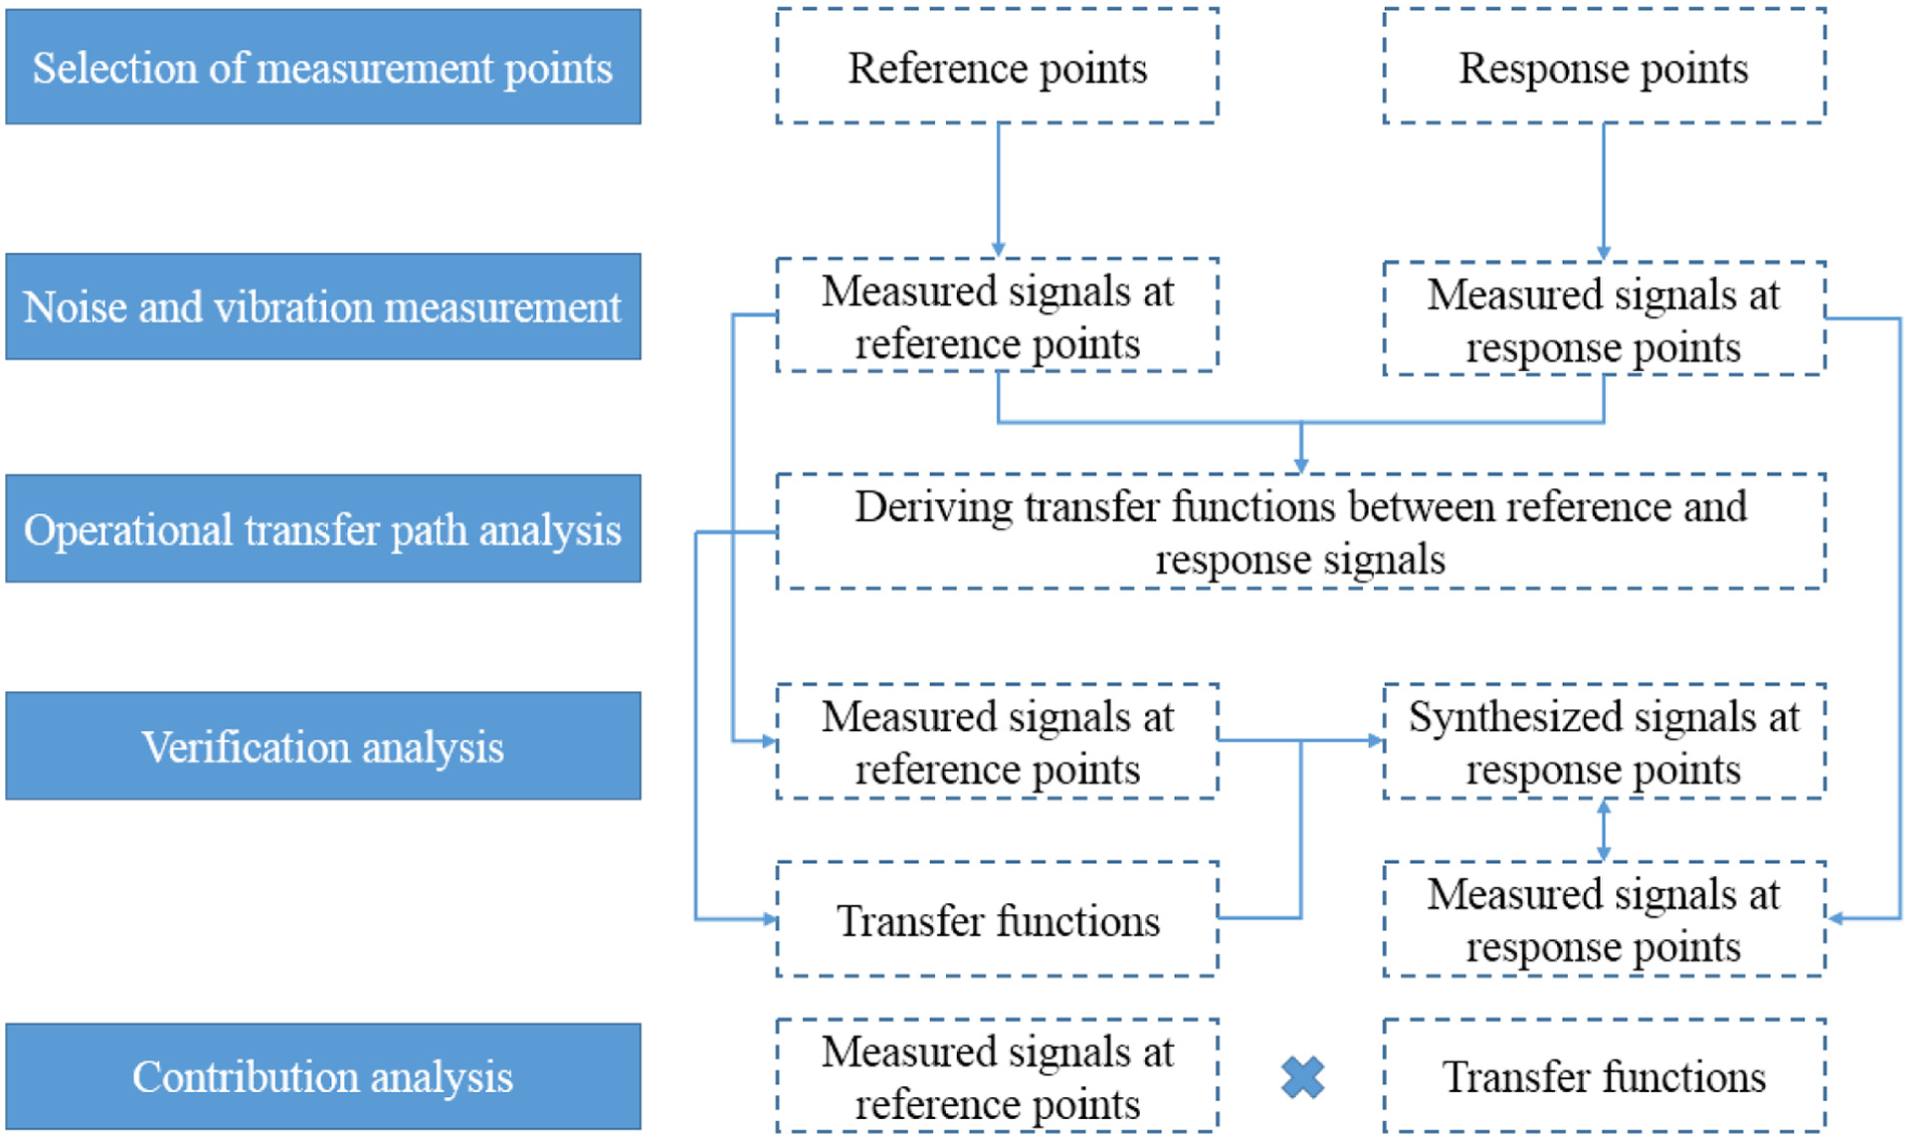
Contribution analysis process.
In order to confirm that the OTPA method performed correctly in this study, it is necessary to compare the transfer function between the noise point and the response point. However, in the case of a complex model such as a railway vehicle, it is difficult to accurately derive the transfer function using the OTPA method. Therefore, in this study, we used a method to compare the measured values for the response points with the synthesized results derived through OTPA. The comparison of synthesized and measured results for the interior noise is shown in Figure 15. The results indicate that the synthesized interior noise is similar to the measured interior noise. Moreover, a comparison between the synthesized and measured results for floor vibration is shown in Figure 16. The comparison results also show agreement between the two results.
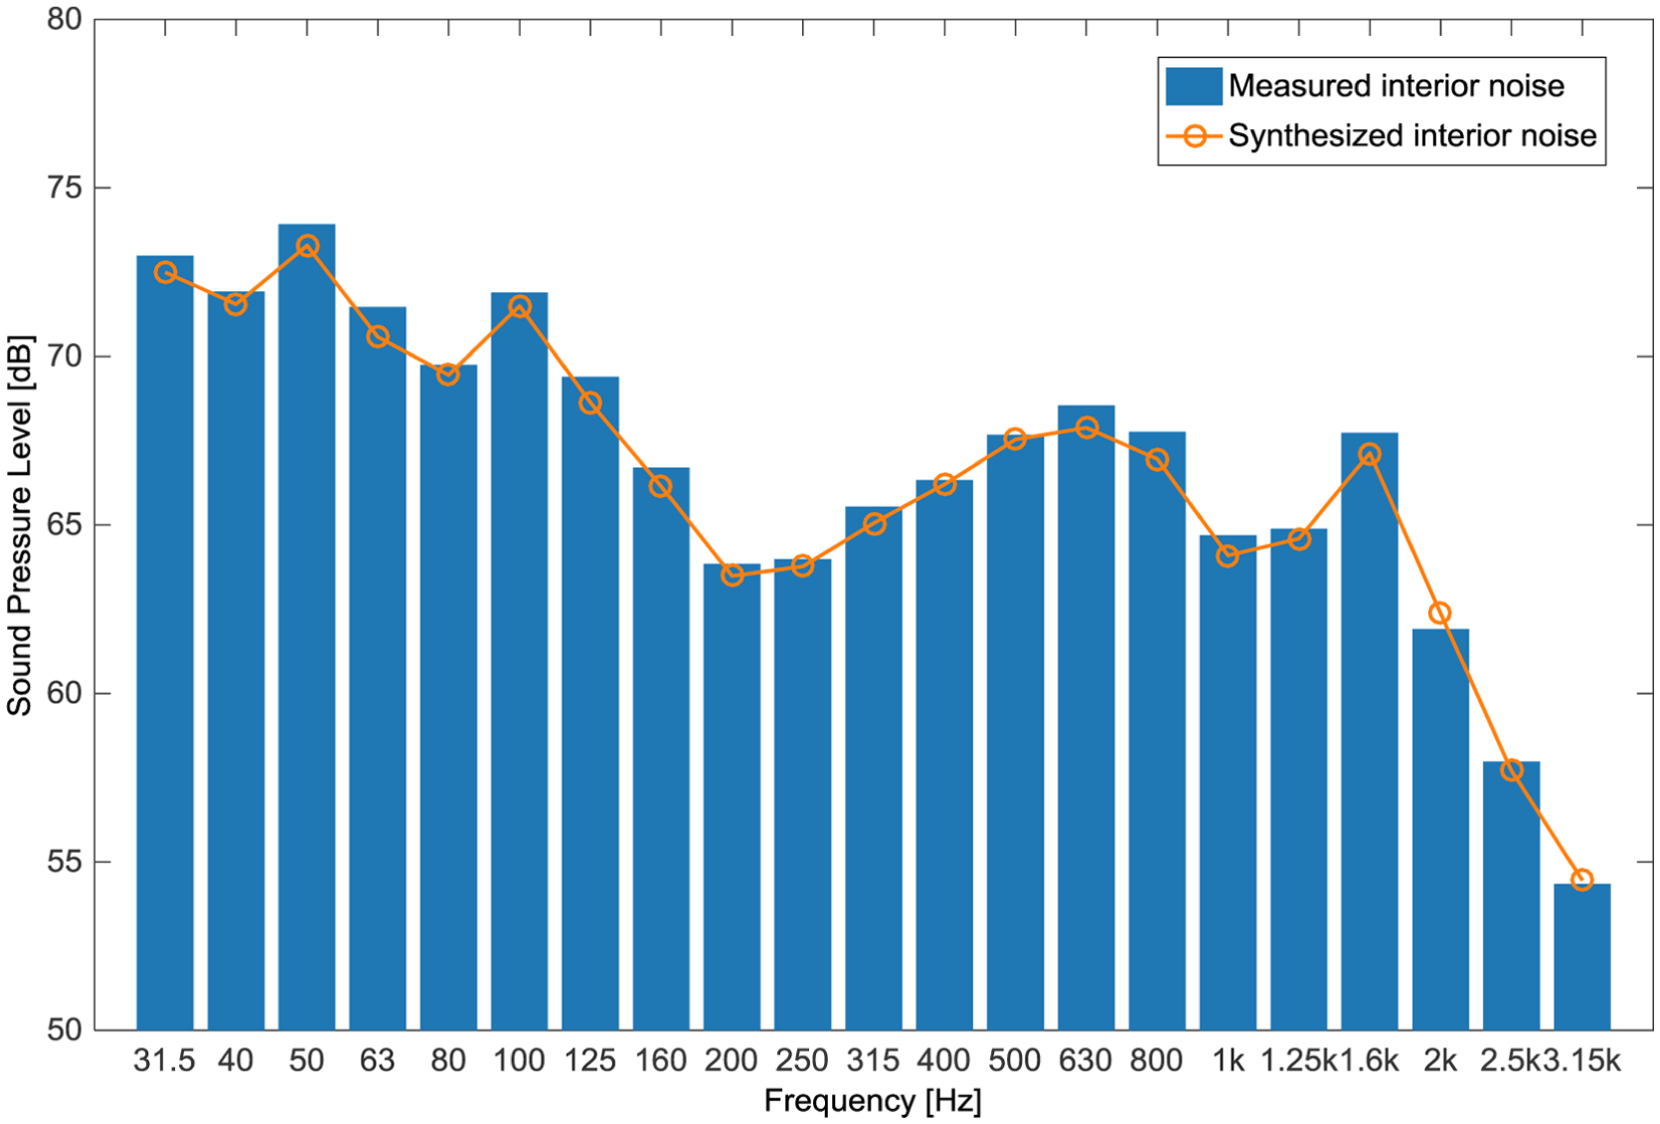
Comparison between synthesized and measured results for interior noise.
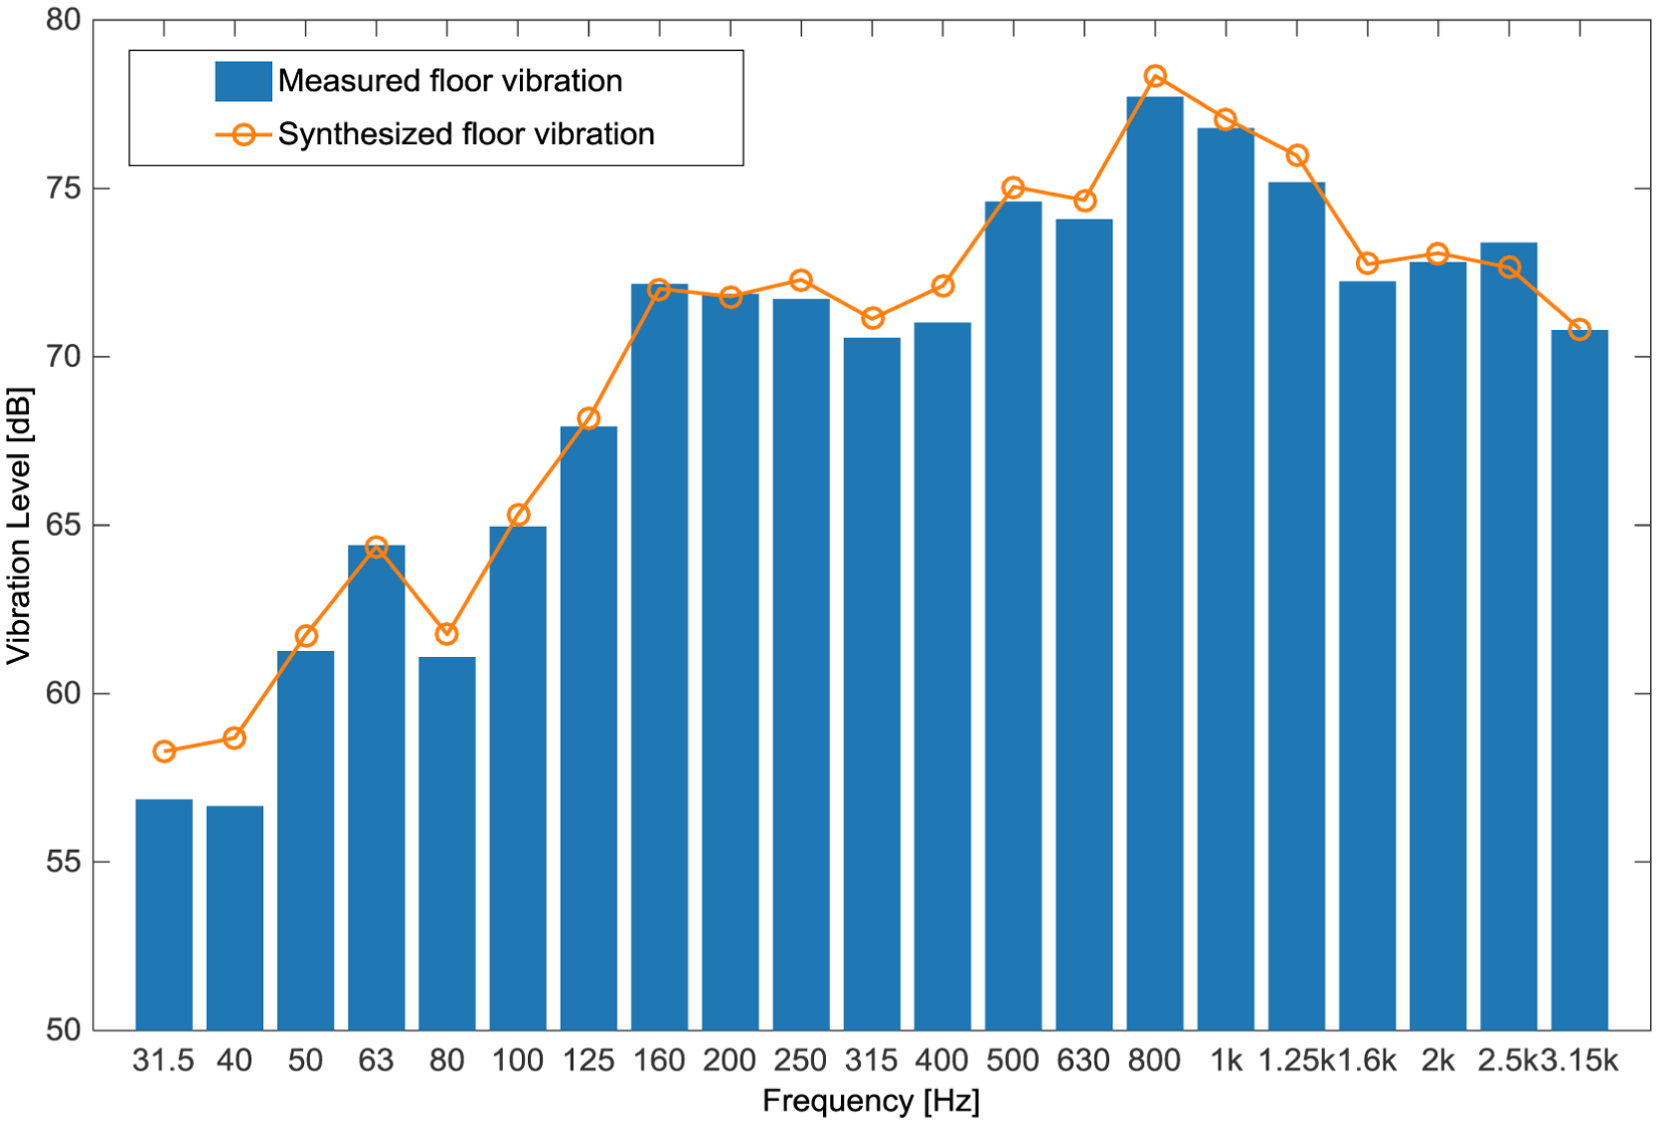
Comparison between synthesized and measured results for floor vibration.
After validation of the results, contribution analysis of the interior noise and floor vibration was derived, as shown in Figure 17. In order to perform contribution analysis, it is necessary to obtain measured data for a certain period at the same speed. Therefore, results other than data at the speed of 300 km/h were excluded from the analysis because they were measured during acceleration or deceleration. In the remaining results, the interior noise was measured for the given position. Then, the transfer functions between each source and the interior noise were derived from operational data. The synthesized results for each noise source were obtained by combining the measured results and the transfer function. The main contribution factors of the interior noise were the wheel noise, outside windows, and ceiling noise. Among these, the wheel noise made the largest contribution to interior noise in the high-speed train. However, there were differences in the main frequency characteristics of indoor noise and wheel noise. The transmission loss of the car body could be one of the main factors responsible for these differences. The noise generated by the wheel was transmitted to interior areas through the car body. The transmission loss of the car body is high at high frequencies but low at low frequencies according to the mass law. 23

Contribution analysis of interior noise aboard a high-speed train.
Moreover, contribution analysis of the floor vibration was performed, the results of which are shown in Figure 18. In the results, floor vibration shows the measured results during operation. The transfer functions for each vibration source and the floor vibration were derived based on the results obtained during operation. The synthesized results for each vibration source were obtained by synthesizing the measured signal and the transfer function. The main frequency of the floor vibration differed from the main frequencies of other elements such as the center pivot, axle, bogie, and so on, which were considered as vibration sources along the transmission path of the vibration. One of the main causes is considered to be vibration reduction by suspensions such as vertical and yaw dampers while vibrations were transmitted to the floor of the vehicle. The center pivot is the part that connects the car body and the bogie. Therefore, the vibration generated in the bogie was transmitted to the vehicle body by the center pivot. The results suggested that center pivot vibration was the most dominant factor in floor vibration.

Contribution analysis of floor vibration aboard a high-speed train.
Conclusion
In this article, contribution analysis of the interior noise and floor vibration in a high-speed train was conducted using OTPA. First, noise and vibration measurement was conducted at the main suspected sources with accelerometers and microphones. In order to measure aerodynamic noise around the vehicle, noise from areas such as ceilings, outside windows, and between-car positions was measured with microphones. The noise from wheels (producing rolling noise) and from the traction motor (producing mechanical equipment noise) was also measured. Moreover, vibrations such as those from the axles, vertical damper, bogie, and center pivot were measured along the vibration path from the wheel to the vehicle body with accelerometers. Transfer functions between response and reference signals were then derived from OTPA. The derived transfer function was verified by comparing the measured and synthesized signals at response points. The comparison results between the two signals showed agreement at frequencies between 31.5 Hz and 3.15 kHz. This means that the derived transfer function is reliable based on the measured signals. Finally, contribution analysis of interior noise and floor vibration aboard a high-speed train traveling at 300 km/h was conducted. From the results, it is suggested that wheel noise was the main contributor to interior noise. This means that rolling noise had more influence than aerodynamic noise aboard the high-speed train running from Busan to Gwangmyeong in Korea. Moreover, center pivot vibration was the main source for floor vibration. The center pivot was located at the center of the car body and connected the bogie to the vehicle. Therefore, adjusting stiffness or damping factors is effective in reducing floor vibration.
Footnotes
Academic Editor: Daxu Zhang
Declaration of conflicting interests
The author(s) declared no potential conflicts of interest with respect to the research, authorship, and/or publication of this article.
Funding
The author(s) disclosed receipt of the following financial support for the research, authorship, and/or publication of this article: This research was supported by a grant from R&D Program of the Korea Railroad Research Institute, Republic of Korea.