
Abstract
A numerical model of multiphase flow was developed to investigate the heat and mass transfer mechanisms in refueling process. The two-dimensional model takes into account the effects of surface tension, gravity, and viscosity. The heat and mass exchange process of free surface was defined to study isooctane liquid evaporation in refueling process. The reliability of the model was verified by the theoretical solution of the Stephan problem. The evolution of the flow field, temperature field, pressure field, concentration field, and evaporation rate was discussed in detail. It shows that there is a strong turbulence and gas entrainment phenomenon. The volume-averaged temperature of the fuel tank is lower than the ambient temperature, and the maximum difference is about 4°C resulting from evaporation; the curve of evaporation rate versus time is very similar to that of the volume-averaged pressure versus time. Besides, the change in evaporation rate is negligible after 1.75 s.
Keywords
Introduction
Organic vapor is generated during gasoline evaporation in vehicle refueling process, which results in huge energy waste and environmental pollution. Every year, the economic loss caused by the evaporation of gasoline is billion yuan, 1 and the vapor generated by the evaporation of gasoline will cause ozone pollution. Therefore, how to effectively control organic vapor emissions of gasoline has been widespread concern. From the 70s of the last century, many organic vapor recovery technologies have been widely studied, and the results are very limited in the study of the characteristics of mass transfer in gasoline evaporation process which is the basis of reasonable design of organic vapor recovery equipments.
At present, most experimental researches focus on the static state of gasoline evaporation and the change in evaporation rate with time,2,3 and the experimental study of dynamic process of gasoline evaporation and evaporation rate is quite difficult, so most researches on the evaporation characteristics of gasoline refueling process use numerical methods. Banerjee and colleagues4–6 studied the automobile refueling nozzle, gas pipe, the flow characteristics in the tank for large passenger car, and light truck loading process using volume-of-fluid (VOF) method for tracking the gas–liquid interface, but did not consider the gasoline evaporation process. Then, Banerjee7,8 simulated the evaporation process of methanol and isooctane mixtures from the opposite direction through an inclined tube. The evaporation rate was calculated based on Fick’s law. The diffusion problem in gas phase was considered, but the interfacial convective mass transfer was ignored. Hassanvand et al. 9 studied the turbulent process with gasoline evaporation using computational fluid dynamics (CFD) technology, but using the averaged property of gasoline makes the calculation of gasoline evaporation process far away from the real situation. Therefore, the difficulties in numerical simulation of filling process of gasoline evaporation are the reasonable selection of gasoline substitutes, gas–liquid mass transfer model, and the two-phase flow interface tracking method.
The composition of gasoline has no definite conclusion which brings difficulties to the relevant numerical simulation. The gasoline-averaged physical parameters9,10 or key components in place of real gasoline were used to simplify the calculation. 11 Al Qubeissi et al. 12 used isooctane or averaged physical parameters as an alternative to gasoline and compared the oil droplet evaporation process inside the engine under these conditions. The results show that the former error is smaller. Therefore, this article chooses isooctane as a substitute for petrol.
Other difficulties in numerical simulation of gasoline evaporation are the interface tracking and interfacial mass transfer of gas–liquid two-phase flow. There are four kinds of gas–liquid two-phase flow interface tracking methods: VOF, front tracking, level set, and phase field method. Haelssig et al. 13 have compared the four methods and indicated that VOF interface tracking allows investigation of systems with arbitrarily complex interface dynamics, and therefore, this article uses the VOF method to simulate the gas–liquid two-phase flow. Abianeh and Chen 14 indicated that the two-layer film theory can be used to simulate the process of mass transfer of gasoline evaporation. Jarvas et al. 15 simulated the evaporation of gasoline and alcohol drops using real solution theory and CFD simulation model. The solvent mixture thermodynamics and CFD were used to calculate the quasi-equilibrium components from the curved liquid surface evaporation. Two-layer film theory was used to simulate the process of evaporation and mass transfer in this article, and the microprocess was not involved.
In summary, most numerical models of refueling process did not take into account the gasoline evaporation, and the material properties were set as the averaged value of critical components of gasoline. Referring to the research method of gasoline evaporation process of gasoline engine in combustion field, the fuel tank was simplified to a two-dimensional rectangular structure in this article, isooctane was used as a substitute for petrol, gas–liquid two-phase flow was simulated by VOF model, and the interfacial evaporation was calculated through the two-layer film theory. Besides, the two-dimensional mathematical model for vehicle refueling process based on Euler method was established and verified by the analytical solution of the Stephan problem. The results show that the isooctane concentration distribution calculation averaged error is less than 10%. The C8H18 concentration, temperature, and pressure distributions’ evolution was presented in this article. The variation in evaporation capacity and evaporation rates at different times was presented. The influence of flow on mass transfer was studied in detail.
Numerical model
Figure 1 shows the geometric model of the fuel tank. The liquid isooctane flows into the fuel tank from the left side with an initial speed of 1 m/s. With an increase in the liquid level, the gas space becomes small, and then the gas is discharged from the outlet of the upper right corner until the tank is filled. The size of the fuel tank is 0.4 m × 0.1 m. The geometric model was meshed using structured grids. Besides, the temperature of the fuel tank wall was set to 300 K, and the velocity inlet and pressure outlet were set as the boundary conditions. The outlet pressure was set to 30 Pa. In the initial time, the temperature and pressure in the tank were the ambient temperature and the ambient pressure, respectively, and the mole fraction of isooctane of gas was set to 0.

The geometric model of fuel tank (dimensions in ×10−3 m).
The numerical method is based on the VOF method. The implemented VOF method consists of an Eulerian description of each phase on a fixed grid. The governing equations were set up on the basis of three hypotheses: (1) the main component of standard gasoline, isooctane, was used as gasoline substitute; (2) the fluid properties were assumed to be constant in each phase; and (3) the fluid was assumed to be incompressible. According to these assumptions, balance equations for mass, momentum, and energy have been written separately for each phase; in addition, the liquid is treated as the basic phase and the vapor is the secondary phase. Then, the closure of two-fluid equations is determined by introducing the interface transfer. The interfacial evaporation was calculated through the two-layer film theory. Equation (1) is the continuity equation for the volume fraction of the liquid phase in each cell and has the following form
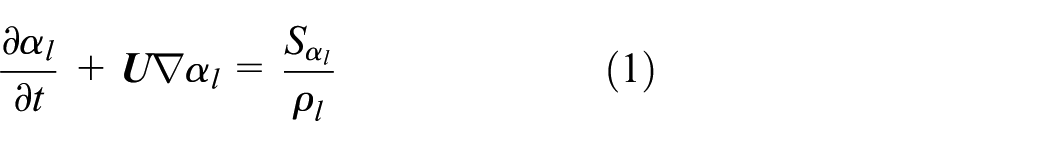
where

where αl is the fraction of liquid in the cell, ρl is the liquid density, Sαl is the source term, and
A single momentum equation is solved throughout the domain, and the resulting velocity field is shared among the phases. The momentum equation (3) is dependent on the volume fractions of two phases through the properties ρ and µ

where P is the pressure, µ is the dynamic viscosity,


The energy equation, also shared among the phases, is shown below
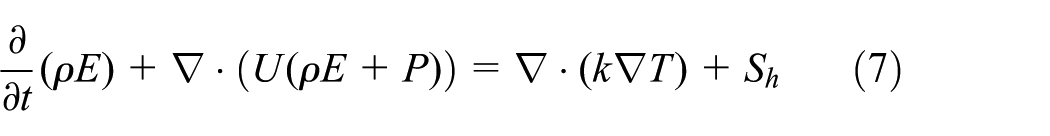
where Sh is the source energy due to phase change at the interface, E is the VOF model treats energy, and T is the temperature. The mass-averaged variables, E and T, are determined by equations (8) and (9)


where Eg and El are based on the specific heat of that phase and the shared temperature, respectively. The conservation equation for the component i is as follows

where Si is the evaporation rate of ith component and Yi is the concentration of ith component in vapor phase.
The user-defined function in FLUENT was used. DEFINE ADJUST (interface, …) was used to find the gas–liquid interface. Macros DEFINE SOURCE (gas src, …), DEFINE SOURCE (liquid src, …), and DEFINE SOURCE (energy src, …) defined the source term in the transport equations. The maximum Reynolds number is 6000, so standard k–ε model was chosen for the turbulent numerical simulation. All the predefined macros and functions can be performed only after being successfully compiled in FLUENT’s solver. Then, the governing equations were discredited, and the coupling of pressure and velocity was solved by the SIMPLEC arithmetic. When using the VOF model, a crucial step in catching the moving interface is how to make interpolation near the interface. The geometric reconstruction method for the calculation of face fluxes was chosen in this study.
Numerical validation
n order to verify the accuracy of the model, we set the initial conditions according to analytical solution of Stephan problem. 14 Figure 2(a) shows the physical model of Stephan problem. The computational domain was 0.02 m × 0.15 m rectangular region. The initial isooctane concentration of gas phase was set to 0, and the outlet boundary was the pressure outlet. The initial isooctane liquid film thickness was set as 0.01 m, and isooctane vapor diffuses in nitrogen when the computation started. Figure 2 shows the C8H18 concentration distribution for numerical simulation results and theoretical solution. It shows that the numerical simulation results agree well with the analytical results, and the maximum error is 11.76%, so the mathematical model is reliable.

The verification of the numerical model: (a) the geometry of the Stephan problem (dimensions in ×10−3 m) and (b) analytical and numerical results of C8H18 mole fraction at 3.94 s.
Results and discussion
The evolution of local temperature, concentration, and pressure in vehicle refueling process
Figure 3 shows the evolution of the phase volume, temperature, concentration, and pressure during refueling process. Figure 3(a) shows the evolution of phase volume during the refueling process. It can be seen from the figure that the whole refueling process continues for 5 s and is accompanied by strong turbulence and gas entrainment. The isooctane liquid column approaches the bottom of the tank at 0.15 s, and a thin liquid film is formed; the turbulent field is mainly located at the bottom corner of the inlet area at this moment. With an increase in liquid level, the impact of liquid column on the liquid phase not only makes a strong fluctuation of the gas–liquid interface but also promotes the formation of bubbles in the liquid phase. As the liquid level continues to rise, the distance between inlet and gas–liquid interface decreases, and the number of bubbles in the liquid phase is much more. By comparing the bubble distribution at 3.05 and 4.05 s, it shows that bubbles in the liquid phase are mainly distributed around the liquid column impact area. As the liquid level increases, the number of bubbles near the bottom of the tank decreases.

The evolution of temperature field, concentration field, and pressure field during vehicle refueling process: (a) volume of gas phase, (b) temperature, (c) C8H18 mole fraction, and (d) pressure.
Figure 3(b) shows the evolution of temperature field during the refueling process. It can be seen from the figure that the temperature around the liquid column is about 298°C due to the endothermic process of liquid evaporation, and the gas temperature of the outlet is still the ambient temperature at 0.15 s; moreover, the temperature distribution is a step type. The main mechanism of this phenomenon is that the entry of the isooctane liquid and the production of the isooctane vapor make the gas with higher temperature around outlet area discharge, while part of the heat is transferred from gas phase area around the outlet to the field around liquid column through heat conduction and convection, and another part of the heat transferred from the wall and liquid phase through convection. As the specific heat of the liquid phase is far larger than the gas phase, the decrease in liquid phase temperature mainly appears near the gas–liquid interface. After 1.05 s, the heat transfer among the liquid evaporation, the convection near wall, and the heat transport inside the tank reach the steady state, and the maximum difference between the internal temperature and the ambient temperature of the fuel tank is about 4°C. The temperature of bubbles is about 1°C below the liquid temperature.
Figure 3(c) shows the evolution of the C8H18 mole fraction in the refueling process. It can be seen from the figure that the C8H18 mole fractions around the liquid column and the outlet region are about 1.3 × 10⁻³ and 0 at 0.15 s, respectively. C8H18 spreads to the whole computing area at 1.05 s, but the value of C8H18 mole fraction is relatively small. The C8H18 mole fraction of gas phase and bubbles in liquid phase reach the saturation concentration of the environmental pressure with time elapsing. With a further increase in liquid level, the gas phase space continues to decrease, and the C8H18 mole fraction continues to increase until the saturation concentration is reached.
Figure 3(d) shows that the pressure in the tank increases from 0 to about 30 Pa during 0.15–1.05 s. And then with an increase in liquid level and the turbulent intensity in the liquid phase, the pressure region of −200 Pa appears in some regions. This is due to that there are many bubbles around liquid column, and the deformation of these bubbles leads to the emergence of negative pressure zone.
The evolution of averaged temperature, concentration, and pressure in vehicle refueling process
Figure 4 shows the evolution process of the volume-averaged values of the whole calculation region. As can be seen from the figure, the volume-averaged temperature decreases first, then increases, and finally the temperature is kept at the ambient temperature. According to Figure 3(b), it can be seen that the area of low-temperature gas increases with time elapsing, so the volume-averaged temperature of computation domain gradually decreases. The space of gas phase is filled with low-temperature gas at 1.05 s, so the volume-averaged temperature is lowest at this moment. With an increase in liquid phase volume, the space of low-temperature gas decreases, so the volume average temperature increases. Almost all the fuel tank is filled with liquid at 4.05 s, and the temperature rises to the environmental temperature.
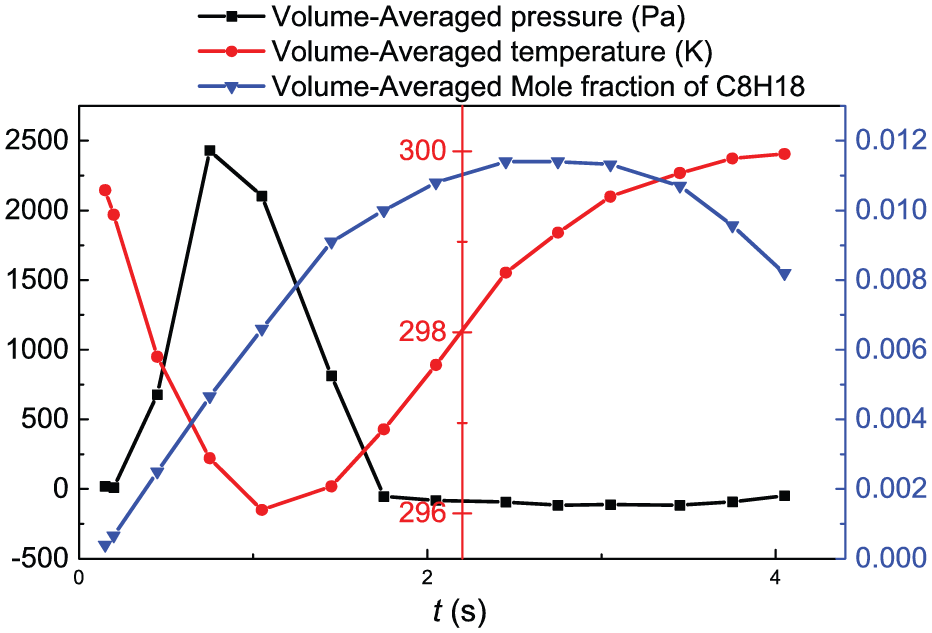
The evolution of the volume-averaged values.
The volume-averaged mole fraction of C8H18 increases first and then decreases. On one hand, with an increase in liquid level, the liquid-level fluctuation and the increase in the number of bubbles in the liquid phase lead to the increase in gas–liquid interface area, which makes the evaporation rate increase. On the other hand, the increase in the liquid level makes the gas phase space decreased, and the C8H18 mole fraction in the liquid phase space is 0, which leads to a decrease in the volume-averaged mole fraction of C8H18. These two reasons make the volume-averaged mole fraction of C8H18 reach maximum at 2.75 s.
The volume-averaged pressure increases first and then decreases and fluctuates around a specific value after 1.75 s. This is because the volume-averaged pressure increases with an increase in gas–liquid interface area. However, the interfacial evaporation is almost stopped when the C8H18 mole fraction is equal to the saturated value, so that the internal pressure of the whole tank gradually decreases, and the negative pressure, about 100 Pa, appears finally.
The evolution of evaporation capacity and evaporation rate in vehicle refueling process
The evaporation capacity refers to the total mass of C8H18 evaporated from the liquid during 0–t s. The evaporation rate is defined as the mass of the C8H18 evaporated per unit time. Figure 5 shows the curves of the evaporation capacity and evaporation rate over time. It can be seen that the evaporation capacity increases gently with time first, and then increases dramatically during 0.4–1.7 s, and the curve slope decreases after 1.7 s. At the same time, the evaporation rate changes gently before 0.4 s, changes rapidly during 0.4–1.7 s, and fluctuates around 0.25 kg/s after 1.7 s. The comparison between Figures 4 and 5 shows that the trend of volume-averaged pressure is similar to that of the evaporation rate, and the position of the curve inflection point is the same.

The evolution of evaporation capacity and evaporation rate.
C8H18 discharge capacity refers to the total mass of C8H18 discharged from the outlet during 0–t s. C8H18 discharge rate is defined as the mass of C8H18 discharged from the outlet per unit time. Figure 6 shows the evolution of C8H18 discharge capacity and discharge rate from the outlet. It is found that the trends of two graphs are similar by comparing Figure 6 with Figure 5. Therefore, we can control the emission of organic vapor by controlling the evaporation of the fuel tank. The evaporation of isooctane mainly occurs during 0.5–1.7 s, and the total refueling time is about 5 s, so the first 10%–34% period of the refueling process is the main stage of organic vapor generation.
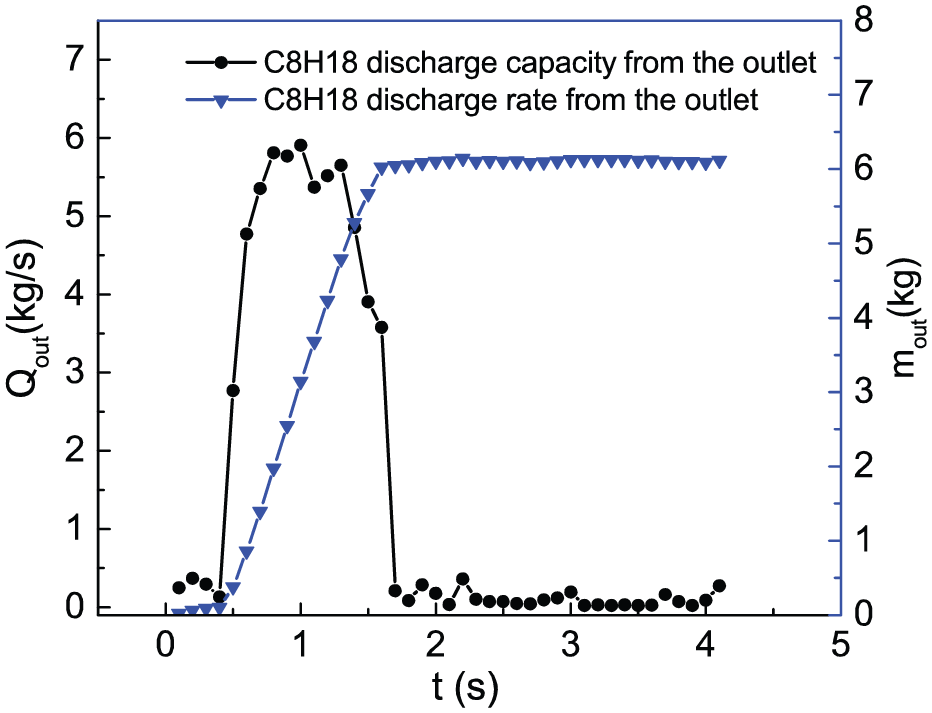
C8H18 discharge capacity and discharge rate from the outlet.
Conclusion
A two-dimensional unsteady state model of the vehicle refueling process is established. The isooctane is the substitute of gasoline, and the heat and mass transfer process of gas–liquid interface was considered in the model. The reliability of the model was verified by the theoretical solution of the Stephan problem. The evolution of phase volume, temperature field, concentration field, pressure field, evaporation capacity, and evaporation rate was studied by the mathematical model. The conclusions are as follows:
There is a strong turbulence and gas entrainment phenomenon. The volume-averaged temperature of the fuel tank is lower than the ambient temperature, and the maximum difference is about 4°C resulting from the evaporation heat absorption.
The C8H18 mole fraction of gas phase gradually approaches the saturation value with the time elapsing. The C8H18 mole fraction of bubbles in liquid phase reaches the saturation value of the atmospheric pressure immediately.
The volume-averaged pressure of the filling process first increases and then decreases with time, and the change became gentle after 1.75 s. The volume-averaged pressure ranges from −200 to 2500 Pa.
The curve of the evaporation rate is very similar to that of the volume-averaged pressure. The evaporation rate increases first and then decreases during 0.4–1.75 s. Besides, the evaporation rate of the gas–liquid interface is negligible after 1.75 s. Through reducing the liquid turbulence and gas entrainment to reduce gas–liquid contact area, or by changing the environmental pressure reducing saturated concentration of C8H18, or by reducing refueling time can be the research directions of gasoline evaporation inhibition as a follow-up study.
Footnotes
Appendix 1
Academic Editor: Jose Ramon Serrano
Declaration of conflicting interests
The author(s) declared no potential conflicts of interest with respect to the research, authorship, and/or publication of this article.
Funding
The author(s) disclosed receipt of the following financial support for the research, authorship, and/or publication of this article: This research was supported by the Beijing Natural Science Foundation under grant no. 3164042, 2014 key projects of Beijing Municipal Education Commission of Science and Technology Development Plan and key projects of Beijing Natural Science Foundation (B) under grant no. KZ201410017019, the National Natural Science Foundation of China under grant no. 51476054, and the project of Beijing Institute of Petrochemical Technology under grant no. BIPT-POPME-2015.