
Abstract
In allusion to WSM-3 non-asbestos phenolic resin-based friction material, the experimental devices are set up for studying tribological properties of the WSM-3 resin-based non-asbestos brake shoe braking on 16Mn steel. According to collected experiential data of physical test, the change rules of the transient/mean friction coefficient are studied with contact pressure, sliding velocity, and contact surface temperature, and then the curves are drawn. The changing law of the friction coefficient is explored with the different-condition parameters, and the variation mechanism of friction performance of WSM-3 brake shoe material is discussed. The experiment results show that the frictional properties of the materials have not only strong system dependency but also strong coupling with the working conditions of the system. It is required to consider the transient friction coefficient or the average coefficient of friction as a variable in the material tribological design.
Introduction
Brake shoe is the most important part of large machinery brake system. The friction performance of the brake shoe guarantees the safety and the reliability of the brake; if the performance of the friction material cannot meet the design requirements, there will be the possibility of equipment accidents and personal accidents.1–3 The WSM-3 material is a resin-based friction material,4–7 using other fibres8–10 instead of asbestos fibre 11 with the following advantages: environment friendly, dust free, and non-asbestos.4,5 The friction properties of the new brake shoe material require deep-going research.
The foremost performance parameter of the friction material is the friction coefficient.12,13 The friction behavior of the material is largely influenced by a variety of factors.
14
The showing performances have a strong uncertainty.
15
The physical and chemical parameters16–19 of the material are strongly coupled with the working conditions and the environmental medium during the friction process, such as the properties of the material itself
20
(chemical, physical, and mechanical), the experimental conditions21–25 (contact pressure, sliding velocity, temperature, and medium environment), and the friction contact form.26–31 The braking materials’ test32,33 mainly involves the large equipment braking including automobile, train,
34
airplane, and generator unit.
35
For the sake of studying tribological properties of the WSM-3 resin-based non-asbestos brake shoe braking on the 16Mn steel, use X-DMZ-integrated experimental apparatus, simulate the actual-condition parameters, and explore the friction properties of the WSM-3 non-asbestos friction material under different contact pressures P, different sliding velocities
Experimental part
Experimental materials
Brake shoe material: non-asbestos phenolic resin-based brake shoe; type: WSM-3; sample size: 25 mm × 25 mm × 6 mm; manufactured by Zhongshi Luoyang Heavy Machinery Co., Ltd.
Friction counter surface material: 16Mn friction disk—the chemical composition of 16Mn steel is shown in Table 1; manufactured by Xianyang Xinyi Friction Sealing Equipment Co., Ltd.
Chemical composition of 16Mn steel.

Experimental device
Non-metallic materials sampling machine—type: XD-B; manufactured by Xianyang Yuanxing Machinery Equipment Co., Ltd.
Material friction and wear experiment devices: type: X-DMZ—the real product photo of the X-DMZ frictional tester is shown in Figure 1; manufactured by Xianyang Xinyi Friction Sealing Equipment Co., Ltd.

X-DMZ pad-on-disk friction tester.
Mechanical properties of WSM-3 non-asbestos phenolic resin-based brake shoe material
The WSM-3 friction material is one kind of resin-based friction material reinforced by hybrid fibre instead of asbestos, characterized by high average coefficient of friction, good mechanical strength, low heat decay, low hardness, not-easy injury friction disk, no asbestos, environmental friendliness, low abrasion, and long service life. The size of the sample processed by WSM-3 brake shoe material is 25 mm × 25 mm × 6 mm, and the side length and thickness error are controlled within the range of 0–0.2 mm. The basic physical and mechanical properties of WSM-3 materials tested by the conventional mechanical experiments are shown in Table 2.
Mechanical properties of WSM-3 materials.

Experimental data-processing method
During the test, the contact pressure is loaded by the air compressor through the cylinder and remains constant. The force measurement system of the tester records the friction force between the brake shoe and the friction disk in real time, and the transient/mean friction coefficient is automatically calculated by the computer system according to the following formula

where F is the transient/mean friction force between brake shoe and friction disk (N), P is the contact pressure of brake shoe specimen (MPa), A is the contact area of brake shoe specimen (mm2), and µ is the transient/mean friction coefficient.
Experimental-condition parameter settings
The experimental conditions mainly include the contact surface temperature, sliding speed, and the contact pressure.
JB/T3721-1999 “mine hoist disk brake shoe” provision: the friction performance of the brake shoe was measured under a contact pressure of 0.98 MPa and a relative sliding speed of 7.5 m/s. The authors also reference the following criteria: GB5763/-1998, automobile brake shoe; GB/T5764-1998, automobile clutch plate; GB/T11834-2000, asbestos friction plates for industrial machinery; QC/T227.1-1997, test method for frictional properties of brake pads for motorcycles and mopeds; SY/T5023-1994, oil rig with brake block; and railway with synthetic brake shoe and other compliance test method. It is considered that the WSM-3 brake material are applied not only in the mine hoist applications but also in other mining engineering machinery applications, and in view of the accuracy of the main experimental device.
The accuracy parameters of the main experimental device are as follows: the total power of X-DMZ testing machine: 20 kW; the distance between the center of the specimen and the center of the pressure loading axis: 150 mm; the maximum value of testing friction: 2000 N; the friction measurement accuracy: ±1N; the friction measurement error: ±5N; the pressure testing range: 0.5–3.0 MPa; the pressure measurement accuracy: ±5N; the pressure control error: ±15 N; the friction disk speed range: 100–2000 r/min; the speed control error: ±10 r/min; the highest testing temperature: 400°C; the friction disk temperature measurement accuracy: ±1°C, the temperature control error: ±5°C; and the repeatability error: ≤1%.
So, the experimental parameters are set as follows: the nominal contact pressure changes in the range of 0.6–1.6 MPa; the sliding velocity changes in the range of 2.5–20 m/s, the contact surface temperature changes in the range of 100°C–350°C.
Experimental procedure
Under the conditions of contact pressure of 0.98 MPa, sliding speed of 7.5 m/s, and contact surface temperature of 100°C, the transient friction coefficient of the single braking process with the change of time was investigated.
Under the condition of contact pressure of 0.98 MPa and sliding speed of 7.5 m/s, the change law of the transient friction coefficient with the increase in contact surface temperature in the process of single braking process is studied.
Under the condition of contact pressure of 0.98 MPa and contact temperature of 100°C, the law of the transient friction coefficient with the increase in the sliding speed in the process of single braking is studied.
Under the condition of sliding speed of 7.5 m/s, the contact pressure range is set at 0.6, 0.8, 1.0, 1.2, 1.4, and 1.6 MPa, and the variation laws of the average friction coefficient of brake shoe material with the change of contact surface temperature are studied.
Under the condition of sliding speed of 7.5 m/s, the contact surface temperatures were set at 100°C, 150°C, 200°C, 250°C, 300°C, and 350°C, and the variation laws of the average friction coefficient of brake shoe material with the change of contact pressure are investigated.
Under the condition of contact pressure of 0.98 MPa, the sliding speed is set at 2.5, 5, 7.5, 10, 12.5, 15, 17.5, and 20 m/s, and the change laws of the average friction coefficient of the brake shoes with the increase in contact surface temperature are studied.
Under the contact pressure of 0.98 MPa, the temperature of the contact surface is set at 100°C, 150°C, 200°C, 250°C, 300°C, and 350°C, and the average friction coefficient of tiles increases with the sliding velocity of the contact surface. The variation laws of the average friction coefficient of brake shoe material with the increase in sliding velocity are studied.
The experimental schemes of the procedure are shown in Figure 2.

Schemes of experimental procedure.
Experimental results and discussions
Variation of transient friction coefficient with time
The laws of the transient friction coefficient with the braking time are shown in Figure 3 under the conditions of fixed contact surface temperature, fixed contact pressure, and constant sliding speed. The experimental conditions are as follows: the contact pressure of 0.98 MPa, the sliding speed of 7.5 m/s, the contact surface temperature of 100°C, the water absorption of brake shoe material is not more than 2%, and the oil absorption rate is 0%. Experimental method is a single braking process.

Curve of transient friction coefficient with time.
As can be seen from Figure 3, under the above-mentioned experimental conditions, the peak value of transient friction coefficient of WSM-3 material is largest at the initial stage of braking; when 8–12 ms, the transient friction coefficient gradually decreases, and the amplitude of the change is also reduced; when about 100 ms, the transient friction coefficient changes are gradually stable, and the median value of transient friction coefficient is up and down at 0.519; and the curves show a certain periodic character. There are two reasons for the above changes: one is that the effect of the viscoelastic characteristics of WSM-3 material and the surface action mechanism when the coupling piece is rubbed. Because the viscoelastic material in the process of deformation is a time-varying process, the recovery process after off-bear is a delaying process, so the stress creep and the stress relaxation of WSM-3 material take place in the braking process, the viscoelasticity of brake shoe material is the root of phenomenon that the transient friction coefficient of WSM-3 material is largest in the initial stage, and the variation amplitude of the transient friction coefficient is larger than that of the latter process. And the other is that the impact of the sample surface waviness which is caused by the vibration of the sampling prototype and structure mechanical strain in the sample grinding process. The periodic variation of the surface waviness of the brake shoe material results in a periodic characteristic of the transient friction coefficient with time.
Variation of transient friction coefficient with the contact surface temperature
The transient friction coefficient curve with the increase in contact surface temperature can be seen in Figure 4. The experimental conditions are as follows: the contact pressure of 0.98 MPa, the sliding speed of 7.5 m/s, and the contact surface temperature changes from 100°C to 350°C. Experimental method is a single braking process.

Transient friction coefficient curve with the contact surface temperature.
As can be seen from Figure 4, when the sliding speed and the contact pressure are kept unchanged, the transient friction coefficient decreases with the increase in contact surface temperature, and the curve is clearly divided into four stages. Between 100°C and 160°C, the mean friction coefficient is 0.482, the maximum value of the transient friction coefficient is 0.506, the minimum value of the transient friction coefficient is 0.465, and the variety range of the transient friction coefficient is 0.041, so the transient friction coefficient is largest and the variety range is small. Between 160°C and 260°C, the mean friction coefficient is 0.462, the maximum value of the transient friction coefficient is 0.484, the minimum value of the transient friction coefficient is 0.443, and the variety range of the transient friction coefficient is 0.392, so the median value of the transient friction coefficient is significantly smaller than that before 160°C, and the variety range of the transient friction coefficient is much bigger than that before 160°C. Between 260°C and 280°C, the mean friction coefficient is 0.459, the maximum value of the transient friction coefficient is 0.477, the minimum value of the transient friction coefficient is 0.437, the variety range of the transient friction coefficient is 0.040, the median value of the transient friction coefficient has continued to decrease, and the variety range of the transient friction coefficient has a significant decline than the stage between 160°C and 260°C. Between 280°C and 350°C, the mean friction coefficient is 0.431, the maximum value of the transient friction coefficient is 0.462, the minimum value of the transient friction coefficient is 0.414, and the variety range of the transient friction coefficient is 0.048, so the median value transient friction coefficient has continued to decline than the stage between 260°C and 280°C, and the variety range of the transient friction coefficient is almost equal to the stage between 260°C and 280°C, although the temperature range Between 280°C and 350°C is much larger than that of Between 260°C and 280°C. The main reasons for the above changes are the effects of the surface film formation—fracture regeneration in the braking process.
Oxidation film. The 16Mn brake disk surface reacts with oxygen molecules in the air to produce oxidation film, which is conducive to overcome the adhesion generated by the direct contact between the metal matrices, but the film has low strength, and hard and brittle features, so it is easily cracked or broken down from the 16Mn brake disk surface in the friction process into abrasive particles, further damaging the surface.
Lubricating film. In the dry friction conditions, due to the high contact temperature, low-melting metals in the WSM-3 material are liquefied at elevated temperatures, and organic binder thermal decomposition produces liquid, so that the expansion of the lubrication point form local lubricating film.
Air-cushion film. During the braking process, when the temperature of the contact surface is higher than 220°C, a large amount of gas (CO, CO2, CH4, etc.) is generated due to the decomposition of the phenolic resin in the WSM-3 material brake shoe, and the oxide film on the surface of the friction antithesis metal can easily absorb the gas, thus forming a local friction surface layer of “air-cushion film.”
Transfer film. In the friction process of the phenolic resin material and metal brake disk friction, the transfer occurs from the phenolic resin material to the brake disk surface and gradually forms a continuous “transfer film” with certain thickness. The continuous transfer film is conducive to reducing the wear of the brake disk. The metal oxide layer on the surface of the phenolic resin material and the transfer film on the surface of the brake disk influence each other. The formation and fracture of the transfer film are also important conditions for adhesion and abrasive wear.
Through the detailed analysis of experimental data, it can be found that in the four kinds of surface films, the formation and fracture of the oxide film and transfer film are direct expressions of friction wear which are related to the life of the friction materials; the formation of lubricating film and air-cushion film directly affects the friction coefficient of the friction plate changes, thus affecting the braking performance.
In the experiment, the mass percentage of the mixed fibre resin brake shoe is as follows: mixed fibre 50%, phenolic resin 15%, wear-resistant particles 20%, and filler 15%. The phenolic resin as the binder in the material is the core of the friction plate. During the braking process, when the temperature is about 220°C, the phenolic resin of brake shoe conducts thermal decomposition and generates large amounts of liquid and gas. The phenolic resin is mainly composed of phenol, 2-methylphenol, 4-methylphenol, 2,6-dimethylphenol, 2,4-dimethylphenol, and 2,4,6-trimethylphenol; the gas mainly includes CO, CO2, and CH4. These fluids act as a lubricating film during braking, and the formation of local air cushions between the brake pairs reduces the contact pressure between the friction shoe and the brake disk. The results show that the transient friction coefficient of the friction shoe decreases. As the temperature increases, the decomposition movement is more and more intense, resulting in corresponding increase in liquid and gas, the role of lubrication is more and more obvious, and the transient friction coefficient of the brake pair is gradually reduced. Therefore, the thermal decomposition of the resin is an important factor in the frictional heat degradation of friction materials.
From the above analysis, we can see that the root cause of thermal recession is the generation of lubricating film or air-cushion film, in order to better explain the nature of the causes of thermal decline, we use the fluid lubrication model to be analyzed here focused on the analysis of the lubricating film, air-cushion film is a local and small amount and can be equivalent to the dynamic pressure changes of lubricating film.
According to the theory of hydrodynamic lubrication, the motion of the fluid generated by the thermal cracking of the friction plate conforms to the motion of Newtonian fluid. When the fluid flows through the convergence space between the friction disk and brake shoe, the hydrodynamic pressure is established in the space to form a hydrodynamic lubricating film separating the two surfaces. The theoretical basis of hydrodynamic lubrication is the Reynolds equation, which is based on the two basic conditions of fluid force balance and flow continuity in fluid space. The brake shoe makes tangential movement relative to the friction disk. Figure 5 shows the space coordinate system, where the coordinate origin is in the friction plate and the x-axis is parallel to the relative motion of the friction pair. Based on these two basic conditions, the general differential form of the fluid Reynolds equation can be deduced as follows


Fluid lubrication model.
Using the boundary conditions of equation (1), make a simplified calculation as follows

By lubricating film bearing capacity, we obtain

Then, the friction coefficient is derived as
where P is the dynamic pressure of the fluid (Pa), η is the dynamic viscosity of the fluid (Pa·s), h is the lubricating film thickness (mm), and υ is the relative velocity of the friction pair (m/s).
These four parameters are the key factors affecting the brake friction coefficient; with the increase in temperature, the composition of the fluid changes and the values of p, η, and h are also affected by the impact of the temperature and fluid composition. The transient friction coefficient becomes small with it; solving formula (5) requires generating simultaneous viscosity equations, density equations, and film-thickness equations with the help of computerized numerical calculation.
From the above analysis, we can draw the following conclusion: for the resin friction material brake shoe, as long as the heat resistance of the resin is improved (i.e. to improve its thermal decomposition temperature) and its decomposition and oxidation rates are decreased, the brake shoe will have the stable friction properties. The use of various modified phenolic resin (modified by the melamine, cashew nut shell oil, nitrile rubber, etc.) can greatly improve the decomposition temperature of the resin.
As can be seen from Figure 6, the transient friction coefficient decreases with the increase in sliding velocity. The experiment is carried out under the conditions of contact pressure of 0.98 MPa, and the contact surface temperature is uncontrolled. In 2.5–6 m/s stage, the median value of transient friction coefficient is relatively constant, and the variation range is also small; in the range of 6–16 m/s, the median value of transient friction coefficient decreases, and the change range increases compared with that of 2.5–6 m/s; and in 17.5–18.5 m/s, the transient friction coefficient appears to show an abrupt change phenomenon, and the value of transient friction coefficient has a significant reduction. The reasons for the above changes are as follows: with the increase in sliding speed, heat productivity is much greater than heat loss, and the degradation of the resin adhesive property near the contact surface leads to the large decrease in the transient friction coefficient. When the velocity is higher than 18.5 m/s, the transient friction coefficient tends to be constant, the change range is very small, and the system enters the new friction mechanism.

Transient friction coefficient curve with sliding velocity.
Mean friction coefficient with the operating parameters
The mean coefficient of friction is the average value of the transient friction coefficient after the friction reaches the steady state in the second half of a single braking process, denoted by the symbol µ.
The experimental results which are shown in Figure 7 are as follows: the sliding speed is 7.5 m/s, the contact pressure range is set at 0.6, 0.8, 1.0, 1.2, 1.4, and 1.6 MPa, the variation laws of the average friction coefficient of brake shoe material with the change of contact surface temperature are shown in Figure 7.

T–µ curves with constant sliding speed of 7.5 m/s.
As can be seen in Figure 7, when the sliding velocity is 7.5 m/s, the mean friction coefficient under different contact pressures has the same general trend with the increase in the contact surface temperature, and they all decrease with the increase in contact surface temperature; the linearity of the average friction coefficient curve is the best when 1.4 MPa; and from the interval analysis, in the temperature range of 100°C–350°C, the higher contact pressure leads to a decline in larger mean friction coefficient.
The experimental results which are shown in Figure 8 are as follows: the sliding speed is 7.5 m/s, the contact surface temperature range is set at 100°C, 150°C, 200°C, 250°C, 300°C, and 350°C, and the variation laws of the mean friction coefficient of brake shoe material with the change in contact pressure are shown in Figure 8.

P–µ curves with constant sliding speed of 7.5 m/s.
As can be seen from Figure 8, when the sliding velocity is 7.5 m/s, the mean friction coefficient under different contact surface temperatures has the same general trend with the increase in the contact pressure, and they all increase with the increase in contact surface temperature. The curves of the mean friction coefficient at 100°C, 150°C, and 200°C are basically similar. The curves of the mean friction coefficient at 250°C, 300°C, and 350°C basically have similar characteristics. The maximum value of the mean friction coefficient at 100°C, 150°C, 200°C, 250°C, 300°C, and 350°C is 0.512, 0.502, 0.494, 0.470, 0.458, and 0.446, respectively; the minimum value of the mean friction coefficient at 100°C, 150°C, 200°C, 250°C, 300°C, and 350°C is 0.472, 0.464, 0.452, 0.446, 0.430, and 0.422, respectively; and the amplification of mean friction coefficient at 100°C, 150°C, 200°C, 250°C, 300°C, and 350°C is 7.81%, 7.57%, 8.50%, 5.11%, 6.11%, and 5.38%, respectively, so that from the temperature interval analysis, the amplification of mean friction coefficient of
The friction process shown in Figures 7 and 8 is comprehensively analyzed as follows: when the sliding speed is kept constant (7.5 m/s as shown), the contact surface temperature error control is in the range of ±5°C:
The mean friction coefficient of WSM-3 increases with the increase in contact pressure, but not much, for example, when the contact surface temperature is 150°C and the contact pressure increases from 0.6 to 1.6 MPa, the mean friction coefficient increases from 0.462 to 0.502, and the growing rate is 8.19%.
The general trend of the mean friction coefficient change: at the contact pressure range (0.6–1.6 MPa), the mean friction coefficients at each contact surface temperature affected by the contact pressure is not much of a difference in the general trend. The maximum growing rate 10.42% occurs at the mean friction coefficient curve of 350°C, and the minimum growing rate 6.51% occurs at the mean friction coefficient curve of 300°C. The experimental results show that the mean friction coefficient of WSM-3 material is not sensitive to the increase in contact pressure.
The mean friction coefficient curves at 100°C, 150°C, 250°C, and 300°C are not only small but also the change in the mean friction coefficient is basically proportional to the change in the contact pressure value, and the rate of variation of the mean coefficient of friction at the four kinds of contact surface temperatures is almost equal, for example, the mean friction coefficient increases from 0.472 to 0.512 when the contact pressure increases from 0.6 to 1.6 MPa under the conditions of the contact temperature of 100°C and sliding speed of 7.5 m/s, so that,
When the contact surface temperature is at 100°C, 150°C, and 250°C, and when the contact pressure is less than 1.2 MPa, the mean friction coefficient is affected obviously by the increase in the contact pressure value, that is, the growing rate is large, but when the contact pressure is less than 1.2 MPa, the mean friction coefficient is affected slightly by the increase in the contact pressure; however, when the contact temperature is at 200°C, 300°C, and 350°C, and when the contact pressure is not more than 1.2 MPa, the average friction coefficient is affected by the increase in the contact pressure value, but when the contact pressure is greater than 1.2 MPa, the mean friction coefficient has less effect with the increase in the contact pressure value.
Let the actual contact area between the brake shoe and the brake disk be A0 and the shear stress per unit area of the brake shoe surface is τ, then the mean friction coefficient can be described by equation (2)

where
According to formula (6), if the contact pressure growth rate results in the greater actual contact area growth rate, the mean friction coefficient will increase; in contrast, if the ratio of the increasing actual contact area is smaller than the increasing rate of the contact pressure, the mean friction coefficient will decrease. The reasons are as follows: when the contact pressure is low, there are more asperities on the surface of brake shoe; with the increase in contact pressure, the number of actual contact asperities on the surface of brake shoe increases, so the actual contact area increases; during the experiment, because the contact pressure is small, the increasing rate of the actual contact area is greater than the increasing rate of the contact pressure, so the mean friction coefficient tends to increase.
The mean friction coefficient curves of brake shoe material with the increase in contact surface temperature are shown in Figure 9, and the experimental conditions are under the condition of contact pressure of 0.98 MPa, the sliding velocity is set at 2.5, 5, 7.5, 10, 12.5, 15, 17.5, and 20 m/s.

As can be seen from Figure 9, under the condition of contact pressure of 0.98 MPa, the mean friction coefficient changing trend at different sliding speeds is consistent with the increasing trend of the contact surface temperature, that is, the mean friction coefficient increases with the increase in contact pressure. The mean friction coefficient curve characteristic of 7.5, 5.0, and 2.5 m/s is similar. From the interval observed, in the contact surface temperature range of 100°C–350°C, the growing rate of the mean friction coefficient under the three velocities is similar; the growing rates of
The mean friction coefficient curves of brake shoe material with the sliding velocity are shown in Figure 10, and the experimental conditions are under the condition of contact pressure of 0.98 MPa: the contact surface temperature is set at 100°C, 150°C, 200°C, 250°C, 300°C, and 350°C.

As can be seen from Figure 10, under the condition of contact pressure of 0.98 MPa, the mean friction coefficient changing trend at different contact surface temperatures is consistent with the increasing trend of the sliding velocity, that is, the mean friction coefficient decreases with the increase in sliding velocity; Observed from the interval, when the sliding velocity is less than 12.5 m/s, the mean friction coefficient’s decreasing rate of the six kinds of temperature is similar; from the graphical point of view, they are similar to the parallel. When the sliding velocity is more than 12.5 m/s, the decreasing rate decreases, and the curves tend to change gently and and are accompanied by a small oscillation.
The friction process shown in Figures 9 and 10 is comprehensively analyzed as follows: when the contact pressure is kept constant (0.98 MPa as shown), the contact surface temperature error control is in the range of ±5°C:
The mean friction coefficient of brake shoe material decreases with the increase in sliding velocity, for example, when the contact surface temperature is set at 150°C, the mean friction coefficient decreases from 0.492 to 0.410, and the curve has a decline of 16.67% when the sliding velocity increases from 2.5 to 20 m/s. Compared with Figures 7 and 8, a conclusion can be drawn that for the WSM-3 brake shoe material, the effect of the increase in the sliding velocity on the mean friction coefficient is greater than the effect of the contact pressure on the mean coefficient of friction.
The general trend of the mean friction coefficient change: at the sliding velocity range (2.5–20 m/s), the mean friction coefficients at each contact surface temperature affected by the sliding velocity have remarkable influences in the general trend. The maximum decreasing rate 21.05% occurs at the mean friction coefficient curve of 350°C, and the minimum decreasing rate 13.04% occurs at the mean friction coefficient curve of 200°C. The experimental results show that the mean friction coefficient of WSM-3 material is sensitive to the increase in sliding velocity. Let υ be the sliding velocity, and the constants a, b, c, and d are determined by material properties and load, then the mean friction coefficient can be expressed by equation (3); from equation (3), when the sliding velocity is low, the bracket term plays a major role, and then the friction coefficient increases with the increase in sliding velocity; when the sliding velocity is high, the exponential term will play a major role, that is, the mean friction coefficient decreases with the increase in sliding velocity. In this article, the experimental range of sliding velocity is 2.5–20 m/s; for WSM-3 materials, the sliding velocity range of 2.5–20 m/s is relatively low, and the exponential term plays an important role

At all six contact surface temperatures, especially when the sliding speed is less than 12.5 m/s, the mean friction coefficient curves of the decline trend is consistent, that is, the decline of each mean friction coefficient is large, the variation range of the mean friction coefficient is substantially inversely proportional to the variation range of the sliding velocity, and the inverse proportion coefficient at the different contact surface temperatures is substantially equal, for example, under the condition of the contact pressure of 0.98 MPa and the contact surface temperature 250°C, when the sliding velocity increases from 2.5 to 12.5 m/s, the mean friction coefficient of brake shoe material decreases from 0.450 to 0.380, from
At different contact surface temperatures, the mean friction coefficient with the change in the sliding velocity presents different characteristics. The experimental results have verified that there is a specific sliding velocity in the vicinity of 12.5 m/s at the mean friction coefficient curves of 200°C and 350°C; when the sliding speed is less than the specific value, the mean friction coefficient decreases by a great extent with the increase in sliding velocity, but when the sliding velocity exceeds this specific value, the mean friction coefficient does not change basically with the sliding speed; however, the existence of the particular sliding velocity value cannot be manifested obviously from the mean friction coefficient curves at the contact surface temperature of 100°C, 150°C, 250°C, and 300°C.
The process-dependent characteristic of the mean friction coefficient is shown obviously from the analysis of Figures 7 and 9. As shown in Figure 7, in the process of increasing the contact pressure, when the contact pressure is
Wear mechanism of brake shoe
Figure 10 is a batch of the scanning electron micrographs (SEM) of the worn surface of the brake shoe; the experimental equipments select the Hitachi high-tech desktop microscope TM3000/TM3030 dedicated energy spectrometer SwiftED3000.
The SEM of the brake shoe’s worn surfaces under different contact surface temperature are shown in Figure 11. The wearing experiments were carried out under the conditions of the sliding speed of 7.5 m/s, a contact pressure of 0.98 MPa, and a revolution of 5000. Figure 8 shows that when the contact surface temperature is low as

Wearing morphology of the brake shoe: (a) 100°C, (b) 150°C, (c) 200°C, (d) 250°C, (e) 300°C, and (f) 350°C.
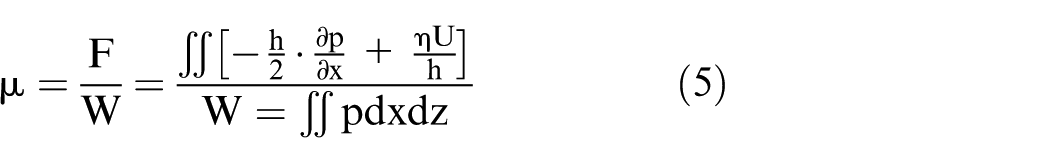
From Figure 12, we can see that the element composition and distribution of the brake shoe surface have much difference under different contact surface temperatures. The phenolic resin as the binder in the material is the core of the friction plate, when the temperature is about 220°C, the phenolic resin of the brake shoe conducts thermal decomposition, the removal of benzene, formaldehyde and other free components and methane, carbon monoxide, carbon dioxide and other gas substances, the free components at high temperature is gaseous, liquid at low temperature, and then the contact surface will form a liquid–gas interface.
Energy spectra of brake shoe: (a) 100°C and (b) 350°C.
The TG test was carried out with the instrument NETZSCH TG 209 F3, and the differential scanning calorimetry (DSC) test was carried out with the instrument DSC Q2000 V24.11 Build 124. As can be seen from the TG curve shown in Figure 13(b), the test begins to heat from 100°C and a small weight loss occurs shortly after the start because of the evaporation of the water molecules adsorbed by the composite. When the contact surface temperature is 150°C, the hot weight is 99.083% and the weight loss rate is 0.917%. After the temperature exceeds 150°C, the brake shoe material starts losing weight slowly, the hot weight at 200°C is 97.562%, the weight loss rate is 2.438%, the heat weight at 300°C is 94.503%, and the weight loss rate is 5.497%. When it comes to 400°C, there has been a serious weight-loss phenomenon. Generally, T5%, T10%, and T50% have been used to describe the thermal stability of polymer materials: T5% = 275.192°C, T10% = 394.46°C, and T50% = 889.07°C. But taking the binder in the composite material content into account, when T is 250°C, the binder has a very serious weight loss.

(a) DSC and (b) TG curves of brake shoe.
In view of the fact that the decomposition temperature of the phenolic resin is 220°C, in order to avoid damage to the instrument, the temperature range of the DSC thermal analysis is 10°C–200°C, but no endothermic and exothermic peaks are observed in the temperature range, so we can see that the brake shoe’s endothermic and exothermic peaks’ temperature is greater than 200°C. In the temperature range of 10°C–200°C, the asbestos brake shoe material presents a relatively slow endothermic process, because the brake shoe material has no fixed melting point. With the increase in temperature, the material matrix gradually softens and slowly forms endothermic process. In general, the endothermic peak occurs due to the melting of the bonding material caused by heat absorption which has a lower melting point; accompanied by the melting of the bonding material, the thermal decomposition of organic matrix material occurs, and thermal decomposition is an exothermic process, so the exothermic peak occurs due to the thermal decomposition of the matrix material. The above analysis shows that the brake shoe below 200°C has better thermal performance; in the low temperature range, the material properties generally do not show a qualitative change: there is no melting, degradation, rapid weight loss, and other qualitative change phenomenon.
Conclusion
In this article, the experimental results show that the WSM-3 resin matrix composite brake shoe has the following characteristics:
The essence of the transient/mean friction coefficient significant decline is the dynamic lubrication friction of the lubricating film or air-cushion film; the films are generated by the resin-based brake shoe material’s thermal deterioration.
From the analysis of Figures 8 and 10, it has been proved that the mean friction coefficient has a process-dependent characteristic.
The mean friction coefficient of WSM-3 increases with the increase in contact pressure and decreases with the increase in sliding velocity; the influence of the sliding velocity on the mean friction coefficient of WSM-3 material brake shoe is much greater than that of the contact pressure.
The necessity of considering the transient/mean friction coefficient as the variable has been proved. The change in the material friction process has high nonlinearity and the condition factors have strong coupling; these two features lead to the possibility of the transient/mean friction coefficient mutation.
Through the observation of microstructure and the results of thermal analysis, the influences of different contact surface temperatures on the wear of brake shoe have been analyzed.
Footnotes
Academic Editor: Xiaotun Qiu
Declaration of conflicting interests
The author(s) declared no potential conflicts of interest with respect to the research, authorship, and/or publication of this article.
Funding
The author(s) disclosed receipt of the following financial support for the research, authorship, and/or publication of this article: This study was financially supported by the Shanxi major science and technology projects (grant no. 20111101040) and the Youth science and technology research foundation of Shanxi Province (grant no. 201601D021084).