
Abstract
The non-dominated sorting genetic algorithm II is used to design the microvascular networks embedded in self-healing polymeric materials. And the fluid simulation software Fluent is used to validate the optimization result obtained by non-dominated sorting genetic algorithm II. Two objective functions are considered, namely, the void volume fraction and flow efficiency. A total of 222 solutions are obtained, and the head loss is in the range of (3.88 × 10⁻⁷ m, 2.36 × 10⁻⁶ m), whereas the void volume fraction is in the range of (4.39%, 5.12%). The simulation velocities are close to optimization velocities. The average error rate of selected solutions (a), (b), and (c) is 22.6%, 26.4%, and 35.2%, respectively.
Keywords
Introduction
In the modern society, polymer matrix composites (PMC) are being widely used in many areas, such as aerospace industry, automotive, and construction due to their advantages including high specific strength and stiffness, corrosion resistance, electromagnetic transparency manufacturability, and design flexibility. However, in the process of the use and transportation of the polymer composites, the material is prone to produce micro-crack when suffered excessive stress, cyclic mechanical, and overload. Once the micro-crack is generated, with the crack growth, the properties of the polymer composites material will decrease dramatically. And eventually cause the failure of the polymer composites material. One way to solve the problem is to repair the material in time when the micro-crack is generated.1,2 Self-healing materials are capable to repair the micro-crack autonomically to ensure the performance of the material, thereby avoiding the failure of material and prolonging the service life of the material.
According to the principle of self-healing, the self-healing systems are divided into intrinsic and extrinsic self-healing systems.3–5 And the approaches to extrinsic systems include microcapsules of healing agent, hollow fibers, and microvascular networks. Intrinsic systems can repeatedly heal damage, but have strict request for the molecular structure of substrate material and it is difficult to demonstrate product. 6 As for the extrinsic systems, microcapsule7–10 and hollow fiber11,12 self-healing systems have been proven to be of high healing efficiency, but for the same crack, can only achieve a single repair. The microvascular network systems,13–20 also belong to the extrinsic systems, are capable of multiple healing cycles and can be applied to a variety of substrate material. Toohey et al.21,22 have demonstrated repeated healing of a polymeric material with embedded microvascular networks to supply the healing agent. When a crack is formed in the polymer composites material, the expansion of the crack will lead to the breakdown of the embedded microvascular networks. And then, the healing agent is released to repair the material. The healing process can be repeated as long as the three-dimensional microvascular network embedded in the polymeric substrate provides enough healing agent. Williams et al. have developed and test a vascularized composite sandwich structure. The embedded network has little effect on the performance of the material. The vascularized composite sandwich structure can fully recover while the samples are successfully infiltrated either in single or dual networks.23,24
Recent studies tend to design and optimize these microvascular networks for healing with minimized impact on performance of polymer composites material. Various methods have been put forward for the design of networks.25,26 In the process of optimization, the influence of embedded network on the matrix material’s structural integrity needs to be considered. On the one hand, the absence of the material replaced by the embedded network will reduce the mechanical properties of the material. So, the void volume left by the network is an objection function. On the other hand, sufficient energy is required to drive the healing agent in the network, thus flow efficiency is a key objective function.27,28 In addition, there is a compatibility problem between the network and the matrix material. However, the improvement of flow efficiency will inevitably increase the void volume left by the network. In other words, the objective functions conflict with each other. The optimization of the microvascular network is a multi-objective problem.
When considering multiple objectives, there is a need to capture the tradeoff between those objectives. Various intelligent algorithms have been introduced to solve multi-objective optimization problem (MOOP), such as the simulated annealing (SA), particle swarm optimization (PSO), and the genetic algorithms (GA). Among these methods, GA is applied for several reasons as follows. First and foremost, GA can search the best solution directly and more likely to acquire the global optimum result. Besides, GA can readily be hybridized with other search techniques. Finally, GA does not require any knowledge about optimal solutions.
In this article, the non-dominated sorting genetic algorithm II (NSGA-II) is used to optimize the topology of microvascular network. The NSGA-II uses the concept of Pareto optimality which takes into account all objectives simultaneously to determine the best candidate solutions. This is also a major reason for the selection of NSGA-II. The objective functions considered in this article are as follows: (1) minimizing the void volume fraction and (2) maximizing the flow efficiency. After NSGA-II optimization, the process of the liquid flow in the channels of network is carried out using computational fluid dynamics (CFD). Finally, the simulation results and NSGA-II optimization results are compared and analyzed.
This article is organized as follows: Section “Microvascular network representation” presents the mathematical model used for representing the microvascular network and the matrix material. Section “NSGA-II” gives a brief overview on the multi-objective GA and introduces the objective functions and constraints used in the work. In section “Results and discussion,” optimization results are discussed and fluid simulation is used to validate the feasibility and effectiveness of both the mathematical model and optimization method. Finally, we conclude this article in section “Conclusion.”
Microvascular network representation
The mathematical model of a microvascular network is shown in Figure 1. The microvascular network model consists of two parts. First, the part of the matrix material is represented by a domain Ω. Second, the part of microvascular network is represented by a graph data structure. The resin with the low viscosity epoxy E51 (618) is selected as the matrix material. And the curing agent is the modified amine epoxy resin curing agent A50. The mathematical model size is

Mathematical model of the microvascular network: S represents inflows and T represents outflows.
The optimization process starts from the microvascular network model over a
NSGA-II
Since their introduction, more than five decades ago, GA has been widely reckoned as a highly efficient tool for the optimization of complex design problems. GA is population-based methods where candidate solutions develop toward better configurations according to the objective functions for the problem considered in the process of optimization. The simple GA is usually used for a single-target optimization problem. A linear combination of weighted objectives is usually used if the optimization is a multi-objective problem. However, the determination of the weighting factors tends to have a great influence on the optimization results. Compared to the simple GA to solve MOOP, multi-objective evolutionary algorithms (MOEA) can obtain better results. MOEA can capture the tradeoffs between competing objectives. During the iterations, more competitive solutions are selected by comparing all objectives, and dominated candidates are likely to be discarded in subsequent generations. For this work, the adopted multi-objective GA is called the NSGA-II which is attributed to Deb et al. 29 This method employs the concept of Pareto optimality to identify the population at each generation.
Design objective functions and constraints
The design of network is very complicated, especially in the MOOP. It is desirable to reduce the void volume left by the network to minimize the interference on the matrix material. However, the increase in the flow efficiency of the network often necessitates an increase in the diameter of the network channels. The mathematical representation of the objective functions is introduced as follows.
Objection function,
In order to improve the flow efficiency, the head loss in the network is kept to a minimum. Then, the quantitative evaluation of the flow efficiency is achieved through the computation of the minimum head loss in the network. Assuming laminar flow, the head loss in microchannel can be expressed through Hazen–Williams 30 equation of the classical Hardy-Cross method

where U is the resistance coefficient, m and n are the flow exponent. For normal temperature water, n = 1.852 and m = 4.87.

where C is the pipe roughness coefficient. In the case of water flow through pipe, the flow in is equal to the flow out at each junction in the pipe and the total directional head loss along any loop in the system is zero. The method of balancing heads uses an initial guess that satisfies continuity of flow at each junction and then balances the flows until continuity of potential is also achieved over each loop in the system.
Objection function,
As described previously, the microvascular network has a direct impact on the structure integrity of the matrix material. In order for self-healing materials to be considered feasible, the void volume fraction should be limited to below
In the finite element analysis, the model is divided into

Finite element model of pure epoxy resin with network. The void volume fraction is 5.13% and the failure is 232.3 N.
Table 1 shows the simulated results of three-point bending of resin material with pipe network. When the pipe diameter is very small, there is a strengthening effect on the material, and then, as the void volume fraction increases, the performance of the material decreases. When the void volume fraction is less than 5.13%, the effect of the material is very small, and the failure load is 232.3 N when the void volume fraction is 5.13%.
Simulated results of three-point bending of resin material with pipe network.

To achieve a minimally invasive network, we aim to minimize the network’s void volume fraction. The void volume fraction’s objective function

where k is the number of pipes,
NSGA-II to solve the optimal problem
The NSGA-II procedure starts by generating a random initialization population (
The complete procedure of the NSGA-II is given below.

In the process of optimization, the parameters of NSGA-II show as follows. The initial population size is 800. The crossover probability is 0.8, and the mutation probability is 0.2. The off-springs’ population size after crossover and mutation operations is 800. Finally, the maximum number of iterations
Results and discussion
This section starts with the description of a typical multi-objective optimization using NSGA-II and then compared with the fluid simulation results to verify the reliability of network optimization.
Multi-objective constrained optimization
To illustrate the optimization process, consider a double inflow and double outflow diagonal network template on a
Figure 3 shows the optimization results at generations t = 1000, t = 2000, t = 4000, t = 6000, t = 8000, t = 10000, and t = 12000, respectively. As the generation number grows, more Pareto solutions are discovered, and finally, the composition of the solutions has no change. The number of Pareto solutions increased from 81 to 222. Obviously, the volume fraction of the network and the head loss is negatively correlated. The head loss is in the range of (7.33 × 10⁻⁷ m, 1.83 × 10⁻⁶ m), and the void volume fraction is in the range of (4.81%, 5.13%) at generation t = 1000. However, the head loss is in the range of (3.88 × 10⁻⁷ m, 2.36 × 10⁻⁶ m), and the void volume fraction is in the range of (4.39%, 5.13%) at generation t = 1200. The scope of the optimization result is getting broader, and the optimization result is getting better as the iterations’ number increases. In other words, when comparing two candidate solutions, the candidate of latter generation is always better in at least one objective while not being worse in the other objective than the candidate of former generation. In addition, the volume fraction of each individual is less than 5.13% and meets the condition of constraint.

Optimal Pareto frontiers at different generations.
After 12,000 generations for a population size

Optimization results after 12,000 generations for a population size
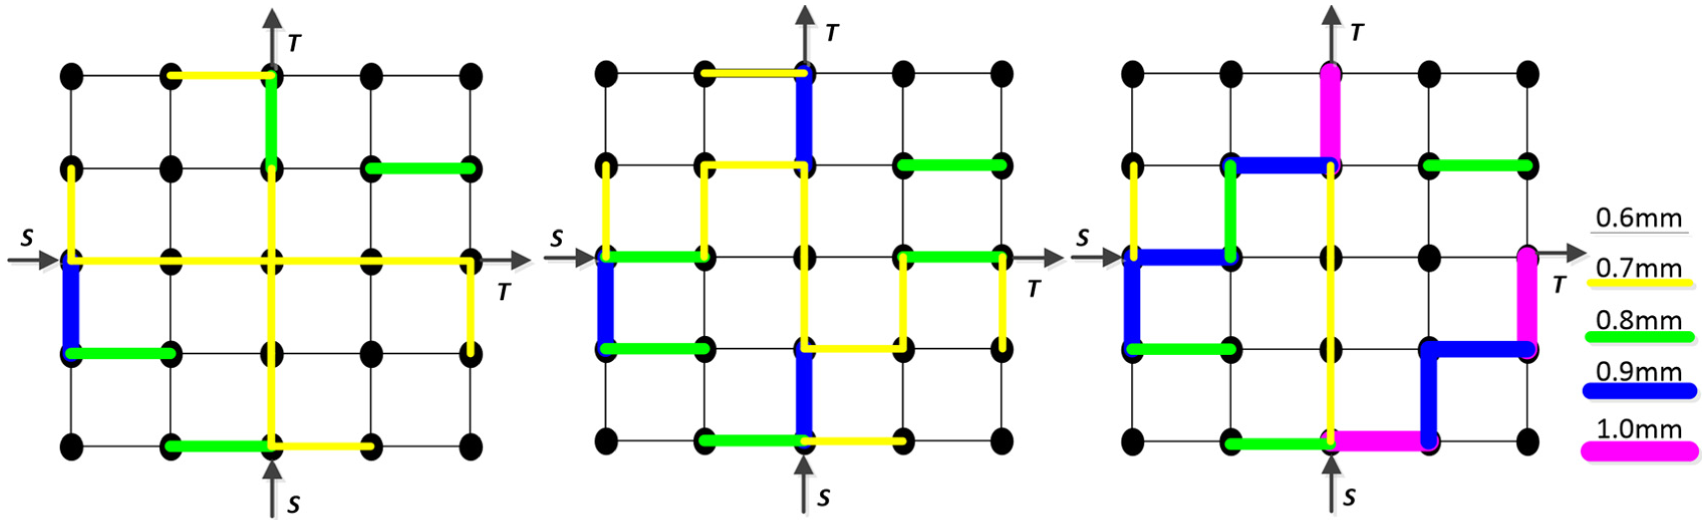
Topology of the network labeled (a) through (c). Black, yellow, green, blue, and magenta denote the diameter 0.6, 0.7, 0.8, 0.9, and 1.0 mm, respectively. S represents inflows and T represents outflows.
Fluid simulation validation
The fluid simulation software Fluent is used to validate the feasibility and effectiveness of both the mathematical model and optimization method. According to user demand and a variety of complex physical flow phenomena, Fluent adopts different formats and discrete numerical methods to efficiently solve complex computational problems. In this work, every model is established by AutoCAD 2013, then import ANSA to mesh. Fluent carries various sets and computes the mesh files exported. The selected three double inflow and outflow models are considered. Flow boundary conditions comprise a prescribed flow rate of
Figure 6 shows the velocity vectors of solutions (a), (b), and (c) colored by velocity magnitude (m/s) in

Velocity vectors of solutions (a), (b), and (c) colored by velocity magnitude (m/s) in z = 0. S represents inflows and T represents outflows. The right side of Figure 6(a) is the partial enlarged view of the inlet and the outlet.
Channel fluid velocity values obtained by the fluid simulation technique, measured at the each microchannel illustrated in Figure 5.

The results are compared to the optimization velocity by relative ratio. For the convenience of observation, the velocity magnitude is in × 106 m/s.
Conclusion
In this article, the topology structure of microvascular flow networks is studied using the NSGA-II. The algorithm captures adequately the tradeoff between conflicting objective functions, which includes the flow efficiency and void volume fraction. The Hardy-Cross iterations are used to quantize the flow efficiency. The finite element technique is used to determine the boundary of void volume fraction. And the fluid simulation software Fluent is used to validate the feasibility and effectiveness of both the mathematical model and optimization method. The following conclusions can be drawn:
A set of effective Pareto solutions are obtained using the NSGA-II. As the generation number grows, the number of Pareto solutions increased from 81 to 222. Finally, the head loss is in the range of (3.88 × 10⁻⁷ m, 2.36 × 10⁻⁶ m), whereas the void volume fraction is in the range of (4.39%, 5.12%). The void volume fraction is in inverse proportion to the head loss.
The fluid simulation is used to validate feasibility and effectiveness of NSGA-II. The simulation velocities are close to optimization velocities. The average error rate of selected solutions (a), (b), and (c) is 22.6%, 26.4%, and 35.2%, respectively. And the error is bigger in the place where the flow rate is very small.
Footnotes
Academic Editor: Filippo Berto
Declaration of conflicting interests
The author(s) declared no potential conflicts of interest with respect to the research, authorship, and/or publication of this article.
Funding
The author(s) disclosed receipt of the following financial support for the research, authorship, and/or publication of this article: This research was supported by the National Natural Science Foundation of China (grant no. 51365012).