
Abstract
Public transit services should be fast and reliable. Complex road conditions, however, make them slow and fluctuate. Therefore, to reflect the impact of road traffic conditions for buses running, we should take both fast and reliable into consideration. This article uses GPS data of buses, proposes an integrated method for urban transit evaluation and optimization, including a bus running index calculation method which based on bus planning travel time and focusing on bus main roads, as well a bus timetable optimization method which faces a bus corridor. In order to verify the effectiveness, this article selects a bus main road on Yan’an Road between Shimen Road No. 1 Stop to Kaixuan Road Stop in Shanghai, China, as a case. Through this case study, this article verifies that the proposed bus running index can objectively and sensitively evaluate bus running conditions. Meanwhile, the result of bus timetable optimization shows good efficiency. On top of that, by contrast with the traditional single-line-based transit evaluation and optimization method, the proposed integrated evaluation and optimization method has an advantage in the sample volume size and calculation effectiveness.
Introduction
Planning affects greatly on bus running, and bus operating environment is important for bus planning and managing. Therefore, it requires an effective method to evaluate and optimize bus operating environment. Bus running time, which performs as an important indicator of public transportation system, appears throughout all aspects of transit planning, operations, scheduling, and so on. Moreover, it is the fundamental basis for the development of bus timetable.
In the aspect of urban transit evaluation, the method which uses index is commonly acknowledged since it has its efficiency in a complex transit environment. With the wide application of traffic performance index (TPI), bus running index (BRI) has also been proposed. BRI, also known as public traffic congestion index or public traffic cost index, was used to measure the traffic congestion in an area with extra time than original. Because the reasons of public traffic jams or wasting time also depend on the road and signal designing in this area, it also reflects the region’s transportation cost index. Based on urban transit evaluation, transit agencies need to make and optimize transit plannings such as timetable. Bus running time is the fundamental basis for the development of bus timetable. Therefore, to obtain a practical bus timetable, we need to scientifically estimate bus running time first.
Traditionally, bus travel time or speed shows the rapidity of bus transit; they usually be considered as the key indicator of bus running evaluation, and its length is directly related to the smooth operation of buses. Nowadays, with the growing popularity of intelligent transport system (ITS) philosophy and applications, as advanced public transportation system (APTS) develops rapidly, bus travel time becomes much more important. Moreover, as a significant part of advanced traffic information system (ATIS), dynamic and real-time bus arrival information plays a significant role on decreasing passengers’ waiting time, improving service level, attracting people traveling by bus, and so on. 1
Besides rapidity, reliability is also an important factor in the evaluation of public transport services. Through city’s development, travelers consider not only the length of travel time but also the reliability of travel time. Since the environment of buses running is very complex, it is very difficult to improve bus running reliability. Current research works and practical applications on the reliability of public transport always focus on a single bus line, but the previous studies have shown that operating environment is the main factor which affects the reliability of bus running.2–6 The main measures to enhance bus running reliability, such as setting up bus lanes and providing bus priority signal, are all based on sections of road, not a single bus line. Meanwhile, this reliability evaluation method based on multi-lines has advantage on increasing the amount of data samples, improving result’s adaptability, reducing costs, and optimizing for determining new line’s bus running time.
A bus main road is the sections of road which have a number of bus lines covering; it can also be considered as a bus corridor, in the transit aspect. These roads have more buses running through and are suitable for bus running environment evaluation and management optimization. Besides, an integrated evaluation and optimization method which contains several bus lines has its advance in data mining and calculating efficiency, which is important in a complex urban transit environment. This article focuses on bus main roads, develops an integrated method for urban transit evaluation and management optimization, which contains a BRI calculating method based on rapidity and reliability to evaluate bus running environment and a corridor-based bus timetable optimization method. With the support by emerging technology, this article uses GPS data from buses as data sources to analyze bus running processes, excludes error from artificial survey data, and expands effective sample size without increasing the cost of data collection.
Literature review
BRI
In theoretical research, index is a special relative number to measure comprehensive changes in different occasions for multiple projects. It has comparable, convenient, and many other advantages in the evaluation process. Index is a concept in economics originally; researchers raised TPI using index evaluation method. TPI is the combination of traffic congestion index and traffic operation index and is a conceptual index value which comprehensively reflects whether road network is smooth. TPI makes traffic congestion digitized. The calculation method of traffic congestion evaluation is based on some data like road speed, road traffic density, traffic flow, and travel time. Among them some methods are typical, like INRIX index which calculates traffic congestion index based on road speed 7 and Roadway Congestion Index (RCI) which calculates it by road traffic density. 8
Compared with research progresses on TPI, bus performing index (BPI) is in its infancy, especially BRI has not been maturely applied in practice. In urban road system, bus system has many particularities, mainly refer to the public target for planning services, compared with personalized goal of private cars. Since buses’ running process has many parts such as bus stops, reasons which cause buses’ travel time not stable are more complex than private cars. Travelers’ requirements for buses’ travel time are reliable and, however, are much more than private cars’. Therefore, it is necessary to make a separate study on BRI. Traditionally, evaluation of public transport index reflects mainly buses running time or delivery time.2–5,9
Bus travel reliability means that buses could travel between bus stops within a certain time frame in a certain running environment and road conditions. As a basis for public transport vehicle scheduling management and bus dynamic information services, bus travel time reliability plays an important role on public transportation services, this makes bus travel time reliability evaluation becomes an important indicator of bus operation. HS Levinson reviewed transportation service reliability studies. 10 In the traditional sense, indexes which characterize bus travel time reliability can be divided into three categories: statistical measures, buffer measures, and tardy trip indicators.11–14 Besides, probability indicators are also used to describe travel time reliability. In recent years, supported by data from AVL and IC card system, researchers have proposed much more methods and a broader perspective of bus system reliability analysis.15–23
In application research, TPI applications have many successful experiences at home and abroad. For example, the United States publishes “City Patency Report” annually, selects traffic congestion index and other indicators, and periodically assesses and releases to the public. With the continuous advance of China’s traffic information, many cities have defined their own TPI and received good results. Among them, Beijing took congested mileage proportion as basis, Shanghai based on speed and load degree, and Shenzhen considered the ratio of travel time. With the development of urban public transport and the maturity of urban transport index, urban public transport index has been proposed and introduced into practical application. Shenzhen uses passenger questionnaires, complaints, and other ways to collect data and issues public transportation service index based on three kinds of public transit ways including bus, subway, and taxi. It faces regularity authorities of urban public transportation system and is used to improve public transport quality of service. Chicago released public attraction index based on travel time, walking time, waiting time, and so on. Beijing released crowded subway index using real-time passenger data. Beijing University of Technology raised the concept of bus travel index from convenience and rapidity.
Bus timetable optimization
As the basis for bus arrival time prediction, estimating or predicting bus running time plays a very important role for the entire result. Since the environment of buses running is very complex, their running time will produce great changes. Generally speaking, those factors can be clustered into five categories: (1) passenger factors, such as boarding and alighting time and passenger load;2–5 (2) infrastructure factors, such as number of stops, number of traffic signal lights, and length of segment;2–4 (3) running environment factors, such as weather, traffic patterns, and traffic incidents;2–4 (4) driver behavior factors, such as schedule recovery; 5 and (5) operation and management factors, such as scheduled travel time and control of time-check stop.2,3
Since bus operating has many parts such as bus stops, factors which cause its running time unstable are more complex than private cars, but the reliability requirements of its running time is often higher than for private cars. As people are increasingly demanding high reliability of bus transit, related research appears in large amount. Since bus operating reliability analysis requires a large amount of data, recently researchers focused on how to analyze bus operating reliability by new methods of data collection and processing. Z-L Ma et al. 15 raised a bus running time reliability model by data from AVL and Smart-card system, to evaluate how different kinds of road affects bus running time, buffer time, and stop time. A Gittens and A Shalaby 16 used a new integrated indicator to evaluate and improve bus transit reliability based on passengers’ attitude, which mixed different time period, station spacing, line length, and so on. R Nair et al. 17 provided a real-time system to predict bus bunching along four routes. AA Sarker et al. 18 analyzed public transport accessibility and operational effectiveness in large-scale multi-modal transportation network. I Gokasar et al. 19 used smart-card system to evaluate operational effectiveness in Istanbul. L-M Kieu et al. 20 proposed a new definition and test method of travel time fluctuations, focused on not only different time period in 1 day but also different days. W-Y Chen and Z-Y Chen 21 established a model to improve bus transit reliability based on AVL and APC data.
Since buses running is influenced by many factors, their running time is very unstable. On the basis of analysis of the factors affecting bus running time, in order to connect the factors with bus running time prediction, researchers have done a lot of researches on bus running time estimate models and how these factors influence them.
In the model’s designing and optimization, R Jeong and LR Rilett 2 summed up the models to predict running time, including historical data-based models, regression models, time series models, and neural network models. G Chen et al. 22 researched on bus-arrival-time prediction models based on links and sections, analyzed buses running time fluctuations in different dates and different times period in 1 day. J Gong et al. 23 raised a model, which combined historical data and real-time GPS data and improved the quality of prediction. M Salicrú et al. 24 combined running time prediction with scheduling preparation and found a way to optimize bus timetable. Y Han et al. 25 researched on the application of exponential smoothing method in the prediction of bus running time. Q Shen 26 researched on bus information real-time monitoring and predicting bus arrival time by floating cars. X Zhou et al. 27 predicted bus running time based on a large amount of measured data. F Li 28 optimized bus arrival time predicting method based on ITS technology. With the differences between travel time calibration methods, it will be very different fit of travel time distribution and actual data.
At present, there are very few evaluation and optimization methods for bus running, and they always focus on a single line. The calculation results for other lines as well as higher levels of evaluation (road-level, network-level, etc.) have limitations. With the rapid development of urban economy as well as urban transit, an integrated and efficient method for urban transit evaluation and optimization is required. Proposing an evaluation and optimization method based on multi-lines, both travel time and reliability are considered to have a strong practical significance.
Methodology
This integrated method faces a bus corridor with several bus lines covering, contains two main part: bus running environment evaluating which uses the proposed BRI and bus timetable optimization. The details of them are as follows.
BRI calculating method
BRI in this article faces a bus main road and involves a number of bus lines within the road. Taking travel time and reliability indicators in the traditional sense into account, combining with the actual operation of bus system, this article proposes bus planning travel time (BPTT) based on buffer index (BI). Its calculation method is as follows

where Ni is the sample volume of line i, d is the distance between bus stops, and M is the average travel time for all the bus lines which were taken into consideration.
By this equation, considering both travel time and reliability and using planning travel time per kilometer to characterize bus running environment, this article then proposes BRI.
BI is buffer index, an important indicator to calibrate buffer time. Buffer time allows travelers to add an additional time value based on the average travel time, to ensure that travelers can reach their destination on time. It partly reflects the unreliability of travel time for consideration and is an important indicator of travel time fluctuation analysis. Meanwhile, for public transport enterprises, buffer time is also an important factor for them to consider their operating plans. The calculation method for buffer time (BI)

where TT95 means the 95th percentile travel time and M is the average travel time, calculated by this formula

where TTi is a travel time of the observed sample and N is the number of samples in a given time.
This calculation method for the average travel time is in line with general practices for reliability analysis. Meanwhile, in support of large amounts of data, the deviation of distribution from different conditions can be balanced efficiently, so the calculation result has statistical analytical significance.
Based on the results above, the definition of BRI

where BPTT* is the BPTT under ideal operating environment and k is conversion factor to normalize BRI value.
Statistical analysis can characterize the travel time distribution within a certain time frame. Therefore, index libraries of BRI in this article also include the following statistical indicators:
Standard deviation (STD) of travel time

Coefficient of variation (COV)

Bus running time estimation methods
On the basis of bus running time estimation and fluctuation analysis, the United States, Germany, Japan, Korea, and some other countries have introduced timetables for every stop. In a series of complementary measures for protection, buses run on schedule on each stop, presenting high timetable execution rate and reliability, and effectively improve the public transport service level. To publish timetables and let them have practical significance, the key is to increase transit service reliability so that buses can run with timetable punctuality, which requires an accurate estimate of the state of buses operating (such as speed and running time) and do some adjustment and optimization. In China, bus schedules are generally prepared in terminal stations. In order to improve bus transit service level, some cities in China have already tried to release bus timetables in each station of bus lines. Before preparing and optimizing a bus timetable, we should accurately estimate bus running time between stops. Method based on distance between stops (DTM) and time period running time based method (TPTM) are commonly used in China.29,30 This article raises a method to estimate bus running time based on the operating conditions of transit corridors and compares with these two traditional methods. On the basis of this, it optimizes the existing timetable.
Method based on DTM
The basic principle of this method is it gets bus running time by bus speed and the DTM, with adjustment influenced by stop time and so on. This result can be the basis of timetable preparing. The equation of this method is

where TTi is bus running time estimation for the ith section divided by stops; Li is the length of the ith section; vi is the bus speed in the ith section; and ai is time adjustment, determined by stop time and so on.
This method is easy for calculation, which can efficiently obtain bus running time, and is widely used in China. Due to the variability of buses operating environment, this method focuses on static factors such as length of each section, and its estimation accuracy is limited.
Time-period running time based method
Since bus vehicles run with different environment in different time periods, researchers propose that we should estimate bus running time based on different time period (peak hours or not). The basic equation

where
Compared with DTM, TPTM considers effect of the state of public transport vehicles in actual operation to running time. However, due to restrictions of buses trips in 1 day, samples in one time period will be rather less, it often requires data in several days to estimate, not efficient.
Bus running time estimation method based on road traffic conditions
Since many bus lines share one way in China, the method proposed in this article faces to a bus corridor, including several lines in it. The basic equation of this method is as follows

where ttij is bus running time for line j in section i; Xij is whether line j and the optimal line share stop i (share to be 0, else is 1); βij is stop time adjustment value, determined by stop loss of time (deceleration, stop); m is one threshold, to divide different traffic conditions; BI is buffer index, determined by mean time and 95th running time; cov is coefficient of variance; and TTs is bus running time in smooth condition.
Results from this method combined several lines’ bus running data, and data sample size is guaranteed. Simultaneously, bus running time estimation by this method can reflect how operating conditions affect road buses running on time fluctuation better, bus dispatching conditions can be separated, which can provide a better reference on bus priority measures, bus dynamic scheduling. Moreover, since this method faces to a bus corridor, the result can reflect bus running position for several lines, which improves computational efficiency.
Select evaluation indicators
This article proposes a method to analyze bus running time. In order to verify its effectiveness in real world, in evaluation indicator selecting, this article fully considers the reliability of bus operation, chooses running time deviation (RTD) and effective sample coverage (ESC) to analyze.
RTD
RTD can reflect the deviation between estimation and real data, the equation for calculation

where ε is running time deviation and tti is bus running time in real world.
ESC
By setting a certain time threshold in the vicinity of the estimated time, forming a time period and calculating the ratio of actual running time falls in this time period, can analyze the effectiveness of this method to estimate bus running time from the bus running time volatility’s angle. The equation is

where ρ is effective sample coverage and k is time threshold, determined by the bus punctuality operating control standard.
Data accuracy and credibility
Compared with a single-line-based bus running reliability analysis, calculation method in this article faces a bus main road including a series of sections and has a stronger credibility. Take BRI calculation as an example. TPI’s data acquisition is generally based on thousands of floating taxis, which can be seen as continuous flow. When we take bus into consideration, data sample size becomes a problem. With bus departure intervals ranging from 2 to more than 30 min, data from a single bus line are very limited. At present, buses in Shanghai upload their GPS data every 10 s. According to different operating plans, every single bus line collects about 10,000–150,000 pieces per day. Table 1 compares the data sample size between traditional single-line-based reliability evaluation method and multi-line BRI evaluation method in this article.
Effective sample size comparison.
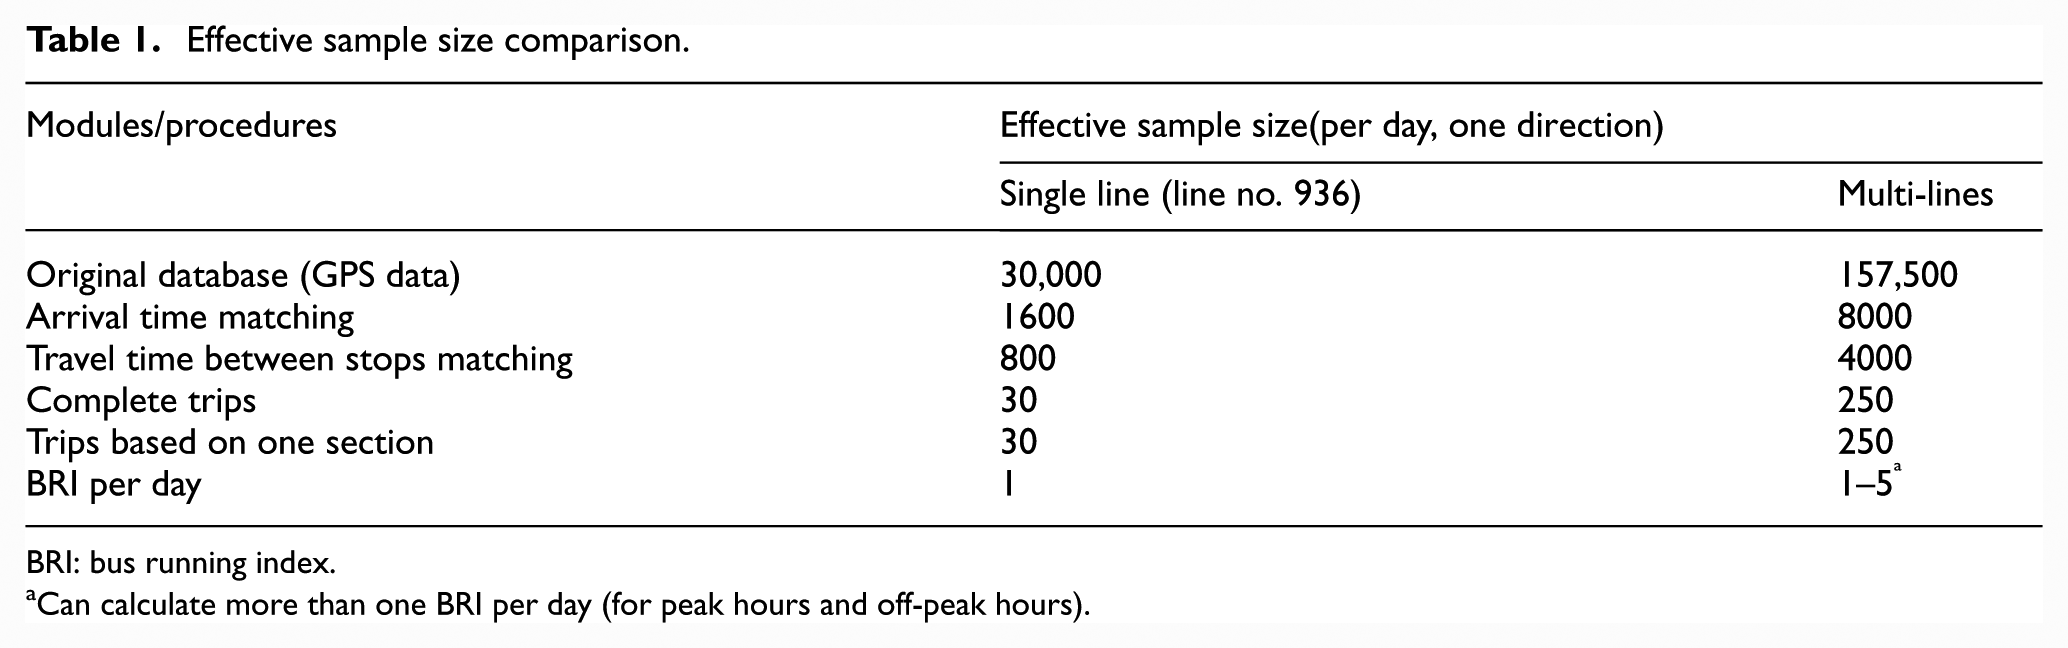
BRI: bus running index.
Can calculate more than one BRI per day (for peak hours and off-peak hours).
According to the actual calculation and analysis, each compute cycle requires at least 30 pieces of complete trips for one corresponding section and one direction, in order to make the results statistically significant. Taking the situation that the level of bus departure interval is generally different in peak hours and not-peak hours into consideration, to calculate BRI for different time periods in 1 day requires more than 200 pieces of complete trip data in one direction per day. Because of the different processes of GPS data cleaning and processing, corresponding GPS effective sample shall be more than 150,000 pieces for 1 day in one direction.
Table 2 uses data from the section between Yan’an Road Jiangsu Road (JS) intersection to Yan’an Road Zhenning Road (ZN) intersection on 10 February as an example and compares the data accuracy between traditional single-line-based method and BRI evaluation method proposed in this article (noted as section in this table).
BRI index comparison analysis based on one single line and multi-lines.

BRI: bus running index.
As we can see, since each line’s data sample size is small, if we only use its data to make reliability evaluation, there will be a wide range of variation in the other line, so it cannot be used to make bus running environment evaluation for a section.
BRI calculation method in this article has a great advantage on data sample size compared with traditional single-line-based evaluation method, so its actual suitability and data credibility have improved. For example, if we use traditional single-line-based evaluation method, we could hardly evaluate the bus running environment of bus line No. 936 in a 3-h-long time period (such as evening peak hours), since there are only six trips in one direction during evening peak hours per day, the 95th percentile travel time will lose its significance. BRI calculation method in this article meets this requirement.
Case study
Basic situation of this case
Different from previous research works which focused on a single bus line, this article focuses on a bus main road which has multiple bus lines covering. This article selects a series of sections of bus lanes on Yan’an Road, Shanghai, as the case to study and focuses on several bus lines which cover it. Through BRI and its evaluation system in this article, we analyze bus operating environment based on rapidity and reliability.
Yan’an Road bus lane starts at Zhongshan Road and ends at Gubei Road, with a total length of 10.00 km. It has been built in about 2000 and is Shanghai’s first bus lane put into use. The scope for consideration in this article is from West Yan’an Road Kaixuan Road (KX) bus stop to Mid Yan’an Road Shimen Road No.1 (SM) bus stop. The basic situation of the sections of bus lane and passing bus lines in this case are shown below.
Data acquisition process uses automated collection system and related equipment based on AVL. This article extracts upstream direction (east to west) data from 5 working days including 5 February, 6 February, 9 February, 10 February, and 11 February in 2015. Basic package includes the following sections:
Vehicle-line data: vehicle ID, line ID, line name.
Bus stop data: stop ID, stop name, stop longitude, stop latitude.
Line-stop data: line ID, line name, operating direction, stop number.
GPS data: line ID, vehicle ID, time point, longitude, latitude, speed, direction angle, operating direction.
Compared with traditional artificial data collecting, automatic data collecting system in this article can collect a large amount of valid data within decreased cost. Moreover, it excludes artificial errors arising in artificial data collection.
After the above basic data obtained, this article divides these sections into three parts: the west side from KS stop, KS stop to SM stop, and east side from SM stop. Then, this article calculates BRI and some corresponding indicators and analyzes the influence by these sections to bus running based on rapidity and reliability.
By applying the proposed bus operating condition evaluation system, we obtained a series of bus operating condition evaluation results. Meanwhile, this article also describes this method’s practical significance and credibility.
Urban transit evaluation result
Indicators effectiveness, sensitivity, and road traffic condition evaluation
In this case, the minimum BPTT for each section in the 5 days is considered as BPTT*. Considering some corresponding cases in TPI calculating, BPTT and BRI usually correspond by this rule: in a 10 score index evaluation system, the initial value of BRI is 0, with BPTT 0.3 times larger than normal, BRI plus 2, so we let k be 6.67. We divided this 10 score index into five levels, corresponding to (A) smooth, (B) generally smooth, (C) a little bit congestion, (D) some congestion, and (E) congestion.
In this case, we use the BRI calculation method proposed by this article, BRI and related results are shown in Table 3. First, we calculate BPTT and select BPTT* for each section. As we can see, by comparing the BPTT* with the average BPTT for each section, the fluctuations of BPTT in each section is much smaller than results from a single-line calculation, maintaining a good correlation. Meanwhile, by considering the contrast between BPTT and average travel speed, we can find that these two indicators show a very significant negative correlation, which is realistic.
Results of BPTT* and corresponding indicators calculation.

Using BPTT and average travel speed as the basic indicator to evaluate bus running conditions in each section, we can effectively evaluate bus running facilities as well as bus lanes. From Figure 1, we know that when bus lines pass this section of bus lane, the west side from KX is normal lane and the east side from SM is bus lane. Table 3 shows that when these three bus lines get into these sections in this case, BPTT* in DX-KX is much larger than SM-SX, which means mean travel time and fluctuation will increase under the condition that buses travel from normal lane to bus lane, and bus running condition is worse. In reality, with the complex road infrastructure and rule changing, the connection between bus lanes and normal lanes is usually a congestion point. When setting up bus lanes, management department set two bus lanes for one direction from SX to JS by considering traffic flow, and other sections have one bus lane for each direction. Through Table 2, BPTT* between these two stops are higher (more than 5), and BPTT* in other sections are lower. So we can use BPTT to provide a reference for bus lane arrangement.

Bus lines in these sections and their departure intervals.
Since buses run on road, bus operating conditions and road traffic conditions connect closely. By improving the data system, adding some data such as the number of lanes, intersection, and signal control program, we can evaluate traffic conditions comprehensively. What’s more, take BRI compared with TPI, we can evaluate transit priority measures (such as bus lanes and bus priority signal) from more angles.
Sub-sections/sub-time bus operation conditions evaluating and mutation analysis
From Figure 2, we can found that there is a generally smooth section; it is the BRI for ZN to JS on 10 February. The BRI calculation method in this article involves three bus lines in it, and the sample size is sufficient to support a sub-period day bus run index change analysis. Compared with traditional transit reliability evaluation method focused on a single line, BRI calculation method in this article are more accurate even involves bus lines with large departure intervals (such as departure interval of bus line No. 936 is 30 min). Using the data from this data system, we analyze the reason for the mutation in this case.

BRI on these 5 workdays.
Through Table 4, we can find that mean speed just has a minus change. If we only use travel time as an evaluation index, we can hardly find out the drop of bus running environment level. But through BRI in this article, we can see that drop of reliability causes BRI’s increase. By finding out the time period which includes the most amount of high travel time, preliminary judgment says bus operating environment deteriorated because of evening peak congestion. Through Figure 3 which involves sub-time period BRI, we verify this judgment.
Mutation analysis.

BRI: bus running index.

Sub-time period BRI on 10 February.
Through Figure 3, besides well performance of bus operating environment in not-peak hours, we can see that buses ran smoothly in the morning peak, which meant that the bus lane on it had a good performance with the traffic flow increasing in the morning peak. But bus operating environment deteriorated much in the afternoon, especially in the evening peak (16:00–19:00). In this time period, BRI of the section ZN-JS reached 7.89, which meant D (some congestion) level. BPTT reached more than two times from BPTT* and meets the judgment for the reason for BRI increasing on 10 February from Table 4. This BRI has a strong sensitivity to changes in the operating environment of buses, and changes in BRI can reflect changes in bus running environment. Meanwhile, analyzing Figure 3 comprehensively, we can find that BRI increased in the evening peak in most sections, which meant that bus running environment would be worse in the evening peak, it needed to improve. To sum up, BRI and its data system can reflect the change in bus running environment based on sections or time periods.
Urban transit timetable optimization
Time estimation result
Bus line No. 936 in this article is one of the first lines in Shanghai which release timetable for each stop, and the current method to estimate bus running time is DTM. We use the proposed method to estimate bus running time in each section and then compare the estimating value by these three methods. TPTM model uses the historical data-based model as described in Ranhee Jeong, Laurence R. Rilent paper. The result is as follows.
From Table 5, we can find that bus running time estimation results by methods which add dynamic parameters (TPTM and RCTM) are very different from DTM’s results. We analyze the fitting degree.
Running time estimation by three models.
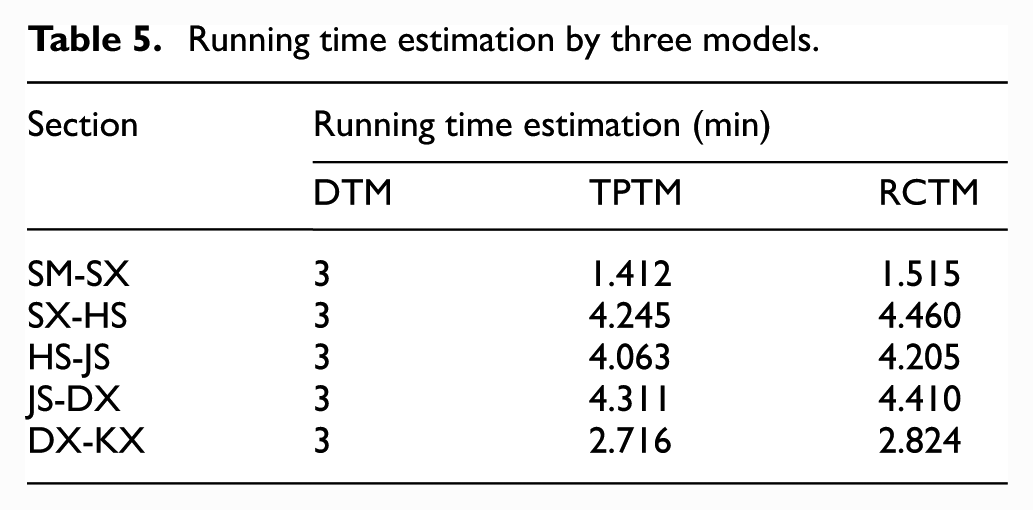
As Figure 4 shows, in these five sections and during these 5 days, bus running time estimation by methods which add dynamic parameters is much more accurate than result from DTM. Only in section 5, since results from these three methods are close to each other, the deviation is close. By comparing TPTM and RCTM, we can find that RCTM is better than TPTM, almost every deviation is less than 0.1 min.

Deviation of the actual data and the estimated value of the three models.
By Shanghai’s bus arrival punctuality of control targets recommendations, combined with bus running on time requirements of the United States, Japan, Germany, and some other countries, select 1 min as deviation time threshold and then analyze effective sample covering rate of these three methods. The results are as follows.
Figure 5 shows that effective sample covering rate of TPTM and RCTM is close to each other, much higher than that of DTM. Therefore, methods with dynamic parameters can reflect bus running condition in real world better.

Effective sample covering rate of these three methods.
Timetable preparing
Usually, bus companies will ensure buses running on time by increasing buffer time, which will make operating efficiency of buses declined. Method proposed in this article is for timetable optimization. In the previous chapter, TPTM also has a great estimation accuracy. Therefore, in sections which have only one bus line cover, we can use TPTM to estimate bus running time. We use TPTM and RCTM in different parts of one line so we can estimate bus running time for a whole bus line and analyze its practice significance.
Timetables before and after optimization are shown in Table 6.
Timetables before and after optimization (typical examples).

Peak hours mean 7:00–10:00 and 16:00–19:00, else are off-peak hours.
The following section analyzes how timetable reflects bus running condition in real world based on data in 5 February.
Through Figure 6, we can found deviation between estimation and actual data decreases rapidly after optimization. In Figure 6(a), there deviations in many stops are very high (in red and blue). After optimization, almost every deviation is in green, which means that deviation is less than 1 min. Especially in peak hours, the maximum deviation decreases from about 5 to less than 3. The optimized timetable can reflect bus running fluctuations by real-world conditions better. It proves that the optimization by the proposed method is effective.

Deviation between estimation and actual data: (a) before optimization and (b) after optimization.
Then, we analyze the implementation rate and the following table shows the result. From Table 7, we know that the implementation rate increases a lot after the optimization of timetable, the new timetable can reflect bus running fluctuation in real world better, and the optimization of timetable has practical significance.
The implementation rate before and after optimization.

We define bus punctually arrives at each stop when the deviation is less than 1 min.
Conclusion and recommendations
Public transport services are highly planned, but bus running time shows a great fluctuation because of the complex running environment. This article based on GPS data, facing bus main roads, raises an integrated method for urban transit evaluation and management optimization. In the calculation progress, its object changes from a single bus line to a section of road including multiple bus lines, which is more realistic. This calculating system has good stability and has sensitivity to abnormal conditions, shows a very good evaluation and optimizing effect, and can provide good support for the corresponding decisions. In the context of Big Data, data mining effect is particularly worthy of attention. Calculation method in this article is based on GPS data of multi-lines within the same section of road, significantly increases the effective sample size, and provides a greater accuracy and flexibility for data processing and analysis.
With the improvement of the proposed method, we can also see that it has more research value. In the index analysis system aspect, we can see the previously mentioned convergence with TPI. Under the current method of calculation and data integration situation, combination between TPI and BRI is not sufficient. We can hardly combine these two indexes and take them into consideration. Obviously, there is a connection between TPI and BRI evaluation method because social vehicles and buses are all running in the urban road network. On top of that, TPI and BRI are all focusing on sections of road. We can expect a lot of convenience by comparing these two indexes. For example, when we consider the effect of a bus priority method (such as bus lane or bus priority signal), and social vehicles run at an appropriate speed that buses can achieve, we can get the comprehensive results by comparing the performances of social vehicles and buses. In future work, we will use this calculation method to combine each section of bus main roads in the city’s public transport network to evaluate the performance of the network and set up the BRI evaluation system for the whole network. Meanwhile, we will try to find out the correlation between BRI and TPI and then build an evaluation system for integrated urban transport performance level.
As for estimating bus running time and optimizing timetable, we find that the proposed method can continue to improve. In future work, we will do some work in these two aspects:
Analyze more parameters and further improve accuracy of this method. Figure 2(a) shows that there is a large deviation of RCTM in JS-DX section. In further analysis, this is caused by line No. 71’s (another bus line in this section) data variety. In the proposed method, lines with high grid frequency (such as line No. 71 (4–10 min) to line No. 936 (30 min)) influence the result a lot. Meanwhile, the proposed method focus on a bus corridor, and bus line’s condition (such as passenger data) has not been considered. These parameters will be considered in the future.
To introduce this proposed method to networks, case in this article is just a bus corridor; universality and effectiveness of the model remains to be further verified. To use this method in a network, we can estimate bus running time of each line in this network and make it more meaningful.
Footnotes
Academic Editor: Yongjun Shen
Declaration of conflicting interests
The author(s) declared no potential conflicts of interest with respect to the research, authorship, and/or publication of this article.
Funding
The author(s) disclosed receipt of the following financial support for the research, authorship, and/or publication of this article: This work was supported by the Science and Technology Research Foundation for Transportation, Ministry of Transport of the People’s Republic of China (Grant No. 2015318221020), and the Key Laboratory of Road and Traffic Engineering of the Ministry of Education, Tongji University.