
Abstract
The straddle suspender of a suspension bridge is made up of wire ropes. The suspension bridges of cross-sea bridges are located in a marine atmospheric environment. Sulfur dioxide is an important component of this environment; it can increase the corrosion rate and result in suspender fracture. The corrosion mechanism of a steel wire is explained macroscopically and microscopically. As indicated in the digital images, scanning electron microscope, and X-ray diffractometer, the indoor experiment reacted faster in the first 6 days but slower after the 6th day. The experiment tended to stabilize from the 12th day to 15th day. The corrosion products in the low SO2 concentration condition are γ-FeOOH (lepidocrocite) and Fe3O4 (magnetite) while products in the high SO2 concentration condition are γ-FeOOH (lepidocrocite), α-FeOOH (goethite), and Fe3O4 (magnetite). The composition of the corrosion products did not change significantly from the 6th day to 12th day. The higher the SO2 concentration is, the more severe corrosion reacted on Fe. However, due to the effect of α-FeOOH, the Fe substrate was protected in the high SO2 environment. A high SO2 concentration generates more α-FeOOH. The tendency that the formula is exponential at both high and low SO2 concentration is similar.
Keywords
Introduction
Metal products are widely utilized in bridge engineering. Large-scale structures play a vital role in modern society, however, much of the infrastructure in industrialized nations is rapidly approaching the end of its intended design life. 1 Metal corrosion causes immense economic loss and increases the construction cost. Thus, reducing metal corrosion is particularly useful. The cable structure of a bridge is always subject to corrosion. Subjected to various natural actions, the bridge may collapse in different scales.2,3 Frequent changes in the environment of high temperature or corrosive gas and high concentrations of salt fog in the environment cause sling wire corrosion to easily occur. For a cross-sea bridge, the structure is likely to cause failure under the coupled action of corrosion and fatigue because the structure is in a corrosive environment during a long period. 4 It is known that the corrosion processes are affected by a large number of factors especially in a marine environment. 5 Thus, studying the marine atmospheric corrosion performance of steel wires can ascertain the corrosion mechanism of the sling and allow for suitable anticorrosive measures to be undertaken to prolong the service life of the sling and reduce the construction cost. Most existing studies investigated the use of a steel sheet for atmospheric corrosion tests. To the authors’ knowledge, no study has selected the sling as an object for the experimental and theoretical study of atmospheric corrosion. Therefore, the study of atmospheric corrosion on the sling has theoretical significance and important engineering application value.
If the cable structure is in an environment with sulfur dioxide (SO2), SO2 gas is dissolved in water and generates acid that accelerates the corrosion of the cable structure. Hence, research on the atmospheric corrosion of cable structures is of significance. Domestic and foreign scholars have conducted numerous studies and mainly employed the following two methods. The first method is experimental research, which is divided into outdoor and laboratory experimentation. The second method involves the use of a mathematical model to analyze the corrosion rate of steel and corrosion depth of cable structures under atmospheric corrosion.
Outdoor experimentation is more reliable. JH Wang et al.
6
found that the loss of corrosion thickness in weathering steel, along with time variation, conforms to the double logarithm law and identified that the best laboratory condition can simulate an actual outdoor SO2-polluted environment. E Almeida et al.
7
studied the interrelationship between the corrosion rate of zinc and Cl− content, humidity. They find that Cl− and SO2 cooperate to contribute to the corrosion rate. Meanwhile, QC Zhang et al.
8
studied the corrosion of weathering steel by outdoor experiments and proposed that the corrosion rate is fast in the first phase but decreases significantly in the second phase. R Vera et al.
9
conducted an outdoor experiment to determine the influence of different installation angles (e.g. 0°
Laboratory experiments consume less time than outdoor experiments; thus, many scholars prefer laboratory experiments. JE Svensson and LG Johansson 12 conducted an indoor SO2 corrosion test on zinc. They selected two SO2 concentrations, namely, 107 and 500 ppb, and studied the corrosion rate of zinc under different temperatures. Their results showed that high temperature means low corrosion rate. They also found that zinc corrosion rate is highest at 4°C. H Katayama et al. 13 conducted an indoor simulation experiment and discovered that early atmospheric corrosion of mild steel can be simulated outdoor by controlling the temperature and relative humidity of the environment and the temperature of the material. YH Qian et al. 14 studied the influence of chromium alloy on the atmospheric corrosion property of weathering steel. They adopted a novel experiment method and discovered that chromium improves the atmospheric corrosion resistance of weathering steel. Chromium can form a protective rust layer, which functions as a barrier to prevent internal corrosion, further strengthen the passivation capability of the rust layer, and then reduce the dissolution of the metal anode substrate. P Montoya et al. 15 performed three dry–wet cycling tests in a laboratory to verify the corrosion resistance of weathering steel. The three trials were (1) Cebelcor cycle experiment, which simulates a rural urban environment that contains low SO2 concentration; (2) Kesternich cycle experiment, which simulates an industrial environment that contains high SO2 concentration; and (3) Prohesion spray cycle experiment, which simulates corrosion in a marine atmospheric environment.
Generally, outdoor experimental data are accurate, but outdoor experiments require much time. Indoor experiments consume less time, but its relevance to outdoor experiments needs to be explored. In this study, considering that indoor experimentation is faster than outdoor experimentation, we utilized the former to investigate the corrosion property in an environment with SO2.
Materials and methods
Experimental instrument
Several equipments were utilized to create an environment with constant temperature and humidity. Figure 1 shows the humidifier and humidity controller.
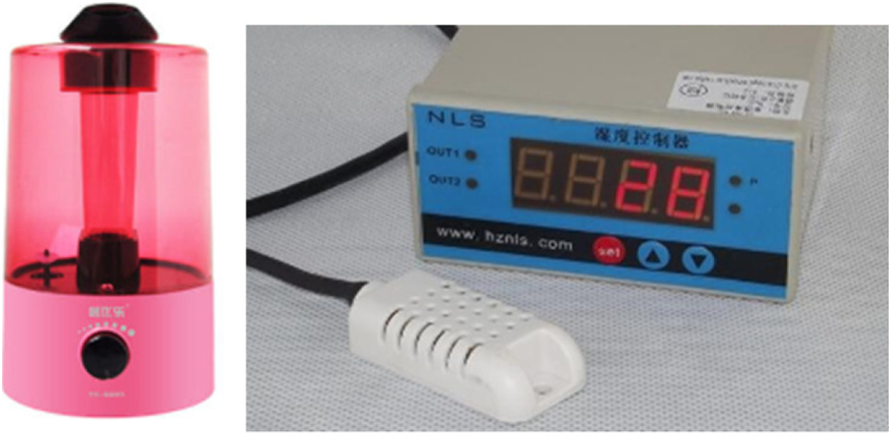
Humidifier (left) and humidity controller (right).
The humidity in the test chamber was controlled by the humidifier and humidity controller, which can take control of the switch of the humidifier. Figure 2 shows the electric heater and temperature controller.

Electric heater (left) and temperature controller (right).
The temperature in the test chamber was controlled by electric heater and temperature controller, which can take control of the switch of the electric heater. Figure 3 shows the test shelf.

Test shelf.
The sample was placed on the test shelf, which is made of plastic to prevent an electrochemical reaction according to ISO 6988. Figure 4 provides a schematic of the experimental setup. A greenhouse was built by pasting the plastic cloth on the tent. The temperature controller and electric heater were placed in the tent to create a greenhouse environment. The temperature was controlled at 40°C ± 3°C. The test chamber (dimension of 30 cm × 30 cm × 90 cm) was then placed in the greenhouse; the material is a transparent acrylic plate in accordance with ISO 6988. 16 The humidifier was placed in the test chamber. Humidity was controlled by the humidity controller at 95% RH. The sample was placed on the test shelf at a distance of 20 mm. 16

Experimental setup.
Experiment materials
Most scholars select a rectangular steel sheet as an experiment sample.6,12 However, a steel sheet and a steel wire rope are different because a phosphating process occurs in the production of a steel wire rope; a steel wire could be anti-corrosion. As a result, using a steel wire rope is more reliable.
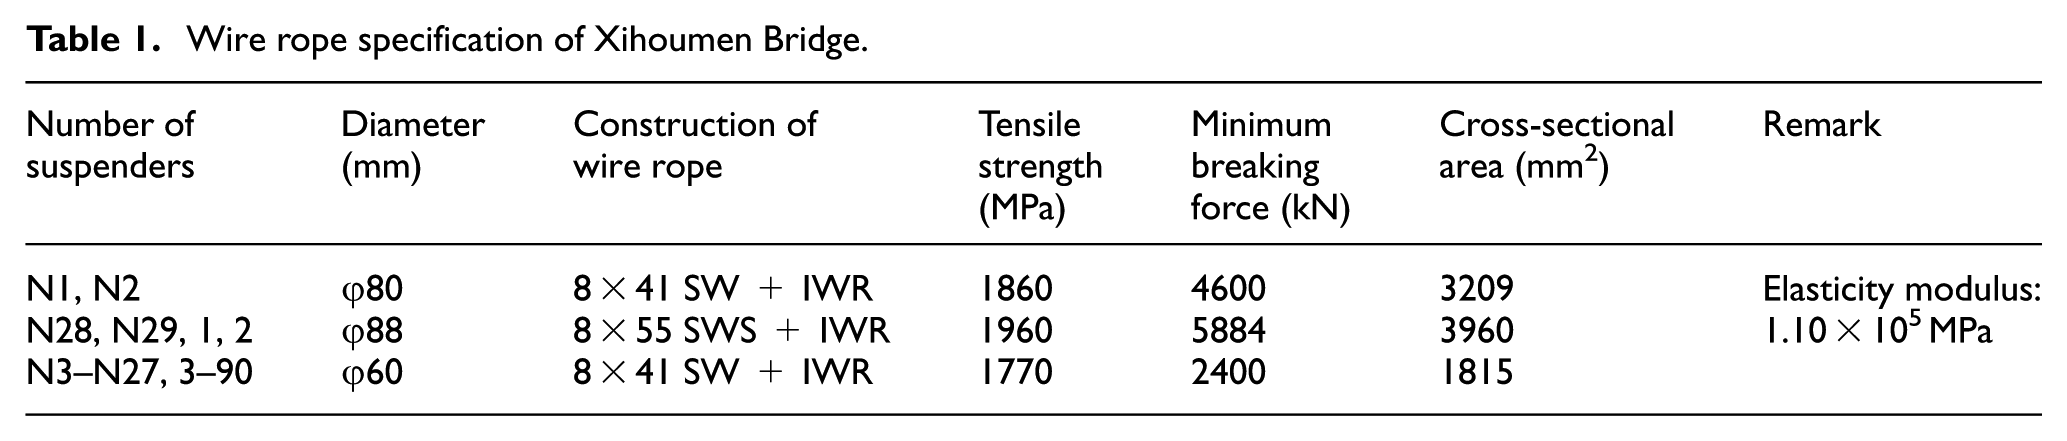
Mild steel is widely utilized by many scholars.6,9,13 Although the plastic of mild steel is better, its strength is low. For example, the yield strength of Q235 is only 235 MPa, and its extension strength is approximately 375–500 MPa; it cannot meet engineering requirements. The extension strength of the steel wire rope employed in Xihoumen Bridge is higher than 1770 MPa. Thus, high-carbon steel was utilized as a test material.
Table 1 shows the specific parameters of wire rope suspenders for Xihoumen Bridge. As shown in Table 1, the diameter of 60 mm is widely utilized (total number of 904). Their structure is 8 × 41 SW+IWR, and the cross section is shown in Figure 5.
Wire rope specification of Xihoumen Bridge.

Cross section of steel wire rope in Xihoumen Bridge.
We selected the same structure with steel wire in Xihoumen Bridge but with a smaller size. The structure of the steel wire is 6 × 36 WS+IWR. The diameter of the steel wire is 16 mm, and the tensile strength is 1770 MPa. The steel wire was protected through immersion in oil. The cross section of the experimental steel wire is shown in Figure 6. Prior to the experiment, the oil on the steel wire was removed with acetone. The steel wire was packed with insulating tape marked with a number at both ends.16,17 The steel wire was cut into 10 cm pieces and stored in a plastic chamber with some desiccant CaCl2.
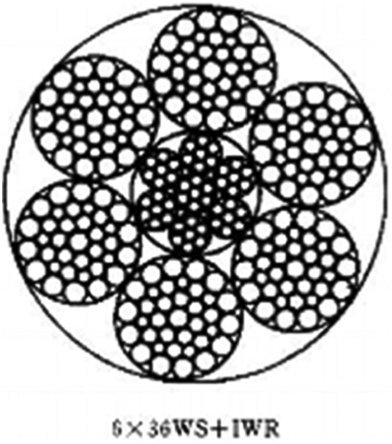
Cross section of the experimental steel wire.
Experiment method
The atmospheric corrosion of steel wire was conducted with a periodic immersion wet/dry cyclic corrosion test, which is an accelerating corrosion test method. Each cycle of wet/dry corrosion test included two stages: (1) immersing the samples into a 0.01 M NaHSO3 and 0.001 M NaHSO3 aqueous solution with a pH value of 4–5 for 12 min 14 and (2) drying the samples on the test shelf in the test chamber for 12 h 18 at a constant temperature of 40°C ± 3°C 16 and constant humidity of 95% RH.12,19 Before step 1 in each cycle, the sample was immersed in ultrapure water to clean the ion on the surface of the sample. 18 The corrosion experiment lasted for 30 cycles, namely, 15 days.12,19 In the experiment, the 0.01 M NaHSO3 aqueous solution with a pH value of 4–5 simulates an industrially polluted atmosphere. 15
After the moisture volatilizes, the reaction will occur continuously on the right to generate SO2. The amount of SO2 will be generated if the mass ratio of NaHSO3 is confirmed. Although 0.01 M NaHSO3 will generate high-concentration SO2 to simulate an industrially polluted atmosphere, we selected 0.001 M NaHSO3 for comparison to simulate an environment with low SO2 concentration. Before weighing the mass of the sample, we immersed the sample into a diluted hydrochloric acid solution (500 mL HCl+500 mL distilled water+20 g hexamethylenetetramine)14,20 for 10 min at room temperature to remove the corrosion products.
The experimental sample was weighed on days 3, 6, 9, 12, and 15 after removing the rust on the electronic scales (exactly 0.1 mg). The sample was photographed with a digital camera at each cycle to observe macroscopic phenomena. The surface morphologies of the corrosion samples were observed with JSM-7500F scanning electron microscope (SEM, JEOL, Japan) with an accelerating voltage of 0.1–30 kV. The composition of the corrosion product layers were identified with X’PERT-PRO X-ray diffractometer (XRD, PANalytical, Netherlands) with a time per step of 10.16 s, Cu target Kα radiation under generator voltage of 40 kV and tube current of 40 mA, and scan step size of 0.033°.
Results
Surface change
Figure 7(a) shows the surface of the steel wire before corrosion in an environment with low SO2 concentration. Metallic luster was observed, and no rust was found on the surface. Figure 7(b)–d) indicates that corrosion increased gradually, and the metallic luster could still be observed, but the metallic luster dimmed gradually. Figure 7(e) and (f) shows that the surface was covered by rust 2 days later. The black rust might be Fe3O4 and the local area of the surface was red probably caused by γ-FeOOH. Figure 7(j) and (k) shows that the rust layer thickened without the metallic luster. Finally, the surface was covered by black rust, and the rust could have been transformed from γ-FeOOH into Fe3O4.
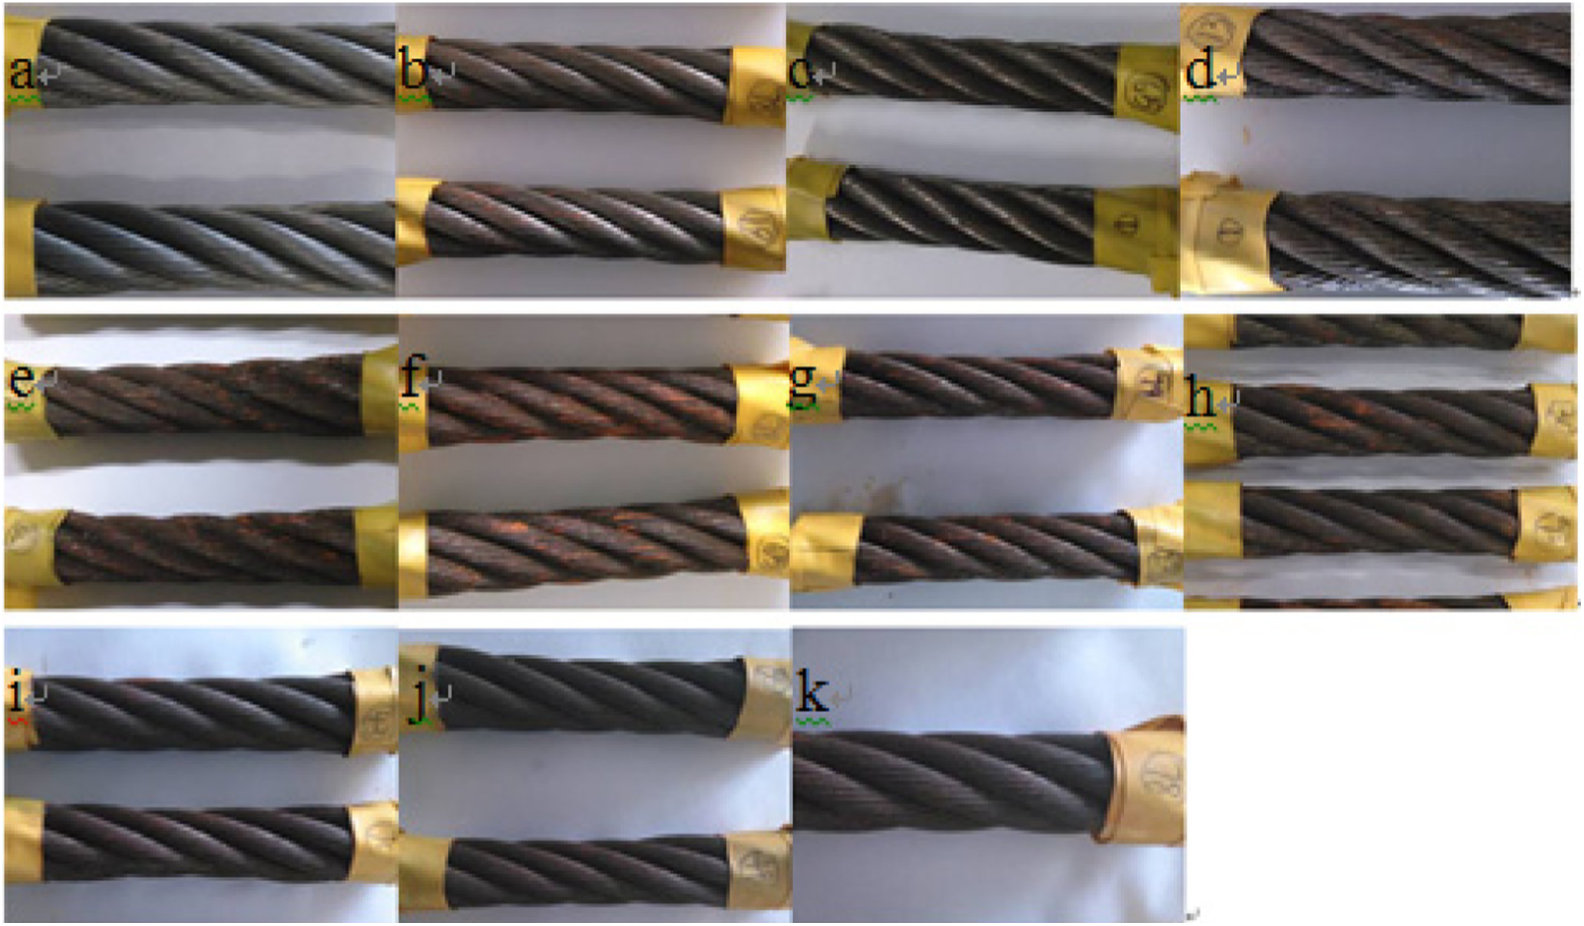
Corrosion of steel wire at low SO2 concentration for (a) 0 h, (b) 12 h, (c) 24 h, (d) 36 h, (e) 48 h, (f) 60 h, (g) 3 d, (h) 6 d, (i) 9 d, (j) 12 d, and (k) 15 d.
It is obviously that the wire in Figure 8 is dimmer than in Figure 7; therefore, the steel wire corroded faster in the environment with high SO2 concentration than that with low SO2 concentration. Figure 8(b) shows that the steel wire was covered with rust (without metallic luster) in the environment with high SO2 concentration. In Figure 8(g), the black rust was compact. In Figure 8(i), several red corrosion products can be seen, which might be due to α-FeOOH. Figure 8(j) and (k) shows that the color of the rust did not change significantly, and the corrosion tended to stabilize.

Corrosion of steel wire at high SO2 concentration for (a) 0 h, (b) 12 h, (c) 24 h, (d) 36 h, (e) 48 h, (f) 60 h, (g) 3 d, (h) 6 d, (i) 9 d, (j) 12 d, and (k) 15 d.
3.2. SEM results
Figure 9(a) shows that the surface of the steel wire became compact with metallic luster. Magnification (100×) showed that it has a longitudinal texture and is clean without any rust. The scratch created can be seen clearly on the surface of the steel wire, when the steel wire was cleaned with acetone. When the steel wire was corroded at low SO2 concentration for 6 days, a layer of loose oxide, whose morphology is cellular and flake, was created on the surface (Figure 9(b)). The flake up means that the layer is loose probably because of the high growth stress in the formation process of rust layers. 14 The cell synthesis shown in Figure 9(b) is compact and can prevent further corrosion. Figure 9(c) shows that several thin films of corrosion and cellular embossment were generated on the surface. The microstructure is also visualized in Figure 9(c) at 500× magnification (the image on the right); several small granules on the cellular embossments were observed. Due to the protection of the thin corrosion layer, the Fe substrate did not react with water and oxygen; thus, Fe was protected, and the reaction rate decreased.
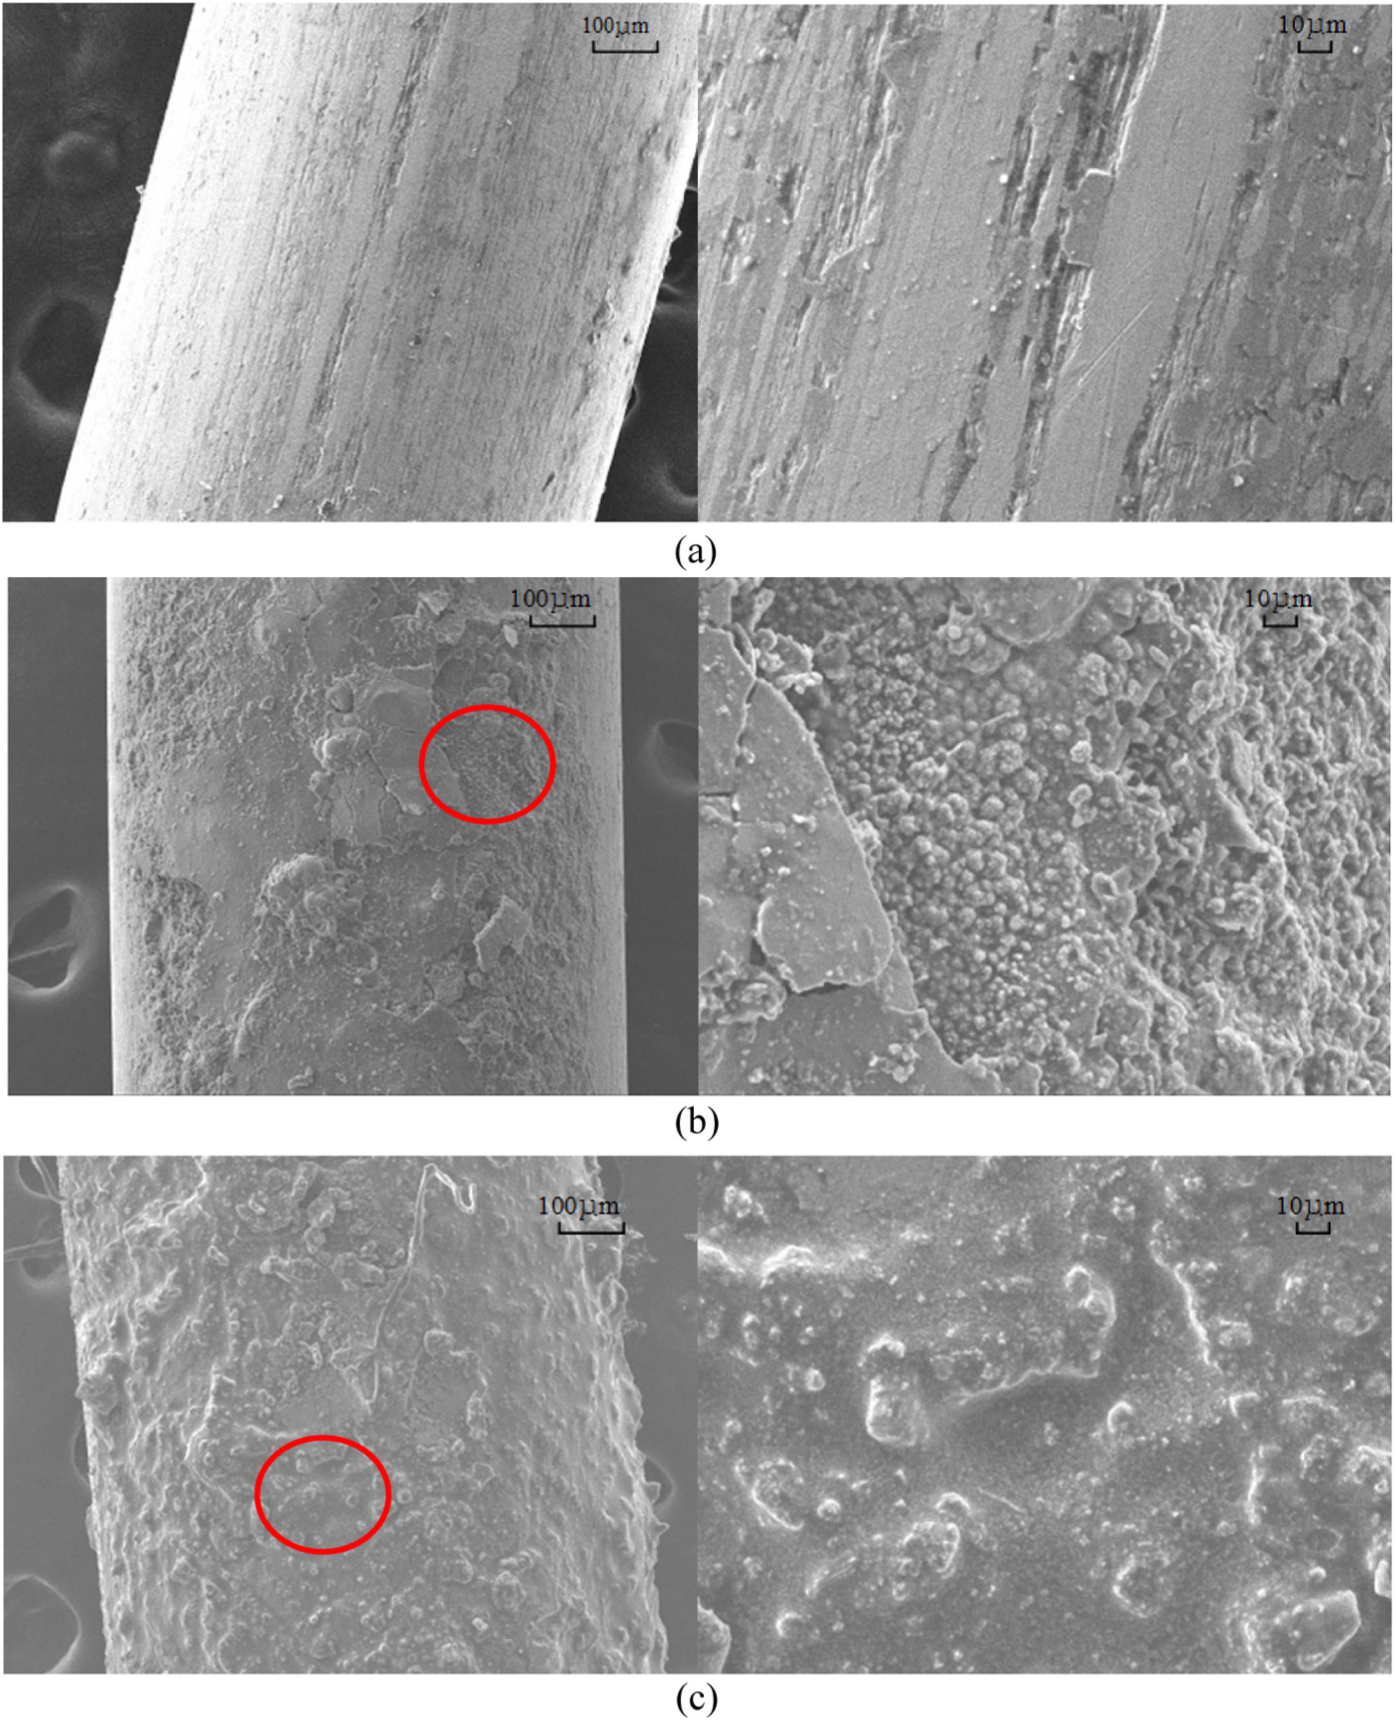
SEM images of steel wire in low SO2 concentration at (a) 0 d, (b) 6 d, and (c) 12 d (the image on the right is a magnification of the image on the left).
Figure 10(a) indicates that the corrosion products are acicular and cellular. The cellular corrosion products increased faster at high SO2 concentration than at low SO2 concentration. As the number of cellular corrosion products increased, the corrosion products became more compact. 19 This cellular corrosion structure (cotton balls) might be a typical micro-characteristic of α-FeOOH. 14 As shown in Figure 10(b), the corrosion phenomenon is serious. Many corrosion flakes were observed on the surface, which had many fractures. A thin layer of corrosion products is under the corrosion flakes. Many cellular corrosion products, which might be NaHSO3 granules, were generated because of moisture evaporation. The large flake shown in Figure 10(b) at 500× magnification might be loose and fractured Fe3O4, which could not protect the Fe substrate. Although the uniform corrosion below the large flake exhibited a globular structure, which is a typical micro-characteristic of α-FeOOH, 14 its stability is the highest in the oxyhydroxide of Fe and can protect Fe from corrosion. 18 Thus, the reaction rate decreased after 12 days.

SEM images of the steel wire at high SO2 concentration for (a) 6 d and (b) 12 d (the image on the right is a magnification of the image on the left).
Mass change
The mass loss formula in Cui et al. 21 is shown in equation (1)

where C (g/m2) is mass loss per unit area, w0 (g) is the mass of the sample before corrosion, w1 (g) is the mass of the sample after corrosion, and S (m2) is the area of the sample. 21
However, given that the steel wire is a linear structure, equation (1) should be changed into equation (2)
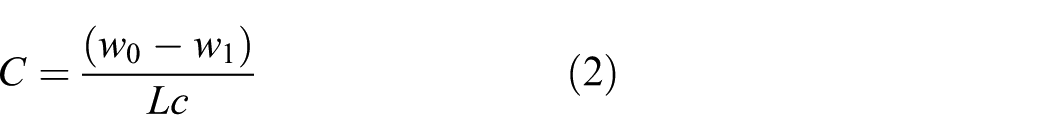
where C (g/m2) is mass loss per unit area of the surface, w0 (g) is the mass of the sample before corrosion, w1 (g) is the mass of the sample after corrosion, c (m) is the circumference of the sample, and L (m) is the length of the sample.
Figure 11 shows the curve of mass change along with time according to the mass corrosion data recorded at high SO2 concentration.

Mass loss curve of the steel wire in low and high SO2 environments.
The exponential fitting formula is shown in equation (3)

The adjusted R-squared in equation (3) is 0.8762, which means that exponential fitting is preferable. Figure 11 shows that the tendency of mass loss is that mass increases rapidly in the first 6 days and stabilizes after 6 days. Figure 11 shows the curve of mass change along with time according to the mass corrosion data recorded at low SO2 concentration.
The exponential fitting formula is shown in equation (4)

The adjusted R-squared in equation (4) is 0.89124, which means that exponential fitting is preferable. Similar to that in a high SO2 environment (Figure 11), the mass loss in a low SO2 environment increases rapidly in the first 6 days and stabilizes after 6 days. According to Figure 11, the mass loss curves of the steel wire have the same tendency at high or low SO2 concentration. The slope of the curve is larger in the first 6 days in the high SO2 environment. This condition indicates that the higher the SO2 concentration is, the faster the corrosion rate is. The steel wire corroded severely at high SO2 concentration.
XRD results
Figure 12 shows that the steel wire is obviously composed of Fe. Figure 13 indicates that the compositions of corrosion products at high SO2 concentration after 6 days are γ-FeOOH (lepidocrocite), α-FeOOH (goethite), and Fe3O4 (magnetite). δ-FeOOH may exist because it is in an amorphous state that cannot be detected by XRD. 20 α-FeOOH is the most stable structure in the oxyhydroxide of Fe, so it can protect Fe from corrosion. 18 The corrosion rate decreased when α-FeOOH was generated after 6 days. Figure 14 shows that the compositions of corrosion products at high SO2 concentration after 12 days are γ-FeOOH (lepidocrocite), α-FeOOH (goethite), and Fe3O4 (magnetite), similar to those at high SO2 concentration after 6 days. However, the content of Fe3O4 at 12th day is higher than that at 6th day. The same finding can also be concluded from the XRD wave number and color of the corrosion products.
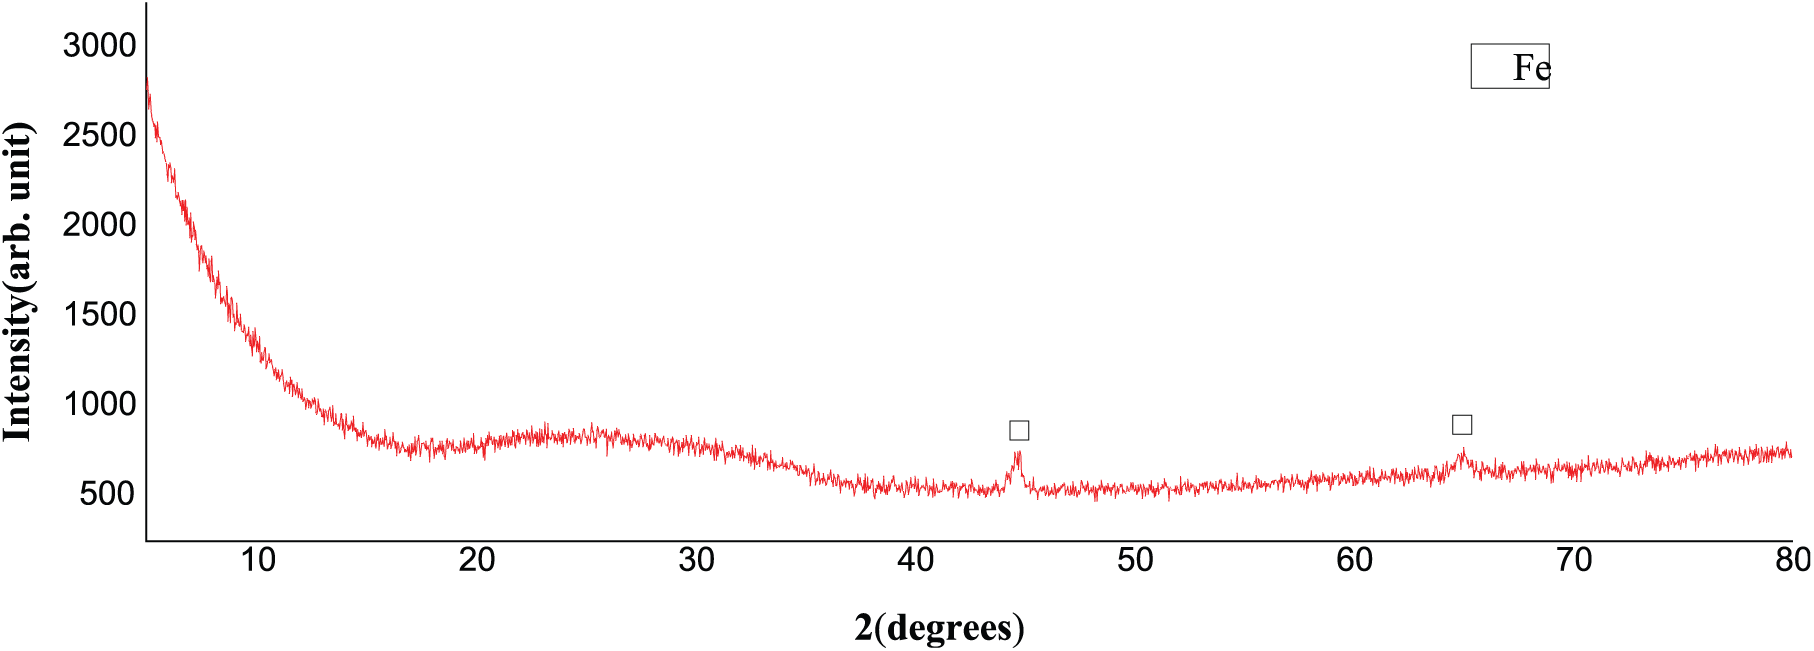
XRD of the steel wire before corrosion.

XRD of the steel wire at high SO2 concentration after 6 d of corrosion.

XRD of the steel wire at high SO2 concentration after 12 d of corrosion.
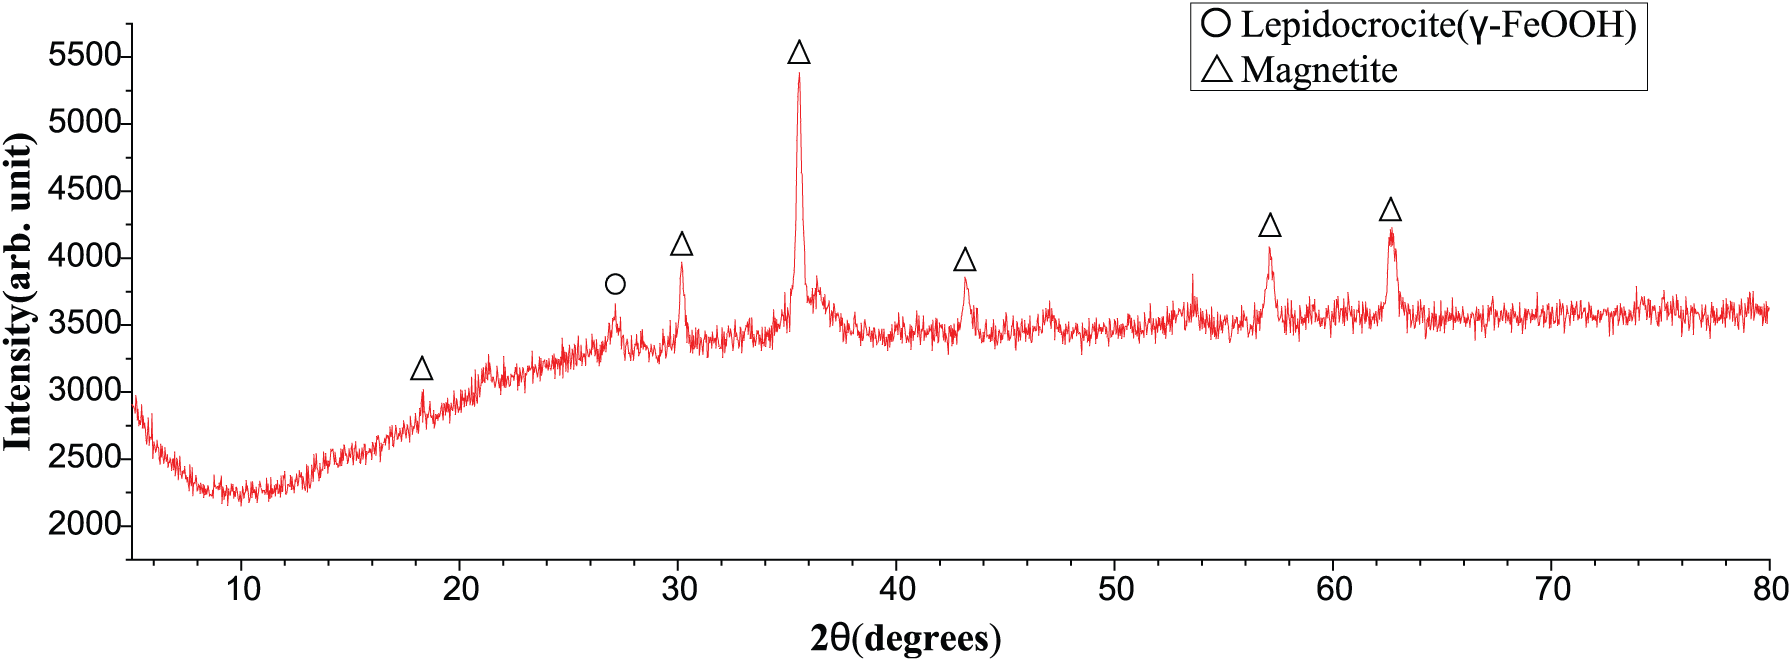
Figure 15 shows that the corrosion products are mainly composed of γ-FeOOH (lepidocrocite) and Fe3O4 (magnetite) and are different from the corrosion products generated at low SO2 concentration. No α-FeOOH wave crest was observed as verified by the black color of corrosion products; no brown color, which is the color of α-FeOOH, was noted. The content of α-FeOOH increased with SO2 concentration. This result means that the concentration of SO2 promotes the generation of α-FeOOH. 19 Figure 16 shows that the corrosion products are γ-FeOOH (lepidocrocite) and Fe3O4 (magnetite). However, the number of wave crests in γ-FeOOH is small, which means that γ-FeOOH might be changed into Fe3O4 as time goes on. The map analysis of XRD and the images in Figure 9 support each other.

XRD of the steel wire at low SO2 concentration after 6 d of corrosion.
XRD of the steel wire at low SO2 concentration after 12 d of corrosion.
Discussions
The method utilized in indoor corrosion experiments, which has been mentioned in several studies, can indeed accelerate the reaction rate. As a result, using this method to simulate an outdoor corrosion experiment during a short period of time is appropriate.
The digital image of the experimental sample indicates that the corrosion rate increases with the increase in the concentration of SO2. The higher the SO2 concentration is, the more severe the corrosion of the steel wire would be. However, several common characteristics exist. During 15 days of corrosion, the steel wires corroded faster in the first 6 days. This condition caused the steel wires to be covered with corrosion products within 6 days. The macroscopic condition of the steel wires changed gradually in the following days. Comparison of the corrosion condition of the steel wires indicates that the high SO2 environment corrodes steel fast; as a result, metallic luster cannot be seen on the surface of the steel wires. After 6 days, the corrosion products are distributed on the surface of the steel wires whose color is mainly red and black. Through XRD, the corrosion products were found to be α-FeOOH and Fe3O4. The corrosion rate was lower at low SO2 concentration. The corrosion on the first day was characterized by pitting corrosion in local area. The corrosion rate accelerated after 36 h, and the corrosion products became flakes. Moreover, the corrosion products transformed into black corrosion products that could be Fe3O4 and red corrosion products that could be γ-FeOOH. The result concluded from the digital image was also verified by the XRD results.
Microscopic phenomenon was conducted through an SEM experiment to observe the surface condition. Before indoor corrosion, the steel wire was clean and had a metallic luster and longitudinal texture. After corrosion at low SO2 concentration for 6 days, oxide products formed on the steel wire with two morphologies, namely, cellular and flake. The flake oxide products are loose with many cracks, which can be caused by the high growth stress in the formation of rust layers. By contrast, the cellular corrosion products are compact; they can terminate contact with the external environment and prevent further corrosion. After the steel wire was corroded at low SO2 concentration for 12 days, continuous oxide products were formed. These oxide products wrapped the Fe substrate tightly; consequently, the Fe inside could not react with oxygen and water. Hence, the Fe substrate was protected with a low reaction rate. These results are verified by the mass loss curve; the mass loss curve became flat after 9 days.
After the steel wire was corroded for 6 days, the corrosion on the surface of the steel wire was obviously composed of flake, cellular, and hunch corrosion products. The SEM image of corrosion at low SO2 concentration indicates that the amount of cellular embossment at high SO2 concentration increases rapidly. Cellular embossment might be a microstructure of α-FeOOH. After the steel wire was corroded for 12 days, the surface of the steel wire became severely corroded. Several swelling flakes and fractures between the hunches have been observed. XRD indicates that these loose corrosion products might be Fe3O4, which provides poor protection for the Fe substrate. Meanwhile, several uniform corrosion products, which are small flakes on the surface that might be α-FeOOH, wrapped the Fe substrate. Due to its high stability, α-FeOOH can protect the Fe substrate. As a result, the mass loss curve became flat after 9 days compared with the high SO2 concentration condition. Comparison of corrosion at high and low SO2 concentrations indicates that the two groups of steel wire generate compact oxide, which reduces the reaction rate. The steel wire in the high SO2 concentration condition corroded more severely.
In the analysis of the mass loss curve, the exponential function fits the experimental data well. During the first 6 days, the slope of the curve is higher. This condition means that the corrosion rate is faster. However, the corrosion rate became flat in the following days as verified by the comparison of the digital image and SEM results. By comparing the mass loss curve at high SO2 concentration with that at low SO2 concentration, we found that the higher the SO2 concentration is, the more severely the steel wire corrodes.
Before corrosion, the material of the steel wire is Fe. By means of XRD at high SO2 concentration condition, the corrosion products are composed of γ-FeOOH (lepidocrocite), α-FeOOH (goethite), and Fe3O4 (magnetite). Among these, α-FeOOH is the most stable and thus provides protection for the Fe substrate. As a result, the corrosion rate decreased after 6 days, and α-FeOOH was formed. These results can be verified by the mass loss curve. By means of XRD at high SO2 concentration condition, the corrosion products are composed of γ-FeOOH (lepidocrocite), α-FeOOH (goethite), and Fe3O4 (magnetite). The results of steel wire corrosion are similar for 12 and 6 days. Thus, the corrosion rate is low after 6 days.
The composition of corrosion products at low and high SO2 concentration conditions for 6 days is different. The corrosion products at low SO2 concentration are mainly composed of γ-FeOOH (lepidocrocite) and Fe3O4 (magnetite) without α-FeOOH, and the XRD result that the products contain γ-FeOOH is not evident. The macroscopic digital images show that the corrosion products are black as verified by XRD. Comparison of the XRD image after corrosion in both high and low SO2 concentration conditions indicates that the corrosion products are mainly composed of γ-FeOOH (lepidocrocite), α-FeOOH (goethite), and Fe3O4 (magnetite). In the low SO2 concentration condition, the corrosion products do not contain α-FeOOH (goethite). The higher the SO2 concentration, the easier α-FeOOH forms.
Conclusion
As indicated in the digital images, SEM, and XRD, the indoor experiment reacted faster in the first 6 days but slower after the 6th day. The experiment tended to stabilize from day 12 to day 15.
The corrosion products in the low SO2 concentration condition are γ-FeOOH (lepidocrocite) and Fe3O4 (magnetite). The corrosion products in the high SO2 concentration condition are γ-FeOOH (lepidocrocite), α-FeOOH (goethite), and Fe3O4 (magnetite). The composition of the corrosion products did not change significantly from the 6th day to 12th day.
The higher the SO2 concentration is, the more severe corrosion reacted on Fe. However, due to the effect of α-FeOOH, the Fe substrate was protected in the high SO2 environment.
A high SO2 concentration generates more α-FeOOH.
The tendency that the formula is exponential at both high and low SO2 concentration is similar.
The experiment method employed in this study can simulate accelerated corrosion to a certain extent.
Footnotes
Academic Editor: Jun Li
Declaration of conflicting interests
The author(s) declared no potential conflicts of interest with respect to the research, authorship, and/or publication of this article.
Funding
The author(s) disclosed receipt of the following financial support for the research, authorship, and/or publication of this article: This study was financially supported by the National Natural Science Foundation of China (51208471), Natural Science Foundation of Henan Province of China (162300410255), Outstanding Young Talent Research Fund of Zhengzhou University (1421322059), Science and technology planning project of Transportation in Henan Province (2016Y2-2), and the Specialized Research Foundation for the Doctoral Program of Higher Education (20114101120008).