
Abstract
It is important to provide a regular unidirectional air distribution in an operating room to reduce the number of particles. Measurements were taken in the one of the operating rooms at Uludag University Medical School, with laminar air flow unit and two-cornered outlet which was thought to have some airflow problems. Moreover, a three-dimensional computational fluid dynamics model has been developed where the measurements were taken in. The distributions of air velocity, temperature, and relative humidity have been examined and compared with the measurements to validate the computational fluid dynamics analyses. In addition to present model, four-cornered outlet operating room has been analyzed and compared with the results of two-cornered one. It is concluded that the case of four-cornered outlet provides more suitable thermal distribution, which results in a reduction of the particle numbers in the interior. Although there is no significant change in temperature and relative humidity in the operating room, air distribution changes dramatically.
Keywords
Introduction
An operating room (OR) air conditioning system is designed to reduce the risk of infection to the patients and OR staff and also provide the best possible thermal comfort.1,2 Poorly ventilated ORs not only make the surgical staff and the patient uncomfortable but also can spread infection. 3 If pathogenic particles enter a surgical wound, the risk of infection at the surgical site increases. 4 Air distribution plays very important role to success this condition.
Although there are standards and guidelines for almost every country, some of them are preferred. These preferred standards and guidelines are ASHRAE, DIN 1946/4, and VDI 2167; 5 Table 1 defines the environmental parameters of these standards.
International technical HVAC guidelines that define the environmental parameters in an OR. 4
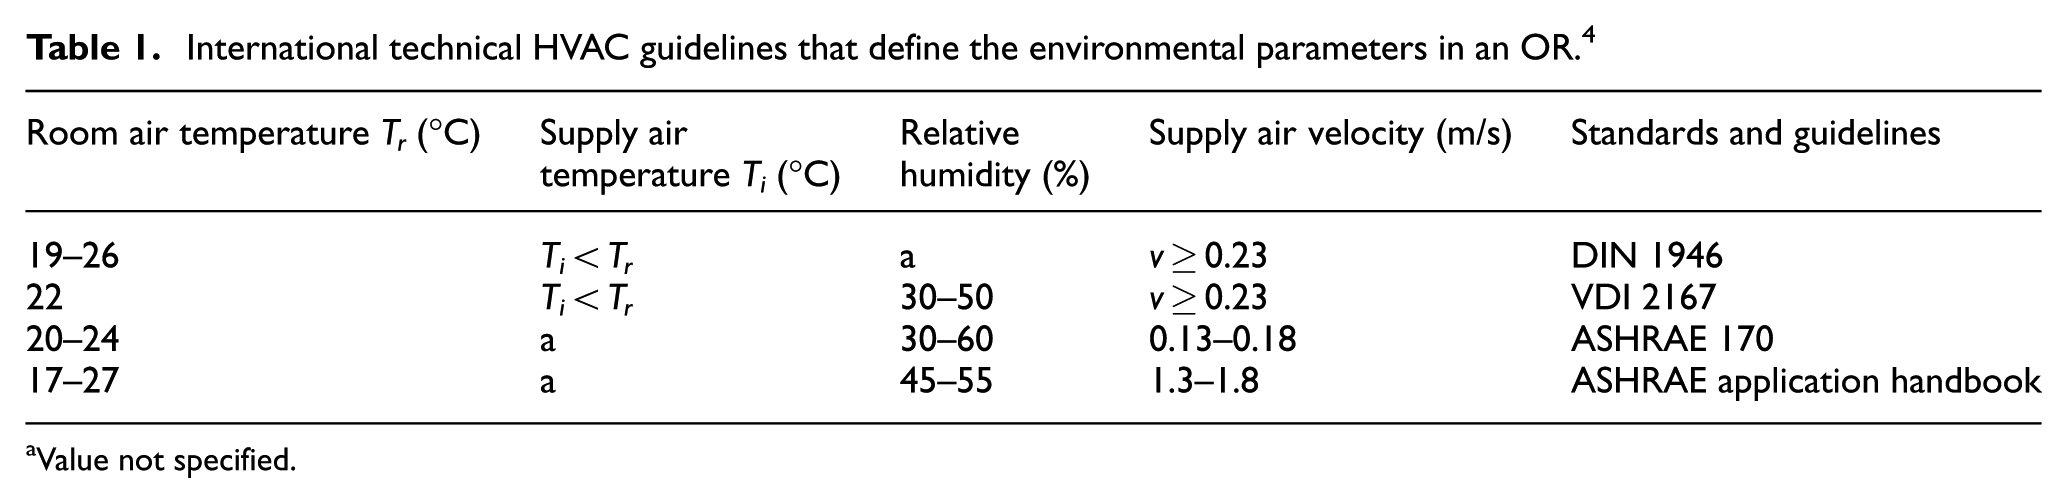
Value not specified.
Turbulent air flow was allowed in previous standards and guidelines but laminar air flow (LAF) systems are required in the recently published standards. Even though different supply air velocities are recommended according to Table 1 and other standards, a velocity of more than 0.45 m/s will cause draft discomforts for the surgical staff. 4
Many experimental studies and computational fluid dynamics (CFD) analyses have been presented about thermal comfort and infection factors in ORs. Chow and Yang6–8 explained the basic principles of an OR and applied the CFD method in their investigations. They studied seven different cases with different medical lamp positions and different supply air velocities, with or without partial walls. They stressed the health risk of the airborne bacteria released from both the surgical staff and the patient. Ho et al. 3 presented a three-dimensional CFD analysis for thermal conditions and contaminant removal in an OR. They investigated the effects of horizontal locations of supply and exhaust grilles on thermal comfort and contaminant removal. Rui et al. 9 studied the airborne transmission of bacteria in two ORs during surgery. They also conducted a numerical simulation to calculate the particle trajectories. Their results showed that improving of the air flow pattern can reduce the particle deposition on critical surfaces; however, the effect is less clear when increasing the air change rate by a certain amount. They also found that bacteria colony deposition increased if the air velocity increased above a particular velocity. Balaras et al. 10 presented an overview of the general design of indoor air conditions in an OR. They investigated 20 ORs at 10 different hospitals including an audit that recorded information on construction, indoor air conditions, and type of heating, ventilating, and air conditioning (HVAC) system. Van Gaever et al. 4 summarized the technical standards and compared them to the thermal comfort standard. Dharan and Pittet 11 stated that a decrease of particle numbers in an OR reduces the surgical site infection for orthopedic surgery. Memarzadeh and Manning 12 studied different ORs with different ventilation systems. Their results show that laminar flow systems are the best choice for ORs. Pasquarella et al. 13 and Smith et al. 14 studied efficiency of LAF units in decreasing bacterial contamination and found a positive correlation between two variables. Chow et al. 15 investigated the integrated effect of decreasing the supply air velocity and different lamp positions. They found that different supply air velocities and lamp positions have slight effects on the thermal comfort but serious effects on the movement of infectious particles. They also performed numerical calculations. An increasing trend in the bacteria carrying particle (BCP) concentration was observed as the number of staff in the OR increased. Sadrizadeh and Holmberg 16 investigated the effects of a mobile LAF unit on the concentration, deposition, and distribution of BCPs in an OR and found that the airborne bacteria were decreased by adding a mobile LAF unit. El Gharbi et al. 17 used experimental measurements and mathematical modeling techniques to determine the thermal and relative humidity characteristics in an OR. They examined different variations of supply and exhaust air locations and found that the optimum way to sterilize the operating area was using unidirectional air supply. Woloszyn et al. 18 studied numerical simulation and experimental measurements of the airflow patterns and the contaminant distribution in an OR with a diagonal air distribution system.
Sadrizadeh et al. 19 investigated the effectiveness of vertical and horizontal ventilation systems in terms of reducing sedimentation and distribution of bacteria carrying particles in an OR. Their results show that a laminar and well-organized flow pattern is retired for a good result. 19 Sadrizadeh and Holmberg 20 investigated the effects of a mobile LAF unit on the concentration, deposition, and distribution of BCPs in an OR and found that the airborne bacteria were decreased by adding a mobile LAF unit. Liu et al. 21 investigated an alternative horizontal airflow and also evaluated the effectiveness of the horizontal unidirectional airflow to control infectious airborne particles through on-site test and CFD simulation design. Nastase et al. 22 reviewed the main European standards on design indoor thermal conditions and operation of HVAC systems for ORs.
Kobayashi et al. 23 developed a calculation model to predict vertical temperature profile in an impinging jet ventilation (IJV) system. They presented a parametric study on the supply air velocity is performed based on setting and its effect on the thermal stratification.
In this study, two ORs, one containing four (two near the flour and two near the ceiling) outlet grilles in two corners and one containing eight (four near the ceiling and four near the floor) outlet grilles in four corners, were modeled and analyzed in CFD program, upon which air flow, temperature, and relative humidity distribution have been examined.
Material and method
Theoretical formulation
The software ANSYS 14.5 Fluent was used for the CFD analysis. The standard k–ε model and the standard wall function were used as the computational tools. The simulation was conducted in steady-state condition. The transport equations of the standard k–ε turbulence model can be written as follows: 24
Conservation of mass equation

Momentum

where
Energy conservation

Turbulent kinetic energy

Dissipation rate of turbulent kinetic energy

The turbulent viscosity was computed using
The generation of turbulence due to buoyancy is given by
The discretized method selected for the convection terms was the second-order upwind scheme. The SIMPLE algorithm was chosen to couple pressure and velocity. The Boussinesq model was used to consider the buoyancy effect. The convergence criteria were set to 1 × 10⁻⁵ for all equations except energy, for which it was 1 × 10⁻⁶. The turbulent intensity and hydraulic diameter were 5% and 3 m, respectively. The distribution of the air exhaust was approximately 25% from the outlet diffusers near the ceiling and 75% from the outlet diffusers near the floor. Outlet type was chosen as “Outflow,” and flow rate weighting was set according to this information.
CFD model and meshing
The modeling of the two above-mentioned ORs was conducted using ANSYS 14.5 Workbench program, while numerical analysis was conducted using Fluent program. In order to confirm the accuracy of the analysis, the measurements were taken from the OR with outlet air provided from two corners and then compared to the results from the Fluent program. This OR, one of the ORs in Uludağ University Medical Faculty Hospital, is shown in Figure 1.

The operating room where the OR measurements were taken in.
OR inlet air is provided through 3.2 m × 3.2 m sized LAF unit. Outlet air is provided through two 0.525 m × 0.525 m sized outlet ports near the floor and two 0.425 m × 0.325 m sized outlet ports near the ceiling. The locations of LAF units set above two OR lamps are shown in Figure 1. The lamps were modeled in this way because the OR personnel prefers them in this location.
Modeled ORs are shown in Figure 2, while the mesh model is shown in Figure 3. The analysis was conducted with different mesh numbers for room with outlet air provided from two corners in order to test mesh independence and the obtained air velocity–height chart is shown in Figure 4. The analyses were conducted with 176,069; 248,562; 287,310; 316,591; 416,471 and 532,420 mesh numbers and it was observed that the air velocity related to the last three mesh numbers was almost identical. The analysis was conducted with 316 591 mesh number in order to shorten the CFD analysis conducting period.

CFD model of the operating room.

Mesh model of the operating room.

Mesh independency.
Validation
The air velocity, temperature, and relative humidity in the room were measured in six points of surface of the LAF unit, the average value was taken, and the average air inlet conditions were determined. Also, the air velocity was measured in spots located on a specific range from each other from the ceiling to the floor. Besides, the temperature and relative humidity in the area below LAF unit were measured, the average value was taken, and the room temperature and relative humidity were determined. Room temperature (To) was calibrated with reference to the standardized room temperature between 19°C and 22°C with 1° increase and inlet air velocity average was measured as 0.2 m/s. Velocity–height diagrams drawn using the conducted velocity measurements and the values obtained from the analysis are shown in Figures 5–8. As it can be observed from the charts, the room measurements results and CFD analysis results are rather close; thus, the analysis is verified.

Velocity–height graph for Tr = 19°C and Vi = 0.2 m/s.

Velocity–height graph for Tr = 20°C and Vi = 0.2 m/s.
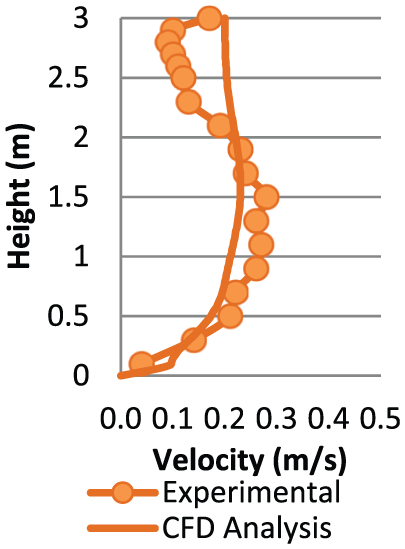
Velocity–height graph for Tr = 21°C and Vi = 0.2 m/s.

Velocity–height graph for Tr = 22°C and Vi = 0.2 m/s.
Recommendation for obtaining the optimal air distribution in ORs is to place eight outlet grilles in four corners; 2/3 of the air should be absorbed from the low-level grilles, while 1/3 of the air should be absorbed from the high-level grilles. 10 In order to observe how air velocity, temperature, and relative humidity will behave in the room measured and designed in above-mentioned way, the same room was modeled with outlet air installed in four corners and the CFD analysis of each room was conducted on To = 18°C–24°C with 1° increase. The analysis was conducted by keeping the temperature of the inlet air at 3°C lower than the room temperature. The temperature needs to be 2°C–3°C lower than the room temperature in order for air to descend curtain-like. In these conditions, the air density will be higher than the room air density; thus, with the effect of gravity, the air will be pulled down by its own weight. Also, CFD analysis was conducted in the same temperature conditions accompanied by 0.25 and 0.35 m/s inlet air velocities and the results were crosschecked.
Results and discussion
The numerical analysis of an OR with outlet grilles collecting air from two corners
The air velocity distribution if Vg = 0.2 m/s with section x = 2.8 m in an OR with air outlet provided from two corners is shown in Figure 9. At first glance, it may seem that distributions resemble each other. However, even though inlet air velocity is the same for each analysis, as the room temperature increases and the air density decreases, the air descending velocity decreases and the air does not fulfill its curtaining purpose. Buoyancy effect is efficient so air cannot overcome the thermal plumes and unidirectional flow was disrupted. High air velocity causes turbulence and disturbs the particles in the operating area, thus increasing the risk of infections. It can be said that the air curtain effect is formed better on low temperatures when the inlet air velocity is 0.2 m/s.

Velocity distribution for at x = 2.8 m for Vinlet = 0.2 m/s.
The air velocity distribution if Vg = 0.25 m/s with section x = 2.8 m is shown in Figure 10. In this velocity, the velocity distribution resembles the above mentioned Vg = 0.2 m/s. With the increase in inlet air velocity, the outlet air velocity increases as well and the air is directed toward the outlet grilles without descending sufficiently toward the floor. Particularly, with the increasing temperature, it is observed that there is an air movement around the OR table and toward outlet. These air movements can cause an increase in the number of particles.

Velocity distribution for at x = 2.8 m for Vinlet = 0.25 m/s.
The air velocity distribution if Vg = 0.35 m/s with section x = 2.8 m is shown in Figure 11. When this inlet velocity is taken into consideration, it can be observed that the room temperature does not significantly effect the air distribution. The velocity distribution is the same on every room temperature. Also, since the outlet velocity increased excessively, the air is quickly directed toward the outlet grilles. Air velocity around the table is high and it can cause the increase in the particles number.

Velocity distribution for at x = 2.8 m for Vinlet = 0.35 m/s.
The numerical analysis of an OR with outlet grilles collecting air from four corners
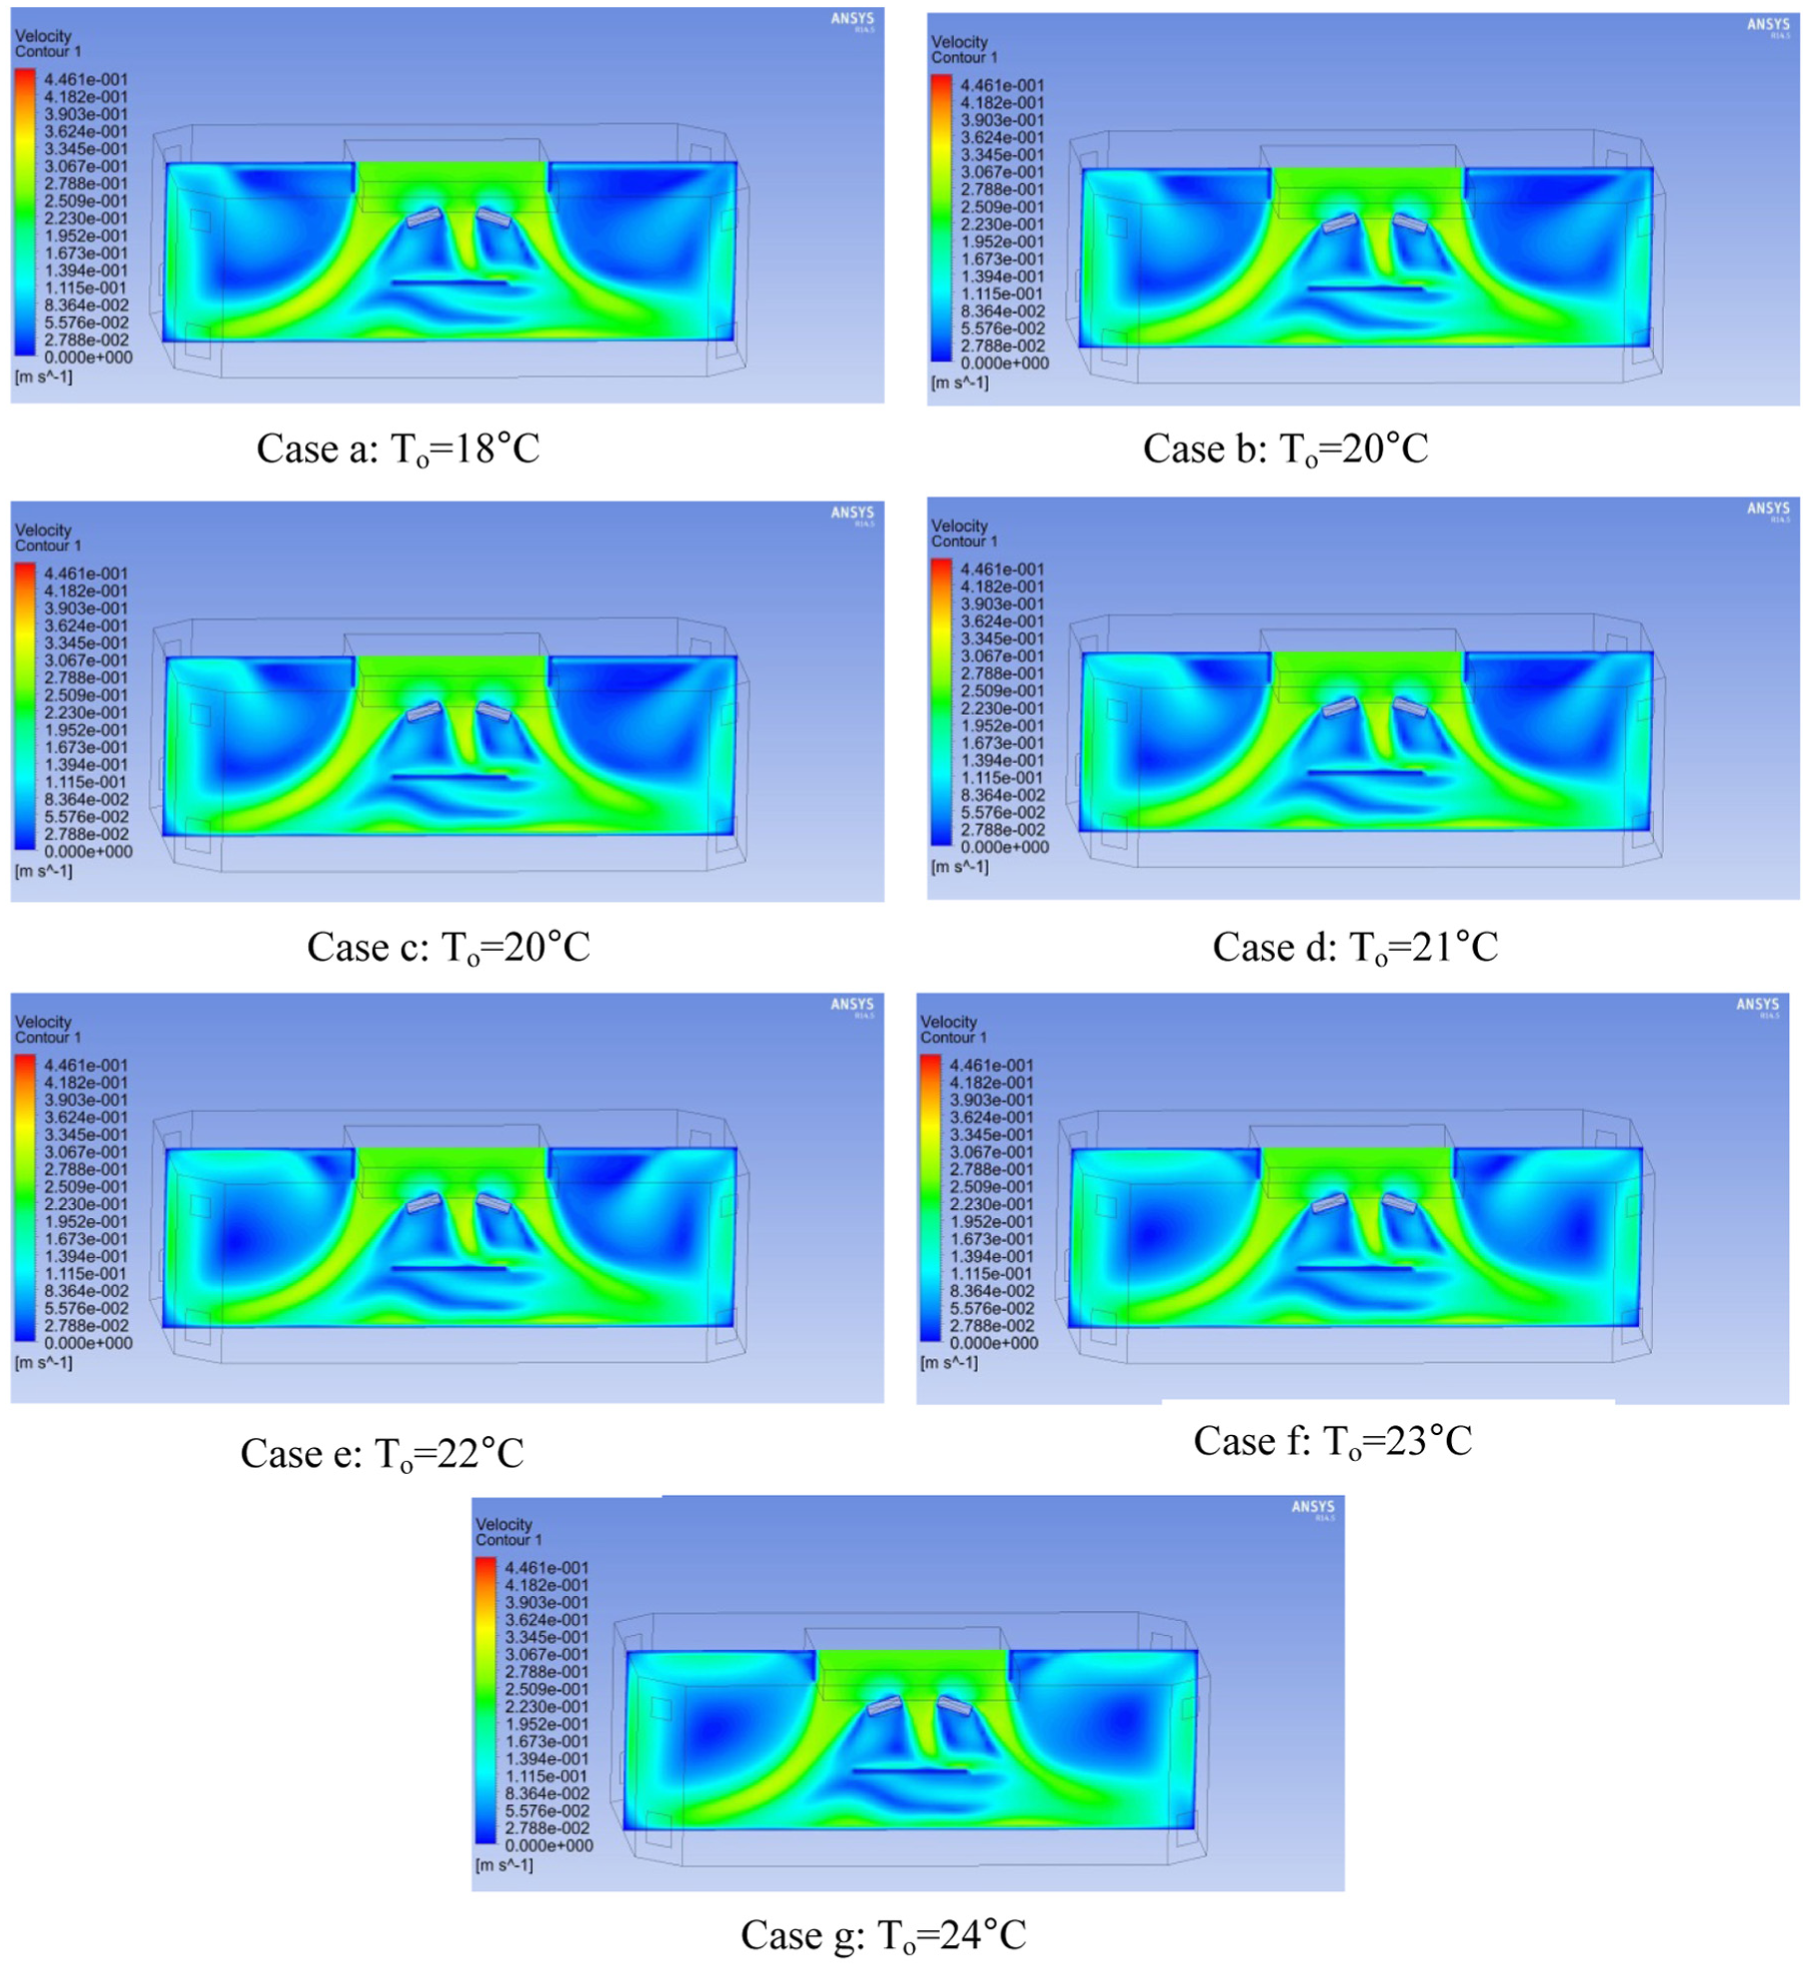
Velocity distributions for Vg = 0.2 m/s on different room temperatures are shown in Figure 12. If this air distribution in this system has been examined, it is observed that room temperature does not effect descending velocity of the air as much as in the other system. Since the inlet air is divided on eight grilles, the outlet air velocity is significantly lower. This obstructs the air from being directed to the outlet grilles to fast. Thus, the air descends toward the floor in a more regular fashion and forms a curtain. Since the air velocity is lower around the operating table, there is no turbulence and the particles are less dispersed comparing to the other system. Thermal plumes cannot disrupt the unidirectional flow pattern, so the analyses are nearly similar between 18°C and 24°C. When the area outside the operating area is examined, it can be observed that the air in this part to is more stagnant comparing to the other system. Thus, the number of particles dispersed from this area to the operating area will be significantly decreased.

Velocity distribution for at x = 2.8 m for Vinlet = 0.2 m/s.
The analyses conducted for the same system for Vg = 0.25 m/s and Vg = 0.35 m/s are shown in Figures 13 and 14, respectively. The velocity profile below the LAF unit resembles Vg = 0.2 m/s velocity, but it was observed that the velocity increased in relation to the inlet velocity. When the velocity increases, the air velocity outside the operating area increases in relation to the outlet velocity. This velocity is significantly lower comparing to the system where air outlet is conducted from two corners. It is easily observable from the analyses conducted on both systems that the lamps are breaking the air curtain. Since the air below the lamps is stagnant and the sweeping of particles in this area is obstructed, the number of particles in this area may increase. The air curtain can be properly formed in the system where air outlet is conducted from four corners with Vg = 0.35 m/s and the air stagnancy below the lamps can be prevented.
Velocity distribution for at x = 2.8 m for Vinlet = 0.25 m/s.

Velocity distribution for at x = 2.8 m for Vinlet = 0.35 m/s.
The air temperature and relative humidity in the room do not differ much depending on the system. The temperature and relative humidity distribution are nearly same at the measured temperature and inlet velocity in this study. As there is not much heat loss in the OR, the temperature and relative humidity value in the OR approaching the inlet conditions in a short time. For this reason, complete analysis results were not presented. The temperature distribution for both systems with section x = 2.8 m for To = 20°C and Vg = 0.35 m/s is shown in Figure 15, while the relative humidity distribution for To = 20°C and Vg = 0.35 m/s is shown in Figure 16.
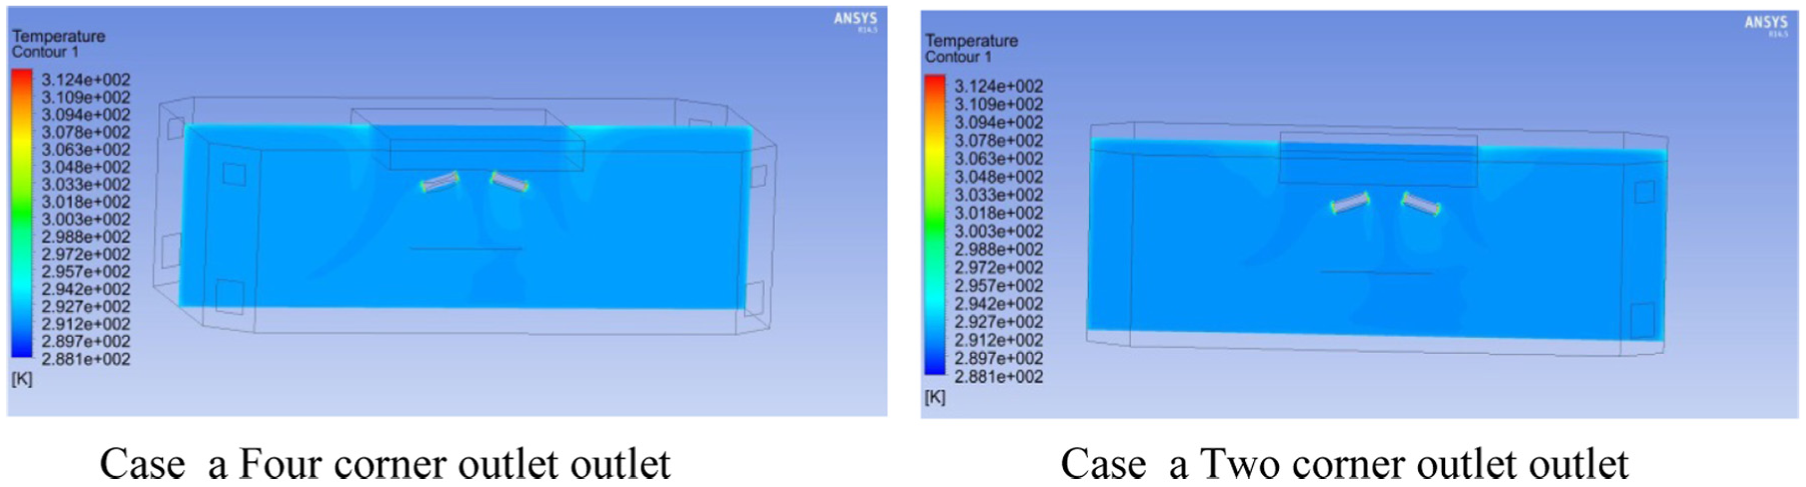
Temperature distribution at x = 2.8 m for To = 20°C and Vg = 0.35 m/s.

Relative humidity distribution at x = 2.8 m for To = 20°C and Vg = 0.35 m/s.
Conclusion
According to the obtained findings, the results were significantly better when eight outlet grilles, set in such way that 2/3 of the air is absorbed from the low-level grilles, while 1/3 is absorbed from the high-level grilles, were providing air flow from four corners comparing to the same operation conducted by four outlet grilles in two corners. Due to the large amounts of inlet air related to the LAF unit size, outlet air velocity is high when four grilles are installed and inlet air is directed to the exit without forming the air curtain. For the same reason, the velocities outside the OR area are quite high. The recommended inlet air velocity in the ORs with LAF unit system is Vg ≥ 0.23 m/s; however, it has been determined that velocity above 0.45 m/s is uncomfortable (Gaever et al.). The inlet air velocity increases in the systems with outlet grilles installed in two corners, thus preventing proper air distribution around operating table. With this system, the inlet air velocity should not be too high in order to prevent turbulence inside the room.
As mentioned above, the obtained air distribution is more regular if the system has outlet provided from four corners. Additionally, room temperature does not significantly effect the distribution when inlet air velocity is low. Besides significantly better air distribution provided within the OR area, the air velocity outside the operating area is lower comparing to the other system, thus decreasing the particle dispersion inside the room. If the inlet air velocity is kept around Vg = 0.25 m/s for comfort reasons, the forming of dead zone above operating table could be prevented by changing the lamp positions.
The effect of the two examined systems on the temperature and relative humidity was not significant. However, installing outlet grilles in four corners to provide proper air distribution inside the room is more appropriate since the main goal is to decrease the risk of an infection inside the room. Also, it has been demonstrated that increasing the inlet air velocity in the system with outlet grilles in two corners is not an appropriate solution.
Footnotes
Academic Editor: Oronzio Manca
Declaration of conflicting interests
The author(s) declared no potential conflicts of interest with respect to the research, authorship, and/or publication of this article.
Funding
The author(s) disclosed receipt of the following financial support for the research, authorship, and/or publication of this article: This work was supported by The Scientific Research Project Department of Uludag University under the Project No. OUAP (M) 2013/2.