
Abstract
This article introduces a detection method and apparatus for rapid detection of the content of ferromagnetic wear particles in the lubricating oil, as well as the signal processing circuit. Moreover, an electromagnetic sensor of transformer type is used; meanwhile, the content of ferromagnetic substances in the lubricating oil is detected by the detection of changes in relevant parameters of the electromagnetic sensors based on the fact that the existence of the ferromagnetic wear particles has resulted in the changes in spatial distribution of the magnetic field. Finally, the influence of non-ferromagnetic pollutants may be eliminated and a high linearity may be achieved with low cost and good real time.
Introduction
The lubricating oil, just like the blood of the mechanical equipment, is frequently used in mechanical transmission. Moreover, all the wear particles generated by the friction pair will flow into the lubricating oil, which will thus become a carrier of the mechanical wear information. By monitoring the ferromagnetic wear particles in the lubricating oil and making analyses based on the amount and the size of the ferromagnetic particles,1–4 the wear condition of the machine may be obtained. Besides, the running status of the machine may be predicted and the hidden troubles may be detected.5–9
Currently, there are many methods which can be employed in the ferromagnetic wear particles in lubricating oil, such as ferrographic analysis, spectrographic analysis, and particle counter.10–14
The ferrographic analysis technique is to separate the wear debris from the oil and impurities through the use of the high-gradient magnetic field. Then, the wear debris will be deposited on the glass sheet above the magnet field on a regular basis to form the ferrogram and then the size, shape, color, texture, and others of the wear debris thereon with the optical microscopy system can be observed to identify the wear type and make a classification. This technique is characterized by its capability of observing the size, profile, color, and the like of the wear particles. However, it requires sample pretreatment, as well as long detection cycle, complicated process flow, and high condition requirement. Moreover, the operators are required to have certain qualities and experience, which is not conducive to carrying out the test in scene.
The spectrographic analysis is based on the fact that each element has its unique atomic structure. When the atom absorbs additional energy, its extranuclear electron will transit from a lower energy level orbit to a higher energy level one where the atom is in an unstable state. The electromagnetic energy of a certain frequency must be released when the atom returns to the stable state from the unstable one and each element will emit light with a specific wavelength or color. Meanwhile, the line spectrum arranged based on the wavelength will be obtained after the dispersion of the radiated light and then the existence of some substance and its content may be determined based on the presence and strength of the corresponding characteristic spectral line, respectively. This technique features its capability of accurately analyzing the content (PPM level) of approximately 20 kinds (up to 32 kinds) of elements in the oil within 30 s as well as the concentration of various wear metals (Fe, Cu, Al, and Pb), additive elements (S, P, Ca, and Ba), and outside pollution element (Si) in the lubricating and hydraulic oils. However, it is bulky and large with high testing cost.
The basic principle of the particle counter can be described as follows: use the imaging of the wear particles contained in oil which is made when the oil samples flow through a capillary with a laser light source at one side and an optical amplification system as well as an image sensor at the other side and obtain the size and the number of the wear particles based on the size of imaging and the number of pulses. However, the drawback of the particle counter is the incapability of detecting the material of the particle. There are various types of particles of immense volume in the lubricating oil, such as carbon granules, oil sludge, and various oxides. 4 However, only the size and number can be recognized by the particle counter while the quantity of ferromagnetic wear particles cannot be reflected. The methods mentioned above are usually suitable only for laboratory analysis.
The approach proposed in this article is different from that of the traditional testing means using precision electronic balance which has high requirements for the surrounding environment and the preparation equipment. However, a dual secondary coil sensor based on the transformer principle with a cylindrical armature (ferrite core) is adopted as the core, while no closed magnetic circuit is provided to coordinate the high-precision sampling hold circuit for precise amplification, thus achieving the rapid metering of the wear particles. Based on this principle, an iron content monitor is accordingly developed as a lubricating oil wear particle analyzer with independent intellectual property rights. The proposed iron content monitor is not only characterized by simple operation, high degree of automation, and cost-effectiveness, but also has the relevant technical indicators equivalent to or better than that of foreign counterparts’ instrument.15–23 According to a report on the Shenzhen Yateks’ official website on 26 November 2015, “Monitoring instruments such as ferrous debris monitor and ferrograph developed by Yateks play an important role in Somalia escort.” The Chinese Navy has used the ferrous debris monitors and ferrographs from Yateks since the first escort mission, exerting an indispensable role through predicting and avoiding the equipment failure for many times. Through the continuous monitoring of engines, gear bearings, and other equipment, abnormal corrosion wears were predicted timely to avoid several possible cylinder scuffing accidents arising from water in the lubricating oil. Besides, the monitoring equipment of the company has been highly praised by the escort officers and soldiers, which are considered as the “protector of equipment life.”
The rest of the article is structured as follows. Conceptual design is introduced in the next section. To measure the iron content in the oil, detailed circuits are in the third section. The fourth section presents the development of a prototype apparatus, and experiments are carried out in the fifth section by comparing the developed iron content monitor and a ferrographic index instrument. Some conclusions are drawn in the last section.
Conceptual design
Based on the proposed precision electronic balance method as illustrated in the previous section, the conceptual design of the iron content monitor is shown in Figure 1.

Schematic diagram of the iron content monitoring system.
As shown in Figure 1, an exciting coil is composed of a magnetic core (cylindrical iron core which may be made of polyformaldehyde or the like) in the center and coils winding on the core. When an alternating current is passed through the exciting coil, an alternating magnetic field will be generated. A coil is respectively arranged at the equidistant ends of the exciting coil, one of which is used as the detecting coil and the other as the balancing coil. The two coils mentioned have the same impedance. On account of the presence of divergent fields of the same distribution near both ends of the exciting coil, the detecting coil and balancing coil arranged coaxially with the exciting coil and in the symmetrical position equidistant to corresponding ends of the exciting coil will induce two equal signals theoretically. A test plane is provided near one end of the detecting coil. If no oil sample under test (or no ferromagnetic wear particles contained in the oil sample) approaches the detecting coil from the test plane, the output of the two coils will be the same, which proves that there is no difference. If the oil sample containing ferromagnetic wear particles approaches the detecting coil, the magnetic circuit and magnetic field will be re-established due to the effect of small magnetic moment of the ferromagnetic wear particles to reach a new equilibrium system. That is, the ferromagnetic substance can lead to a deformation of the divergent field at the end of the exciting coil near the detecting coil (the central magnetic field enhanced). It makes the induction signal from the detecting coil stronger than that from the balancing coil, which further results in the imbalance between the outputs of the two coils and difference in output signals between them; the magnitude of ferromagnetism of the ferromagnetic wear particles may be represented after the comparison amplification, reshaping, integration, and other relevant conversion of this difference signal. Furthermore, the content of the ferromagnetic substance in the sample may be calculated based on the recognition of signal amplitude. That is, the deference of the induction signals of the two coils is used as the representation of the content of the ferromagnetic substance in the sample under test.
There are many factors for the representation of the ferromagnetic wear particle content in this way, such as the distance from the detecting coils to the exciting coil, the magnetic field intensity of the exciting coil, and the distance from the test plane to the detecting coil. As a result, it is hard to form a quantitative relationship. However, once the above factors are fixed, the content of the ferromagnetic wear particles in the lubricating oil is linear with the difference of the induction signals of the two coils. Therefore, the function relationship between the ferromagnetic wear particle content and the difference of the induction signals from the detecting coil and balancing coil personnel may be determined by any of the technicians through limited tests in a fixed detecting apparatus initially.
The grounding principle refers to that the ferromagnetic abrasive particles can cause changes in the magnetic permeability and thus lead to changes in the induced voltage of detecting coil. The sensor in the instrument uses exciting coil to excite the magnetic fields of balancing coil and detecting coil and then measures the induced voltage differential between detecting coil and balancing coil, followed by further analysis and processing. After differencing and processing, the two coils achieve a highly consistent balance. When the oil samples containing ferromagnetic abrasive particles are placed into the detecting coil, the bridge will output a differential voltage due to the increase in permeability. At this time, the content of ferromagnetic abrasive particles can be obtained on the basis of calibration and calculation. Currently, calibration quantity of the instrument is 0.1 mV differential bridge output = 1 PQ ferrous content (PQ index is used to indicate the ferrous debris content in the measured sample, which is a dimensionless value).
Measuring circuit design
The block diagram of the measuring circuit for the iron content monitor is shown in Figure 2. The circuit of this apparatus mainly includes the oscillator, sensor, detecting electric bridge, sampling holder, comparator, DC amplifier, digital-to-analog converter (DAC), and single-chip microcomputer. An oscillator will be used to generate a sinusoidal signal of 1–5 kHz, which can further provide an excitation signal to the magnetic core, thereby producing an alternating magnetic field; then via the detection of the electric bridge, the signal from the induction and balancing coils will be transmitted to the sampling holder and converted into the peak signal; the output peak signal will be compared and output by the DC amplifier, while the DC signal from the DC amplifier will be subjected to analog-digital conversion by the analog-to-digital converter (ADC) and then output to the single-chip microcomputer. The single-chip microcomputer will drive the displayer to display the measuring result and control the turntable, so as to send the oil container to the detecting coil. Normally, the output of the comparator will be zero when there is no ferromagnetic substance around the detecting coil. When the container with ferromagnetic debris is placed above the detecting coil, the output on both ends of the sensor will not be balanced any longer, neither will the peak signal output by the sampling holder. Besides, a DC signal proportional to the content of ferromagnetic debris will be output by the comparator, amplified by the DC amplifier and then converted to a digital signal by the ADC, after which it was processed by the single-chip microcomputer, and the result will be displayed by the displayer.

Block diagram of measuring circuit for the iron content monitor.
The schematic diagram of partial circuit of the oscillator is shown in Figure 3. The oscillator is an oscillating circuit consisting of the direct digital synthesis (DDS) signal generator IC4; operational amplifiers IC6A, IC6B, IC7A, and IC7B; power amplifier IC5; and peripheral resistance capacitor. The oscillation frequency of the sine wave signal generated by the oscillating circuit is 1 kHz, which may be changed by adjusting the circuit parameters during specific implementation, so as to keep it within the range of 1–5 kHz.

Schematic diagram of partial circuit of the oscillator.
The schematic diagram of partial circuit of the detecting electrical bridge is shown in Figure 4, where the sensor uses two electromagnetic coils with the same inductance value. One electromagnetic coil is used as the detecting coil La and the other as the balancing coil Lb. The detecting electric bridge is an imbalanced inductance bridge, including serial precision resistances R23 and R33. In between, there is a serial precision multi-coil potentiometer VR1, namely the first bridge arm. The second bridge arm is in parallel with the first bridge arm, including serial precision resistances R24 and R34, and in between, there is a serial precision multi-coil potentiometer VR2. The branch generated by R24 and R34 and that produced by R23 and R33 form a circuit through paralleling. The sliding end of potentiometers VR1 and VR2 divides the circuit into two parts which are connected with the detecting coils La and Lb, respectively. The output signals of La and Lb are S-org and B-org, respectively. The common end of VR2 and R34 and that of VR2 and R24 are the reference signal Base and the sensor output signal Sense, respectively. The adjustment of VR1 can ensure that the two resistance bridge arms share the same resistance, so that the signal output by La and Lb in working state can be adjusted to achieve the same amplitude. Moreover, the adjustment of VR2 can ensure the two resistance bridge arms having the same resistance, so that the signal output by La and Lb in working state can be adjusted to achieve the same phase. With respect to amplitude and phase adjustment, the same initial phase of two signal circuits can be obtained by means of impedance matching method, while at the same time the same initial amplitude can be achieved through the partial pressure. The signal phase adjustment makes the signal ahead/behind the original phase angle; the amplitude adjustment makes the output of the final signal controllable. These two kinds of adjustments are made independently, that is, the phase adjustment of the signal will not interfere with its amplitude adjustment.

Schematic diagram of partial circuit of the detecting electric bridge.
The schematic circuit diagram of the sampling hold circuit is shown in Figure 5. The sampling hold circuit consists of the sampling hold chips IC8, IC9, IC10, and IC11, and peripheral resistance capacitor, where four sampling hold chips are set all independent of each other. It aims further to sample and hold the positive and negative peak values of the induction signals generated by detecting coil La and balancing coil Lb, respectively. All the sampling hold chips adopt the high-precision one of type LF398.
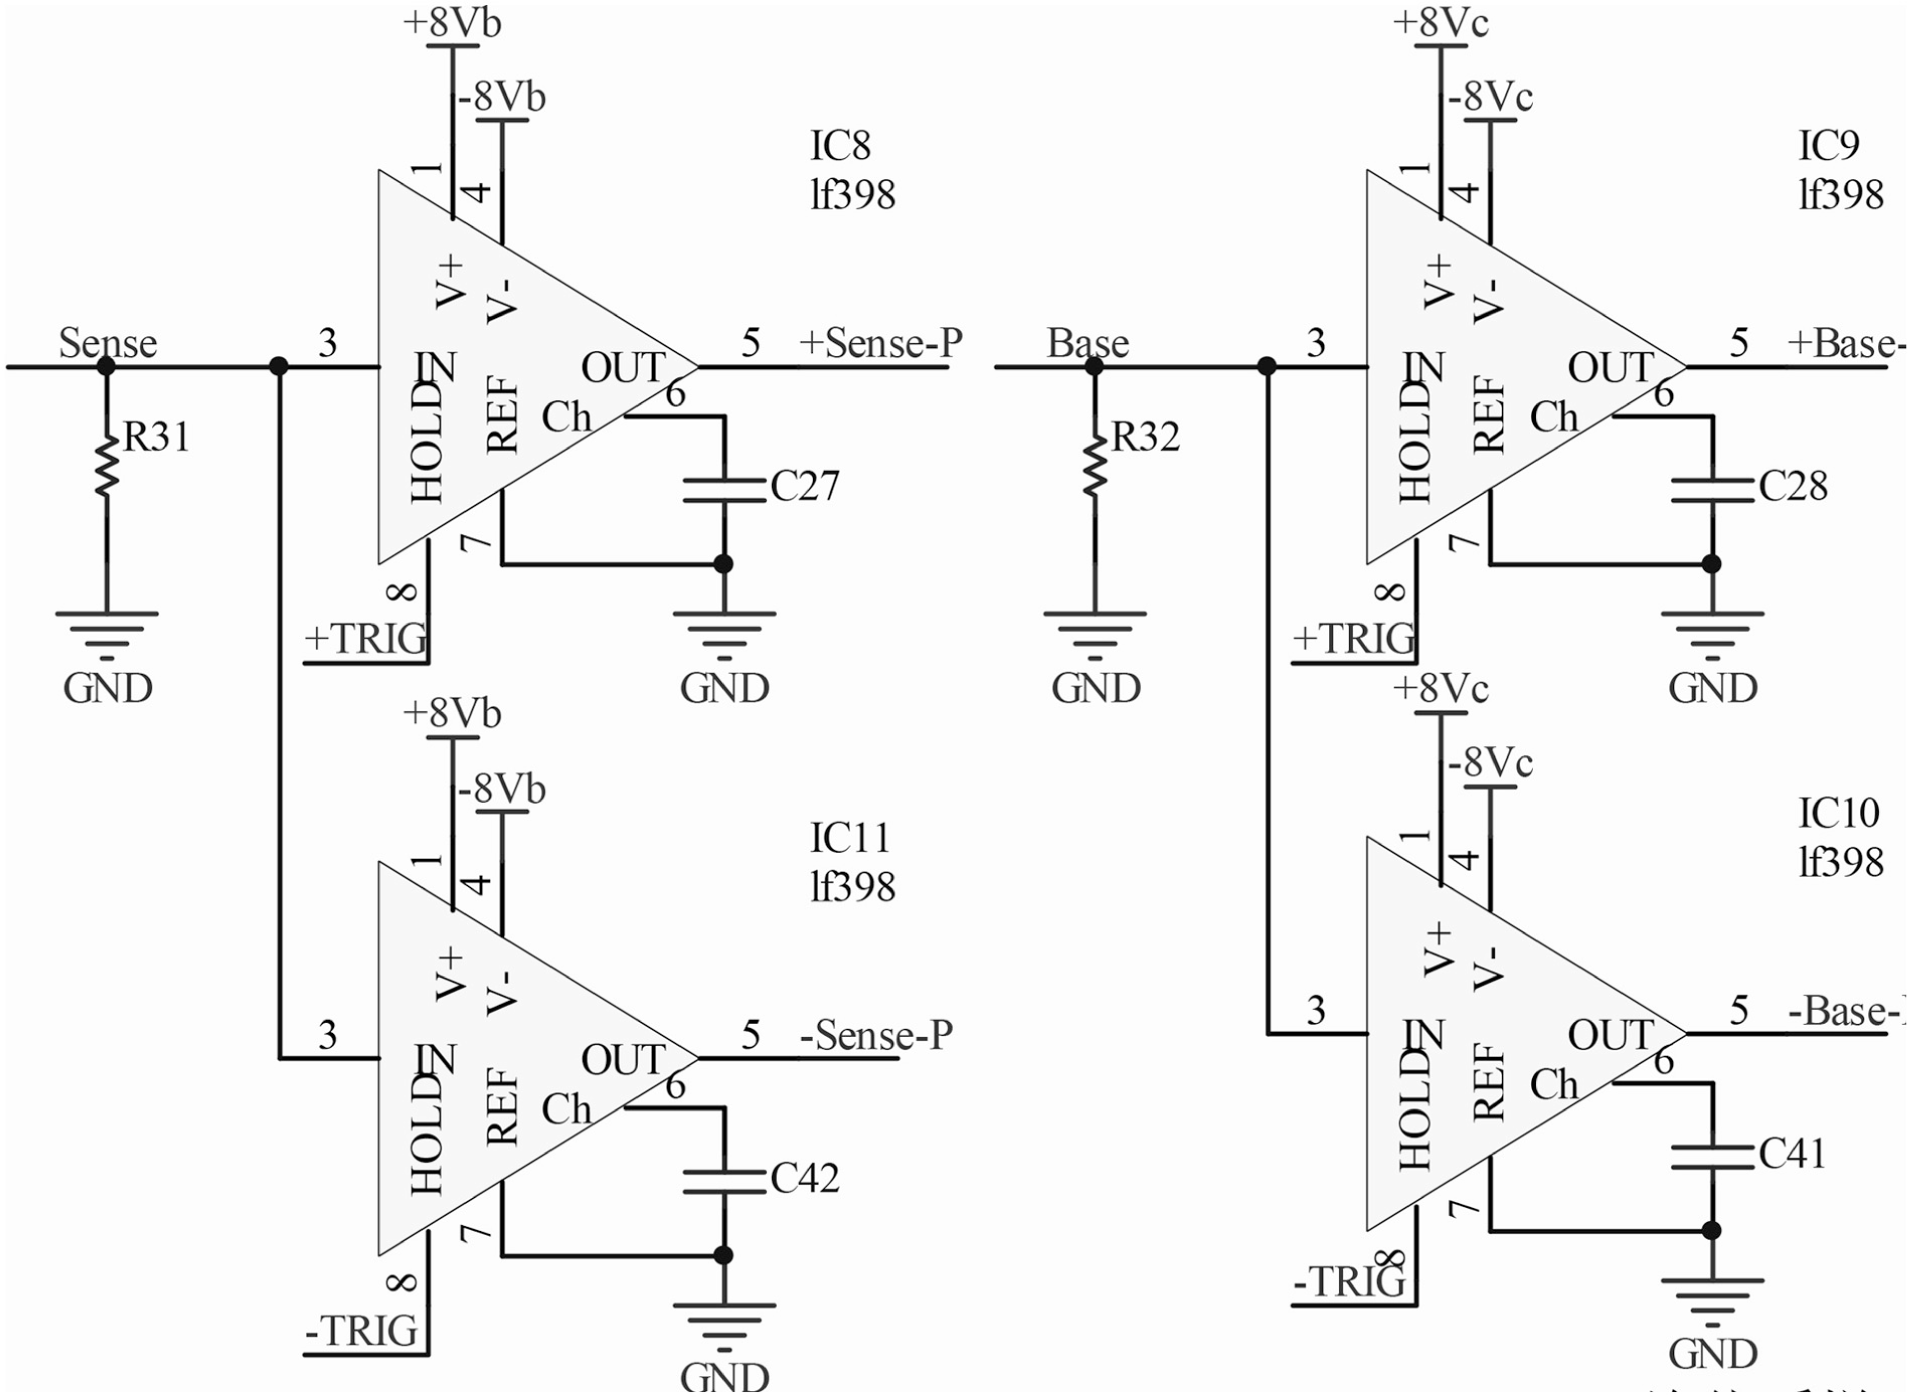
Schematic circuit diagram for sampling hold circuit.
The trigger angle of the sampling hold circuit is controlled by the trigger circuit, for which the schematic circuit diagram is presented in Figure 6. The trigger circuit is composed of the reference chip IC13; operational amplifiers IC14A, IC12A, and IC12B; potentiometers VR3 and VR4; and peripheral resistance capacitor. Here, the output signal of the detecting electrical bridge and the signal from the reference chip IC13 are transmitted to the triggering ends of the sampling hold chips, respectively, after the comparison with the operational amplifiers IC12A and IC12B. Besides, the signal from the IC12A will be output to the sampling hold chips IC8 and IC9 so as to hold the positive peak signal of the induction signal generated by the detecting coil La and balancing coil Lb; that from the IC12B will be output to chips IC10 and IC11 to hold the negative peak signal of the induction signal generated by the detecting coil La and balancing coil Lb. The trigger angle may be adjusted by adjusting two potentiometers.

Schematic circuit diagram for trigger circuit.
The schematic diagram of partial circuit of the comparator and DC amplifier is shown in Figure 7. The comparison circuit is composed of the operational amplifiers IC17 and IC18 (precise gain differential amplifier of type INA105), which is acquired by comparing the induction signals generated by the detecting coil La and the balancing coil Lb, respectively. The DC amplifier consists of the operational amplifiers IC15A, IC15B, and IC14B; the digital potentiometer IC16; and the peripheral resistance capacitor, where the signal from the digital potentiometer through the comparison circuit will be transmitted to the ADC after the amplification by the DC amplifier; furthermore, the output signals from the DC amplifier will be converted into digital signals by the ADC and input to the single-chip microcomputer for processing algorithm.

Schematic diagram of partial circuit of the comparator and DC amplifier.
Balancing coil is used as a benchmark against the detecting coil and the balancing coil, and detecting coil parameters are highly inhibited. The two coils are subjected to differential bridging. Due to the same environment (temperature, humidity, and electromagnetic field), they can suppress the existing environment to cause temperature drift and magnetic field interference. Furthermore, common- and differential-mode filters are set at the bridge, which can effectively suppress the white noise generated by the two coils. Finally, the phase and amplitude differences between the two coils can be adjusted via the phase and amplitude adjustment circuit to achieve a high degree of balance of the bridge comprising two coils, thus allowing higher sensitivity and more accurate detection of oil samples.
Prototyping
After the conceptual design and the measuring circuit design, a prototype device of the iron content monitor is developed, as shown in Figure 8. As shown in the figure, main components of the monitor were mounted in the base to form an integral one. The top of the base is provided with the cover plate on which the exciting coil is mounted (vertically for easy use) and fixed by the circular ring with a notch. The detecting coil is provided above the cover plate and the balancing coil below it, both of which are set symmetrically and equidistantly relative to the excitation coil. Besides, the turntable mounted above the cover plate is the test plane, which will be driven to rotate by the motor fixed inside the base. The transformer is fixed inside the base, through which the AC mains can be converted into the required voltage to be supplied to the motor and other circuits. The display is provided outside the base, which may be used to display the measurement values and may adopt a digital tube or a liquid crystal display screen and so on.24–32

Prototype of the iron content monitor.
Experiments
The developed iron content monitor was tested in the Oilcare oil test laboratory of China National Analytical Center, Guangzhou (NACC). Ten oil samples (namely, #1, #2, …, #10) were collected as the experimental materials. The present monitor was used to measure the iron contents in the oil samples. For comparison, a ferrographic index instrument (Kittiwake ANALEX PQM, UK) was also employed to measure the same oil samples. To double check the robustness of the experiments, for each oil sample, the two instruments were applied to measure the iron content for 10 times. Moreover, the experiments were repeated on the next day. In this way, we recorded the measurement results for all the oil samples as shown in Figure 9.
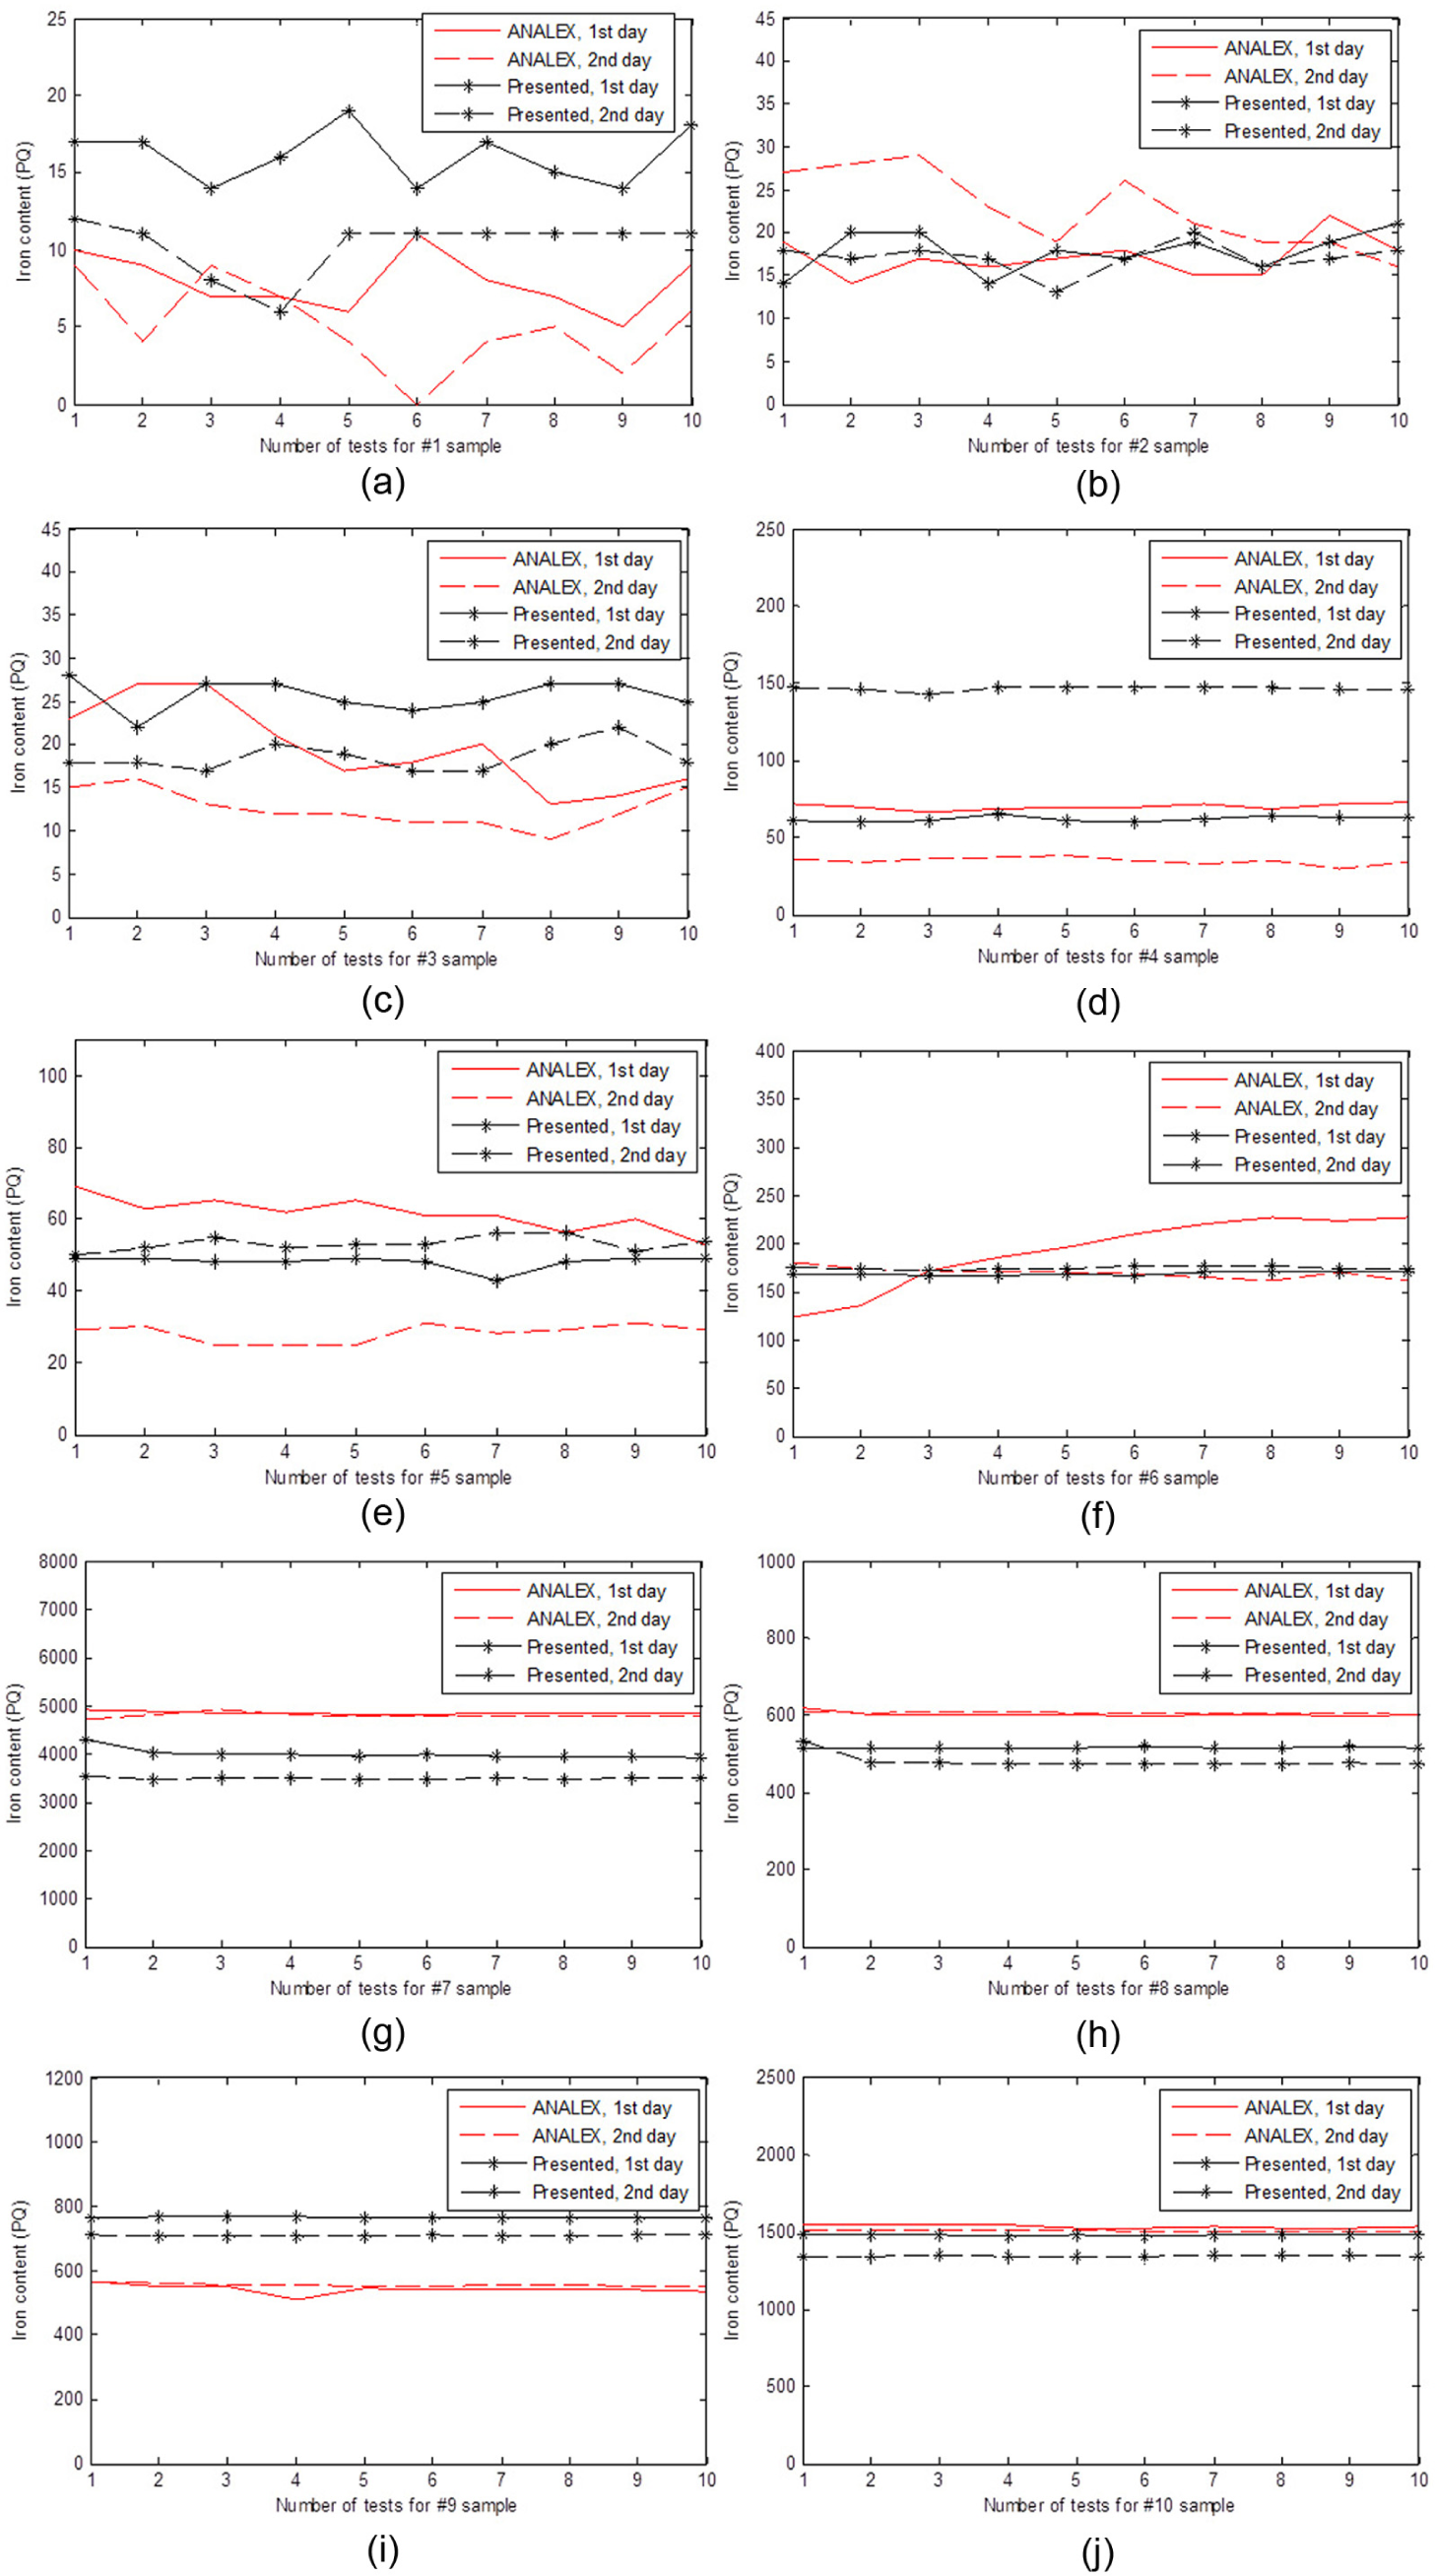
Comparison of the experimental results: (a) #1 sample, (b) #2 sample, (c) #3 sample, (d) #4 sample, (e) #5 sample, (f) #6 sample, (g) #7 sample, (h) #8 sample, (i) #9 sample, and (j) #10 sample.
In addition to the direct comparison between the presented iron content monitor and the existing ferrographic index instrument, we further compare the statistic variable of the experimental results, as shown in Table 1.
Statistic comparison for the experimental results between the ferrographic index instrument and the presented iron content monitor.

The detection data of two groups of 10 kinds of oil samples are compared with the detection results of the proposed iron content monitor by the Oilcare oil test laboratory of China National Analytical Center, Guangzhou (NACC) using the UK Kittiwake ANALEX PQM ferrographic index instrument, as shown in Table 1. The results show that the mean value of the presented iron content monitor is almost identical to that of the ferrographic index instrument, while the general standard deviation is better than the peer instrument.
Conclusion
The detection is carried out by detecting the changes in parameters of the transformer type electromagnetic sensor, which was caused by the spatial magnetic field changes due to the deposited wear debris. It may naturally eliminate the influence of the accumulation and pollutants and thus achieve a high linearity.
A circuit for detection of weak signal is adopted to eliminate the existed interferences (such as white noise, temperature drift, phase difference of the initial state, amplitude difference, and electromagnetic field effects) as many as possible in a simpler realization way so that the weak useful signal can be accurately detected and amplified, after which it would sent into a safe zone as quickly as possible. The differentiation of the useful signal and interference signal is used to make the two differentiated, so as to complete the signal screening, thus achieving the optimization of the signal.
It takes 5 s for the ferrous debris monitor to detect single sample each time. By contrast, ferrograph requires a detection time of about 10 min, and the oil spectrometer requires a detection time of about 10 min.
It is found through the comparison test between the TTL-3 iron content monitor and the UK Kittiwake ANALEX PQM ferrographic index instrument that the reproducibility and overall standard deviation of the TTL-3 iron content monitor have reached or exceeded the level of that of the foreign counterparts’ instruments.
Footnotes
Academic Editor: Dong Wang
Declaration of conflicting interests
The author(s) declared no potential conflicts of interest with respect to the research, authorship, and/or publication of this article.
Funding
The author(s) disclosed receipt of the following financial support for the research, authorship, and/or publication of this article: This work was supported by the International S & T Cooperation Program of China (2013DFG60080) and the Research Program of Higher Education of Guangdong (2016KZDXM054 and 2016KQNCX165).