
Abstract
An L-shaped multihole-buffering oil-feeding process is proposed, optimized, and experimentally validated to reduce the shock and disturbance to in-tank oil and bottom sediment caused by oil-feeding. Three-dimensional numerical simulation of the flow field inside the oil tank based on the computational fluid dynamics method is conducted using FLUENT software. The influences of design parameters of L-shaped multihole-buffering inlet tubes on the flow field are analyzed, and structures are optimized according to orthogonal testing. The reliability of the numerical simulation results is confirmed by field testing the optimized L-shaped multihole-buffering inlet tubes. Results indicate the following conclusions: (1) after adoption of the L-shaped oil-feeding process, the flow properties of in-tank oil are effectively improved including reduced oil outlet velocity, decreased degree of disturbance between flow points and improved outlet oil quality, as compared to results obtained by traditional I-shaped and J-shaped oil-feeding processes; (2) structural parameter optimization resulted in a decrease of turbulence energy around the outlet tube entrance from 0.004572 to 0.003154 m2 s−2, while the concentration of oil pumped from the outlet tube increased from 95.19% to 99.23%, demonstrating clear advantages of the proposed optimized scheme; (3) the variation regularity of the water and mechanical impurities contents in the oil pumped from the tanker is in accordance with simulated results, as the liquid height. The accuracy and reliability of the numerical computation method are validated based on the aforementioned observations.
Keywords
Introduction
The rapid development of the automobile industry has resulted in certain problems for gas stations which require urgent reform. For example, refueling must be interrupted during the oil unloading process, resulting in comparably long latency times and the loss of customers. Thus, improving refueling efficiency while ensuring safety and oil quality requires prompt solutions. 1 Therefore, this study proposes improvements to the traditional oil unloading and refueling processes which will ensure oil quality and operation safety while simultaneously increasing the economic and social benefits to gas stations.
Oil tanks in conventional Chinese gas stations are typically located underground. Oil is usually discharged by gravity unloading, and the in-tank inlet tubes are typically I-shaped or J-shaped. These two types of feeding processes greatly disturb bottom sediment within the oil tanks. Additionally, the inlet and outlet lines are installed in close proximity to one another; thus, simultaneous unloading and refueling processes result in uptake of the water and sediment at the bottom of the tank which will be pumped out, thus affecting oil quality. In areas such as North America, Europe, and Southeast Asia, plastic buried double-wall tanks reinforced by glass fiber and plastic composite tubes with strong corrosion resistance are constructed to avoid spilling or leakage from tanks and tubes. 2 Alternatively, Middle Eastern, Indian, and South Korean oil producers construct oil depots, which are connect to gas stations via tubes, thus avoiding many operation safety and oil quality issues caused by suboptimal unloading or refueling processes. Therefore, there are few research results concerning related issues.3,4
In recent years, an increasing number of scholars have begun to apply computational fluid dynamics (CFD) to the study of in-tank flow problems. Shi Shaolei from the China University of Petroleum adopted the realized k–ε turbulence model to simulate the flow behavior of high-viscosity crude oil in tank outlets. The SIMPLEC algorithm was applied to obtain the distributions of the pressure and velocity fields of high-viscosity crude oil flow. 5 X Guo 6 from Dalian Maritime University simulated the temperature decrease of crude oil at various heights within a given period of time based on the heat-transfer model and subsequently analyzed the temperature and velocity fields.
This study aims to develop and optimize the unloading and refueling processes conducted at gas stations. The in-tank flow was simulated using FLUENT software, based on CFD. The proposed L-shaped multihole-buffering inlet tubes were optimized, and numerical simulation and experimental results were conducted to verify the applicability of obtained results. The results of the current study can also provide references for similar design processes.
Basic theory
According to related oil unloading regulations 7 and with a suitable FLUENT multiphase flow model, the basic control formula of the selected mixture model is used for numerical calculation in order to get acquire simulation results.
Selection of turbulence model
There are seven common types of turbulence flow models provided by FLUENT software: Spalart–Allmaras model, standard k–ε model, RNG k–ε model, realizable k–ε model, standard k−ω model, SST k–ω model, and RSM model. RNG k–ε model suits for low Reynolds number flow viscosity and has higher reliability and accuracy in the calculation of the near-wall region. Therefore, RNG k–ε model is used to analyze the flowability of the fluid inside the tank.
Equations of the RNG k–ε model


where
Selection of multiphase flow model
The simulation of a flow field via numerical approaches includes mesh generation, selection of a computational method, physical model determination, the setting of boundary conditions, definition of material properties, and the post-processing of simulation results.
There are three types of multiphase flow models provided by FLUENT software: the volume of fluid (VOF) model, the mixture model, and the Eulerian model. 8 The mixture model is particularly suitable to calculate the separation of particles or oil drops under the action of gravity, centrifugal force, or other body forces. As the particle distribution regularity in the simulated flow field is ambiguous, the mixture model is most suitable for the simulation of in-tank flow fields.
Basic control equations of the mixture model
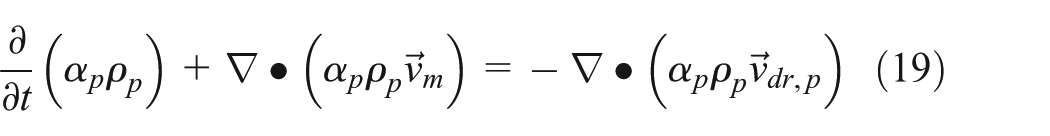
Continuity equation
The continuity equation of the mixture model is described as follows


where t is time, s;
Momentum equation
The momentum equation of the mixture model is defined as follows

and


where n represents the phase number;
Relative speed and drift speed
The relative speed, also referred to as the sliding velocity, is defined as the speed of the second phase p compared to the major phase q, as follows

The relation between the drift speed

The algebraic slipping equation is used in the FLUENT mixture model. The relative speed is defined as follows

where

where

The expression of the acceleration speed

Volume fraction equation of the second phase
Based on the continuity equation of the second phase p, the volume fraction equation can be described as follows
Analytical example
Basic parameters of three types of oil-tank feeding processes
In traditional I-shaped oil-feeding processes, the inlet tubes and refueling tubes share the same point of entry. The inlet tubes extend downward to approximately 0.2 m above the tank bottom, with straight openings or inclined openings of 45°, as shown in Figure 1. In J-shaped oil-feeding processes, the inlet tubes and refueling tubes share the same point of entry. The inlet tubes stretch downward to a distance of 0.2 m above the tank bottom. The lower ends of the inlet tubes are bent upward at an angle of 180°. The detailed design of L-shaped multihole-buffering oil-feeding tubes includes elbows with connectors of two sizes installed at the ends of the original oil inlet. The larger end is fixed at the inlet end with 5-mm-thick aluminum plates held in place by flush bolts. An inclined machine surface of 45° is installed on the surface of the aluminum plate and the original oil inlet to facilitate easy installation. The ends of the flush bolts must be lower than the surface of the aluminum plate so as to avoid the generation of sparks during insertion. The smaller end is connected to the buffer tube of 2.7 m in length. A total of 13 oil outlet holes are machined on the top of the buffer tube at intervals of 0.2 m. The buffer tube end is sealed by blind plates, which are designed to be dismantled during tank cleaning to make it easier to remove impurities from the horizontal tubes. The new addition of the in-tank horizontal outlet tube is located 100 mm from the lank bottom and distributed in an L-shaped. The outlet tube is welded to the tank bottom at three points at identical distances to the supporting points of the tubes. Three oil-feeding processes are depicted in Figure 1. The blue lines represent the I-shaped process; both the blue and red lines represent the J-shaped process, and the combined blue and green lines represent the L-shaped process.

Vertical view of three oil-feeding processes.
The underground oil-tank model used in the current simulation is a standard 30 m3 horizontal underground oil tank used in gas stations. Based on the preliminary design of the oil-feeding model, an oil tank with an L-shaped multihole-buffering inlet tube is constructed in GAMBIT, with the detailed dimensions listed in Table 1.
Geometrical dimensions of the model.

Setting of boundary conditions
Inlet boundary condition
The inlet boundary condition is set as the velocity inlet. The inlet flow velocity is 0.85 m/s and assumed to follow a uniform distribution.
Outlet boundary condition
The outlet boundary condition of the oil outlet tube end is set as the pressure outlet with an outlet pressure of 207,000 MPa.
Model mesh generation
Tetrahedral meshes are generated at the horizontal outlet tube and inlet tube, and in the surrounding areas. The remaining portions of the elbow and the tank body are meshed with tetrahedral and hexahedral meshes, respectively. The 3D meshes used for oil tanks are depicted in Figure 2. A locally enlarged view of a portion of the horizontal outlet tube mesh is presented in Figure 3, while the mesh used for the outlet hole and surrounding areas is displayed in Figure 4.9,10
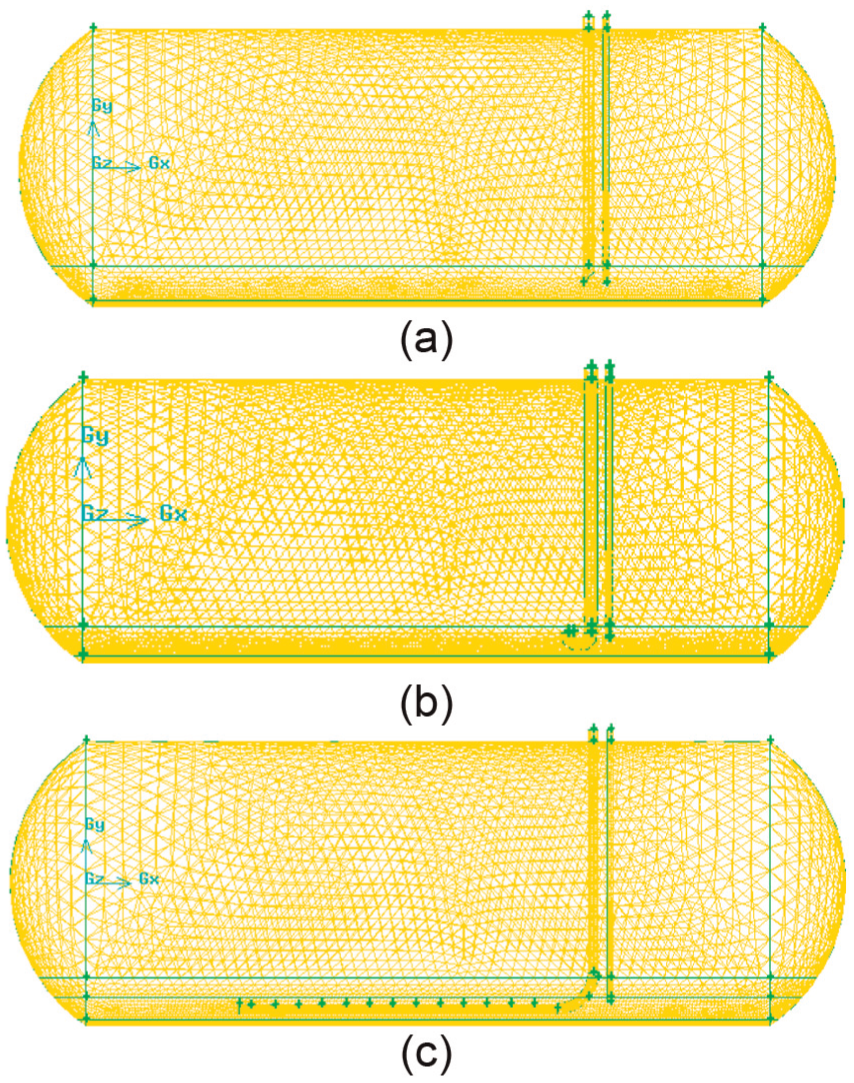
(a) 3D mesh model of the T-shaped oil-feeding tank, (b) 3D mesh model of the J-shaped oil-feeding tank, and (c) 3D mesh model of the L-shaped oil-feeding tank.

Locally enlarged view of the mesh of the horizontal outlet tube.
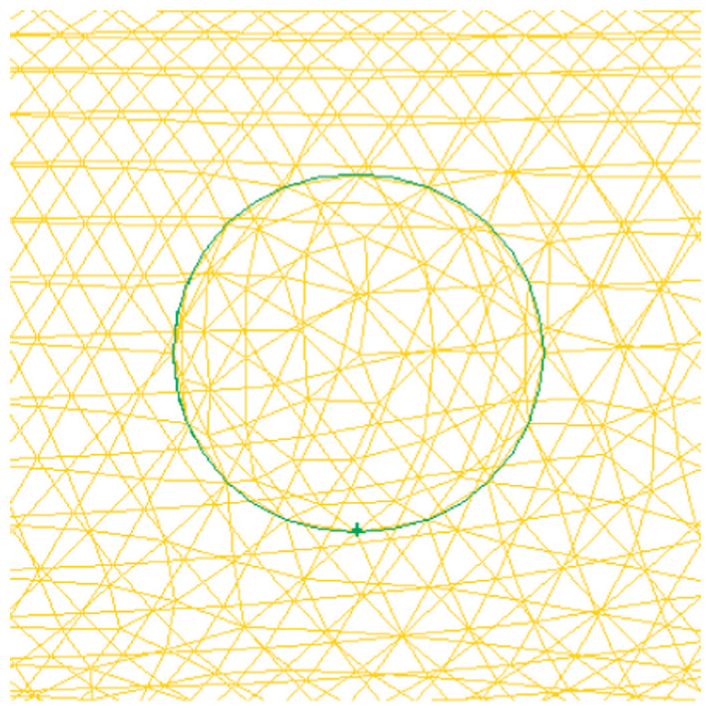
Locally enlarged view of the mesh of the outlet hole.
Physical parameters
Water and oil have been taken into consideration as two phases. The medium used in the simulation consists of 0# diesel. The in-tank temperature is 20°C. The physical parameters of the 0# diesel at 20°C include a density of 833.0 kg/m3 and a kinetic viscosity of 0.0025 Pa s.
Numerical simulation results
Improved results achieved with the proposed model are reflected in three particular aspects: velocity field, turbulence energy, and concentration field.
Velocity field distribution
The effect of incoming oil on the in-tank oil can be characterized according to the analysis of the velocity field distribution. The end velocity of I-shaped and J-shaped inlet tubes are equal to the inlet velocity of 0.85 m/s, according to the incompressible fluid continuity equation. The calculated Reynolds number far exceeds 20,000, indicating that the oil always remains in a state of turbulence. Alternatively, the outflow velocities of the 13 end holes of an L-shaped inlet tube are between 0.1052 and 0.5786 m/s, with corresponding to Reynolds numbers between 345.14 and 10354.33. Results thus indicated that the L-shaped oil-feeding process results in decreased outflow velocity, reduced Reynolds numbers, and decreased kinetic energy of the outflow. Therefore, oil outlet velocity can be decreased by applying a multihole design to the horizontal section of inlet tubes, and the flow properties of in-tank oil can be effectively controlled.
Turbulence energy distribution
Turbulence energy is the index of flow stability; lower turbulence energies result in lower degrees of a disturbance between particles. It is necessary to investigate the turbulence energy distribution in the surrounding areas of the inlet tube and outlet tube, in addition to that of the in-tank area.
Turbulence energy around the inlet tube and the outlet tube
The total simulation period consisted of 45 min. The fluid turbulence energy in the areas surrounding the inlet tube end and the outlet tube entrance is displayed in Tables 11 and 12 in Appendix 1.
Results indicate that within the 45-min unloading process, the turbulence energy of the L-shaped process is much lower than those of the I-shaped and J-shaped processes. Moreover, as the oil unloading time increases, the turbulence energy of the fluid around the outlet tube entrance in the L-shaped process decreases, and the degree of disturbance among fluid particles sharply decreases. After 30 min, the turbulence energy is maintained within a certain range. The influence of the outflowing oil from the inlet tube on the fluid around the outlet tube entrance is comparably stable.
In-tank turbulence energy
The variation of the in-tank turbulence energy with various bottom heights in three oil-feeding processes is analyzed. Results are displayed in Figure 5.
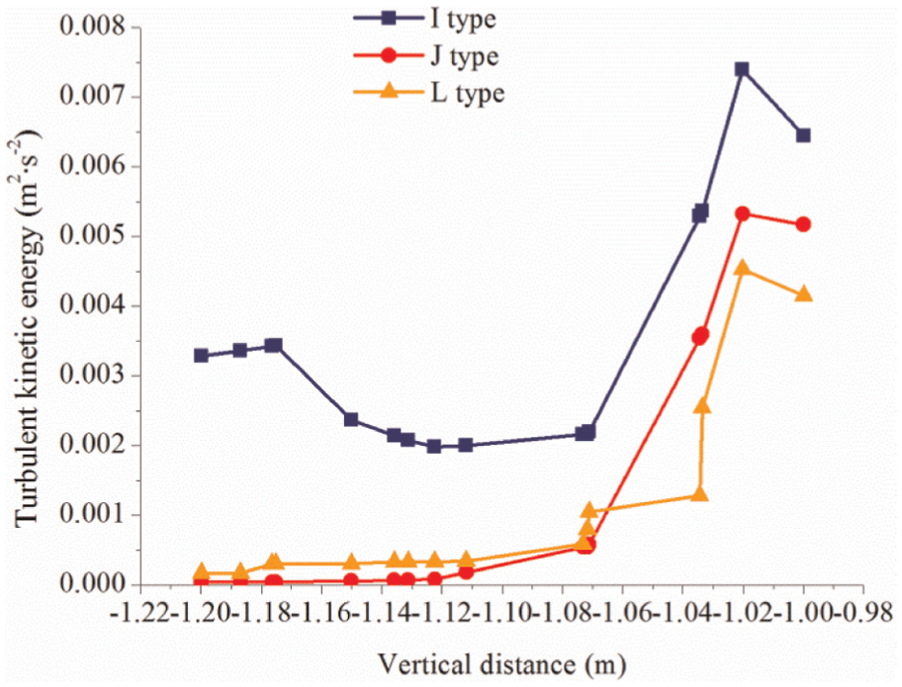
The distribution of turbulence energy in the vertical direction around the entrance of the outlet tube.
As shown in Figure 5, the average turbulence energy values of the area below Y = −1.15 m in both the J-shaped and L-shaped processes are comparably low and similar to one another. Alternatively, the average turbulence energy in the same area for the I-shaped process is much greater than the other two processes. In the area above Y = −1.07 m, the average turbulence energy increases nearer to the inlet tube entrance. The turbulence energy for all three studied processes reaches a maximum value at Y = −1.02, while the average turbulence energy of the L-shaped process in the same area is consistently lower than that observed in the other two studied processes.
In summation, the L-shaped process can reduce the impact of oil unloading on the bottom water and sediment as compared to traditional oil-feeding processes, while the oil outflow from the inlet tube exhibits relatively weak influence on the fluid around the inlet tube entrance. Thus, the disturbance between fluid particles is improved by the proposed model.
Concentration field distribution
The oil-phase concentration is an important index of fluid particle disturbance and the degree of oil-water mixing in oil tanks. To decide whether the mixing of water and oil during unloading and refueling can ensure the quality of oil, numerical simulation is used to determine the oil-phase concentration of the outflow oil, 11 as described in Table 13 in Appendix 1. The detailed oil-phase concentration distributions around the outlet tube entrance and in the tank symmetry plane after 30 min are displayed in Figure 6.

Oil-phase concentration distributions in different oil-feeding processes: (a) I-typed, (b) J-typed, and (c) L-typed.
According to Table 13 in Appendix 1 and Figure 8, the degree of oil-water mixing in the I-shaped process and the corresponding water concentration observed in the oil/water interfacial layer are greater than those observed with other processes. Additionally, the oil-phase concentration distribution difference is relatively larger using the I-shaped process, which is not beneficial to operation. In the J-shaped process, the oil concentration in the oil/water interfacial layer is higher than that observed in the other two processes. However, flow swirl occurs around the outlet hole of the inlet tube, indicating the possibility of high quantities of oil mixed with water being pumped out. In the L-shaped process, flow swirl also occurs around some large outlet holes in the horizontal section of the inlet tube, but the oil leakage is favorably buffered. Thus, the transition between oil and water is relatively smooth. The contour lines in the outlet tube entrance interface and the surrounding areas are nearly horizontal and exhibit high oil concentrations. Thus, the stable outflow of oil in the outlet tube is effectively ensured. The above results indicate that the design of outlet holes in inlet tubes has great influence on the concentration field distribution within oil tanks. It is necessary to determine the optimal design parameters of the L-shaped multihole-buffering inlet tubes by considering factors such as hole orientation and dimension, so as to ensure the pumping of high-quality oil.
Optimal parameter design of L-shaped multihole-buffering inlet tube
The above results indicate that L-shaped multihole buffering of inlet tubes is advantageous. -shaped The optimal design of this type of inlet tube is required for the further design of oil-feeding processes, achieved by orthogonal testing.
Orthogonal tests of L-shaped multihole-buffering inlet tube design parameters
Orthogonal test method (also known as Orthogonal Experimental Design) is employed to study multi-factor and multi-level test by mathematical statistics method. The method uses some representative points selected from the full-scale test which have the characteristics of homogeneous and neat. Through a few typical tests to identify how the factors influence the test index and put the factors in primary and secondary sequences. Then find the optimal parameter combination. 12
Influencing factors and level selection
In this study, FLUENT software is employed to simulate in-tank oil flow behavior during simultaneous unloading and refueling operations. Simulation parameters include six factors: installation height of the inlet tube (the distance from the horizontal section of the inlet tube to the tank bottom), the diameter of the inlet tube, as well as the size, number, orientation, and interval between holes in the inlet tube. An optimal combination of parameters may be obtained by analysis and selection according to orthogonal test results.
Orthogonal test tables are designed on five levels to evaluate the influences of the above six parameters on the fluid particle disturbance and the degree of oil-water mixing during simultaneous unloading and refueling. The factor levels are depicted in Table 2. 13
Influencing factors and level tables.

The orthogonal simulation results are listed in Table 14 in Appendix 1. 14
Orthogonal test results
The intuitive analysis method (also known as the range analysis method) is employed to characterize the orthogonal test results due to its simple operation, strong practicality, and low computation complexity.
Intuitive analysis
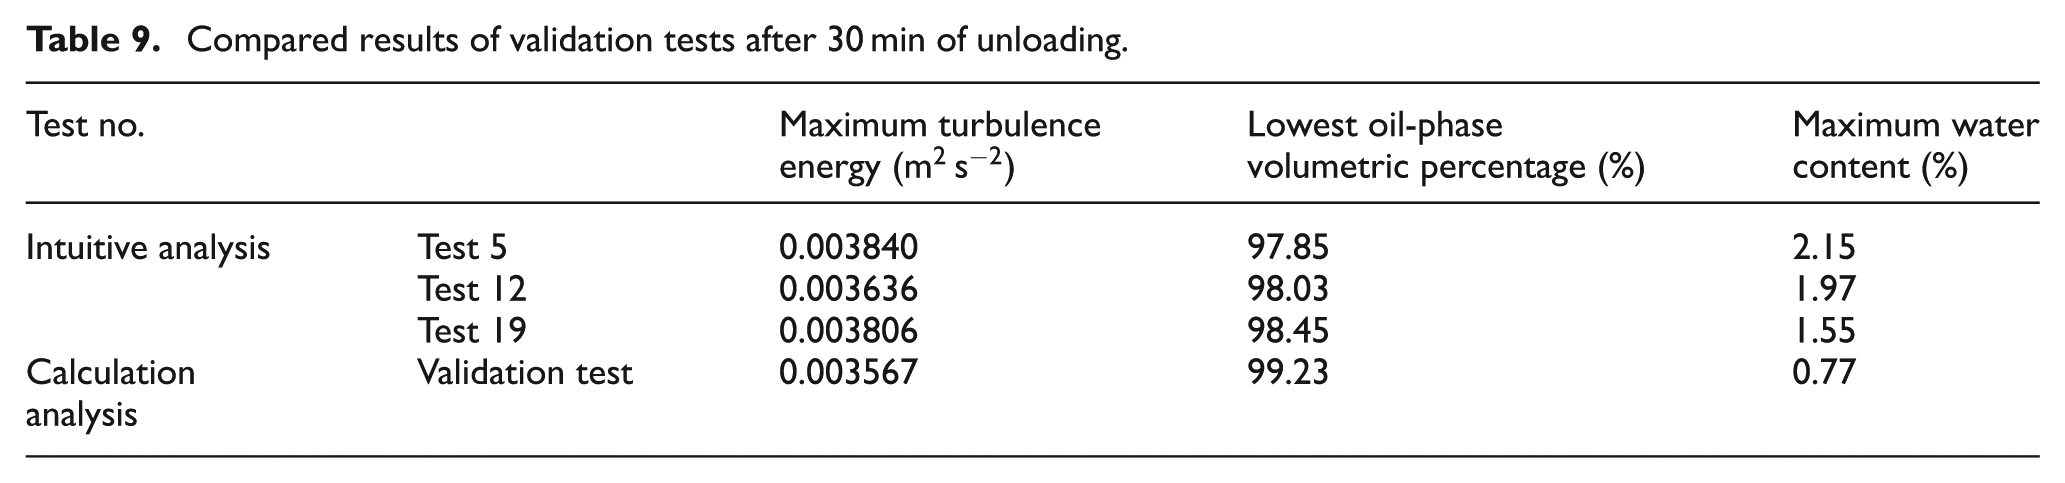
The results of 25 groups of orthogonal simulation tests after unloading for 30 min are listed in Appendix 1. Among the 25 groups, the maximum turbulence energy of Group 12 was the lowest at 0.003636 m2 s−2. Group 12 also demonstrated the lowest oil-phase volume percentage of 98.03%, indicating a maximum water content of 1.97%, which corresponds to good quality of the pumped oil. The maximum turbulence energies of Groups 5 and 19 were relatively low, equal to 0.003840 and 0.003806 m2 s−2, respectively. The maximum water contents of Groups 5 and 19 were also low at 2.15% and 1.55%, respectively.
Range analysis
The degree of influence of each factor on the maximum turbulence energy and the maximum water content can be characterized by range analysis. This study includes 6 factors, 5 levels, and 25 groups of data. The average values and ranges of each factor on each level are listed in Tables 3 and 4.
Range table of the maximum turbulence energy.

Range table of the maximum water content.

According to Tables 3 and 4, the degree of influence of each factor on the turbulence energy was observed in the following order: RE > RC > RF > RA > RB > RD. The degree of influence of each factor on water content was observed in the order RA > RF > RB >RD > RE > RC.
An average analysis of the turbulence energies is shown in Table 5. The optimal parameter combination is A1B1C5D4E5F1. The optimal parameter combination regarding water content is determined as A3B4C1D1E1F3, according to the results presented in Table 6.
Average analysis table of turbulence energy corresponding to factors on each level.

Average analysis table of water content corresponding to factors on each level.

The variation of each factor level has a significant influence on the turbulence energy and water content. The characterization of these influences is beneficial to future design processes. The influence of various levels of each factor on the turbulence energy and water content indices is further analyzed, and results are listed in Table 7.
Analytical results obtained by the comprehensive equilibrium method.
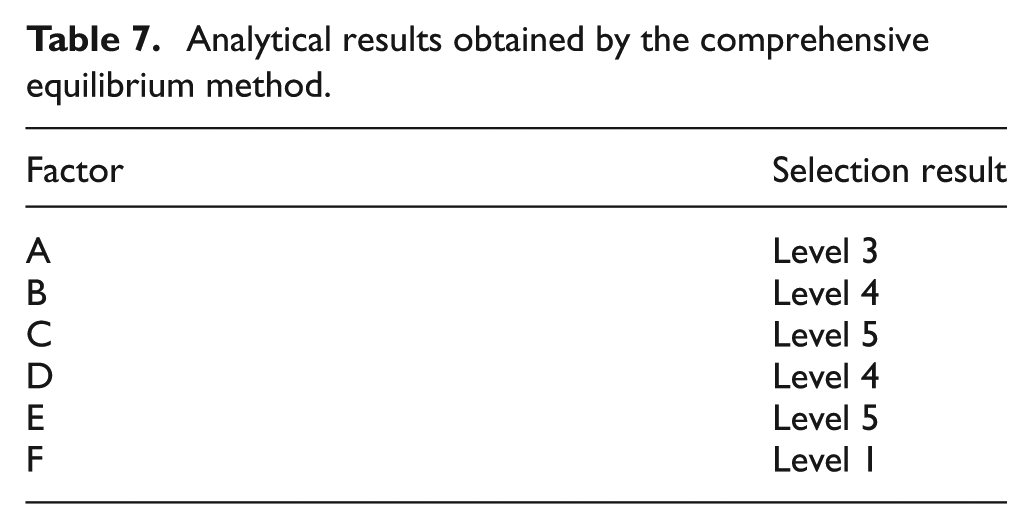
According to Table 15 in Appendix 1, the turbulence energy and oil content demonstrate similar variation tendencies as factor values change. As previously demonstrated, the optimal schemes corresponding to each index vary. Thus, a balance between them must be determined.15,16
Factor A (the distance between the horizontal inlet tube and tank bottom) is used as an example. When factor A is set to level 1 (0.1 m), its maximum turbulence energy is lower than the rest part. When factor A is set to level 3 (0.3 m), the maximum water content is the smallest. Thus, factor A is the secondary factor which affects the variation of turbulence energy, but the dominant factor affecting the water content. Here, the influence of factor A on the water content is primarily considered. Thus, factor A is set to level 3. Analytical results obtained by this method are listed in Table 7. Therefore, the optimal scheme is determined as follows: A3B4C5D4E5F1.
Optimal design of L-shaped multihole-buffering inlet tube
Validation test
According to the range analysis of multiple index tests, the optimal design scheme of the L-shaped multihole-buffering inlet tube is listed in Table 8.
Optimal scheme of design parameters based on range analysis.

According to the comparative analysis, the optimal design parameter model obtained by multiple index range analysis is not among the 25 groups investigated by orthogonal testing. Validations are required to analyze the possibility of additional optimal design parameters and investigate the reproducibility of the optimal design parameters. Comparisons to the relatively optimal design parameters are also required to determine the advantages and disadvantages of the optimal design parameters as indicated by multiple index range analysis.
Design parameter optimization
Numerical simulations are conducted on the L-shaped multihole-buffering inlet tube model presented in Tables 5–7 under similar simulation conditions. Comparison of simulation results will determine the optimal design parameters of the L-shaped multihole-buffering inlet tube. The analysis results are presented in Table 13, Figures 7 and 8.

Variation relation curve between the maximum turbulence energy and unloading time.

Variation relation curve between the maximum water content and unloading time.
As displayed in Figure 7, prior to 30 min of unloading, the turbulence energy values of all four tests decrease with time and indicate great in-tank fluid particle disturbance. After 30 min of unloading, the turbulence energy decreases with unloading time indicates a relatively flat trend, and a reduced degree of disturbance of in-tank fluid particles. As shown in Figure 8, the water content decreases as unloading time increases, while the oil-phase concentration continually increases.
The turbulence energy and water content of the test scheme obtained via range analysis are much lower than those of the other three studied groups (Table 9). Since the water content varies very little and deviation may occur in different simulations, the test scheme determined by range analysis is selected as the optimal design parameter scheme of the L-shaped multihole-buffering inlet tube.
Compared results of validation tests after 30 min of unloading.
Field test of the L-shaped multihole-buffering oil-feeding process
To characterize the effects of the newly built oil-feeding model as used in production sites, an L-shaped multihole-buffering inlet tube was manufactured according to the optimized model parameters and installed in a newly constructed horizontal underground oil tank for field testing. Simultaneous comparisons are made between the proposed process and traditional processes in the same gas station, in order to validate the feasibility and advantages of the new oil-feeding process on simultaneous unloading and refueling operations. 17
Test apparatus
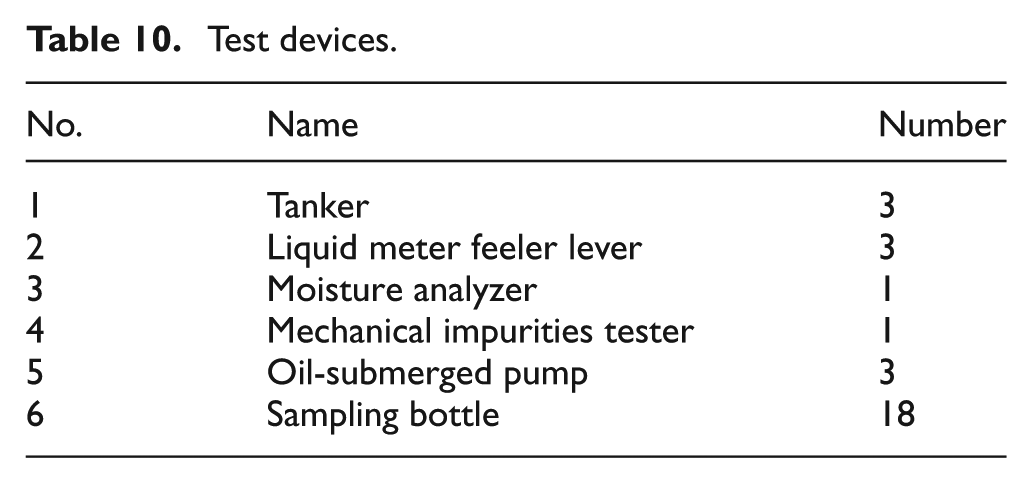
The test apparatus consists of a 30-m3 carbon steel horizontal underground oil tank, an L-shaped multihole-buffering inlet tube, and DN50 outlet tubes. The distance between the central axis of the horizontal section of the inlet tube and the tank bottom is 0.3 m, the distance between the outlet hole and the tank bottom is 0.2 m, and the tube-direct-to-bottom way is utilized in all outlet holes. Destaticization treatment is conducted on the entire apparatus by a ground connection. The sealed unloading process is employed. The schematic depicting the overall effect of the entire apparatus is displayed in Figures 9 and 10. The other devices used are listed in Table 10.

L-shaped multihole-buffering oil-feeding process test device.

Locally enlarged view of the horizontal outlet tube of the test device.
Test devices.
Test analysis was primarily conducted using the two devices and vessels described below and depicted in Figures 11 and 12.

TCS100A moisture analyzer.

DSY-415 mechanical impurity tester.
Test methods
Wearing anti-static workwear, anti-static gloves, and oil resistant gloves, warning lines were set and fire extinguishers and asbestos mats were placed nearby.
The test apparatus of the L-shaped multihole-buffering oil-feeding process was installed, the tank outlet tubes were connected to the tanker inlet tubes, the oil gun began refueling after oil unloading began, and oil samples were collected at liquid heights of 40, 45, 50, 55, 60, and 65 cm into six labeled bottles. The water and mechanical impurity contents were measured and recorded.
The oil pumped by tankers with traditional processes was also analyzed, to obtain conclusions via comparative analysis.
After the conclusion of testing, the power was turned down, and the test field was cleared.
Test result in analysis
To further verify the feasibility and advantages of the proposed oil-feeding process for the achievement of simultaneous operations, the quality of oil at different liquid heights pumped by tankers using all three feeding processes is recorded, as listed in Table 16 in Appendix 1.
Results demonstrate that the disturbance effects of oil unloading on water and impurities at the bottom of the tank are significantly reduced with the adoption of the L-shaped process, which is in agreement with the simulation results. Thus, the L-shaped feeding process can better achieve the simultaneous operation of unloading and refueling while ensuring the quality of pumped oil, as compared to traditional oil-feeding processes. Comparison of the data in Table 16 in Appendix 1 with the numerical simulation results indicates that the absolute error between the simulation results and test results is less than 2%, demonstrating that the numerical simulation method is precise.
Conclusion
This article discussed the feeding processes of gas stations and proposed the preliminary design scheme of an L-shaped multihole-buffering inlet tubes. In order to achieve simultaneous unloading and refueling operations, numerical simulation of the in-tank fluid fields was conducted, and the advantages and disadvantages offered by traditional feeding processes and the proposed L-shaped feeding process were compared. The degree of influence of each design parameter on the in-tank flow field was investigated and the optimal design scheme of the L-shaped multihole-buffering inlet tube was determined according to orthogonal testing to investigate the impact on turbulence energy and water content. Field test results validated the effectiveness of the numerical simulation method, which provides references for the design, application, and promotion of L-shaped multihole-buffering inlet tubes. The following conclusion can be drawn according to the above results:
The disturbances created by the I-shaped and J-shaped feeding processes on the water and impurities at the bottom of the tank are comparably strong, making it difficult to ensure the oil quality delivered by both feeding processes. The designed L-shaped multihole-buffering inlet tube reduced oil outflow velocity and ensured uniformity of oil leakage.
Numerical simulation of the in-tank flow field indicated that the flow performance of in-tank oil is improved with the utilization of the L-shaped feeding process as compared to traditional feeding processes, indicated by reduced outflow velocity and degree of fluid particle disturbance, in addition to improved quality of the pumped oil.
Based on orthogonal testing and the comprehensive equilibrium method, the optimal design parameter scheme of the L-shaped multihole-buffering inlet tube was determined. The optimal design parameters include a distance from the horizontal section of the inlet tube to the tank bottom equal to 0.3 m, a tube diameter of DN87, hole size of 60 mm, hole number equal to 9, and hole intervals of 30 cm with upward hole orientation.
After parameter optimization, the turbulence energy around the outlet tube entrance decreased from 0.004572 to 0.003154 m2 s−2, while the oil concentration of the pumped oil increased from 95.19% to 99.23%.
Field tests were conducted on the parameter optimized L-shaped multihole-buffering inlet tube. The optimized process has more advantages compared to traditional oil-feeding processes, as it can achieve simultaneous unloading and refueling operations. The variation regularity of the water and mechanical impurity content with liquid height in oil pumped by tankers is in agreement with the simulation result. Thus, the accuracy and reliability of the numerical simulation method are validated.
Footnotes
Appendix 1
Field test results.

| Liquid height | Sample | Visual sample forms | Instrument measurement |
Simulated water content (%) | |
|---|---|---|---|---|---|
| Contents of water and mechanical impurities | Water content (%) | Mechanical impurities (%) | |||
| 40 cm | 1 | Slightly cloudy with some water and impurities | 0.082 | 0.012 | 1.630 |
| 2 | Cloudy with a lot of water and impurities | 0.103 | 0.033 | ||
| 3 | Cloudy with a lot of water and impurities | 0.098 | 0.025 | ||
| 45 cm | 1 | Relatively apparent with some suspended water and impurities | 0.065 | 0.008 | 0.995 |
| 2 | Cloudy with a lot of water and impurities | 0.086 | 0.025 | ||
| 3 | Slight cloudy with a lot of water and impurities | 0.072 | 0.017 | ||
| 50 cm | 1 | Relatively apparent with little sedimentary water and impurities | 0.038 | 0.007 | 0.772 |
| 2 | Slight cloudy with some water and impurities | 0.064 | 0.016 | ||
| 3 | Relatively apparent with some suspended water and impurities | 0.046 | 0.009 | ||
| 55 cm | 1 | Apparent without suspended or sedimentary water and impurities | 0.032 | 0.005 | 0.721 |
| 2 | Relatively apparent with some suspended water and impurities | 0.047 | 0.013 | ||
| 3 | Relatively apparent with little sedimentary water and impurities | 0.035 | 0.008 | ||
| 60 cm | 1 | Apparent without suspended or sedimentary water and impurities | 0.030 | 0.005 | 0.615 |
| 2 | Relatively apparent with little sedimentary water and impurities | 0.042 | 0.009 | ||
| 3 | Apparent without suspended or sedimentary water and impurities | 0.033 | 0.007 | ||
| 65 cm | 1 | Apparent without suspended or sedimentary water and impurities | 0.028 | 0.004 | 0.485 |
| 2 | Relatively apparent with little sedimentary water and impurities | 0.038 | 0.008 | ||
| 3 | Apparent without suspended or sedimentary water and impurities | 0.031 | 0.006 | ||
1.1–6% floating-type feeding process; 2-oil-process-type feeding process; 3-oil-process-type feeding process.
Academic Editor: Roslinda Nazar
Declaration of conflicting interests
The author(s) declared no potential conflicts of interest with respect to the research, authorship, and/or publication of this article.
Funding
The author(s) disclosed receipt of the following financial support for the research, authorship, and/or publication of this article: This research is supported by the projects as follows: (1) Research on the Development Strategy of “Oil and Gas Pipeline Network System” (2015-XZ-37) supported by Chinese Academy of Engineering, Beijing, 100088, China; (2) Research on “Combustion Regularity and Monitoring Technology of Natural Gas Terminal” (2015JY0099) supported by Oil and Gas Fire Protection Key Laboratory of Sichuan Province, Chengdu 611731, Sichuan, China; (3) Research on the 13th Five-Year national key special of “Inspection and Evaluation and Safety Assurance Technology of Oil and Gas Pipelines and Storage andTransportation Facilities” (2016YFC0802100); and (4) National Key R&D Program of China.