
Abstract
The difficulty of accurately measuring crack closure regions has hindered measurements of opening or closure stresses, and ultrasonic methods have shown great potentialities in evaluating closure area. Many recent researches have confirmed the advantages of nonclassical nonlinear acoustic approaches in detecting short cracks and even micro- or meso-cracks. However, there are few reports on using nonclassical nonlinear acoustic approaches to measure crack closure. The aim of this article is to verify the applicability of vibro-acoustic modulation approach in estimating opening stresses of fatigue cracks. A procedure of approximating the opening stress by the applied tensile load of the inflection point of the modulation intensity curve is proposed. To study the performance of this measuring method experimentally, in situ vibro-acoustic modulation tests were carried out on a central cracked 5052-H32 aluminum alloy fatigue sample. The experimental estimations match well with other researches. Analysis of the experimental results suggests that the vibro-acoustic modulation technology is not only capable of measuring the fatigue cracks opening stresses, but also capable of analyzing the crack closure behavior, even for physically short cracks.
Keywords
Introduction
Fatigue crack closure has been recognized as one of the most influential operating mechanisms during fatigue for a long time. In the early 1970s, Elber
1
discovered that when a closed crack is loading, the crack surfaces will remain partly closed until all the compressive stresses were overcome under the corresponding crack opening stress
Three widely accepted crack closure mechanisms are plasticity-induced crack closure (PICC), roughness-induced crack closure (RICC), and oxide-induced crack closure (OICC). 2 All the mechanisms are operative and interacting. However, for Paris regime fatigue crack growth of most engineering materials, PICC is the dominant closure mechanism and PICC models successfully predict closure loads and crack growth rates. 3 The well-known reason for the PICC in thin solids (the plane stress condition) is the plastic wedge in the wake of the crack front. This wedge is created by tensile necking within the crack tip plastic zone.
Extensive experiments4,5 and numerical simulations6,7 as well as analytical approaches 8 have been developed to estimate PICC stresses. Among experimental approaches, compliance technique 5 has been most widely used for crack closure measurement, due mainly to its accuracy and experimental simplicity. However, this measuring method is usually limited to measurements when strain gauges are located near the wake of the crack or crack tip. In other words, the probable location of the fatigue crack in the host structure must be known before testing. Therefore, the compliance technique is unsuitable for in situ measurement. Acoustic methods generally measure “global” effects, and therefore require less priori knowledge of defects as compared with mechanical techniques (e.g. compliance technique). This feature makes the acoustic detecting approaches suitable for in-service monitoring systems, such as prognostics and health management (PHM) and health and usage monitoring system (HUMS).
The difficulty of accurately measuring closure regions has hindered measurements of opening or closure stresses, and acoustic methods have shown great potentialities in evaluating closure area. Some linear9–11 and classical nonlinear
12
acoustic approaches have been used to measure crack closure. Many recent researches have confirmed that the so-called nonclassical nonlinear phenomena, for example, vibro-acoustic modulation (VAM), show a higher sensitivity to a closed crack as compared to linear and classical nonlinear acoustics, especially when the crack is relatively small.13,14 VAM technology is a convenient and effective nondestructive detecting approach.
13
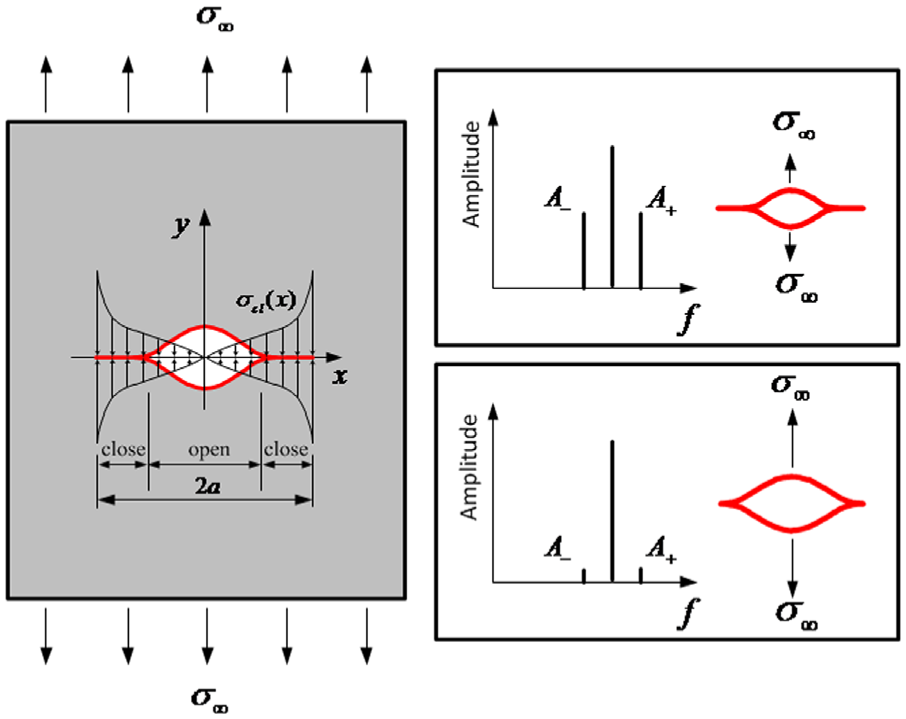
As shown in Figure 1, VAM test employs a low-frequency vibration

Schematic layout demonstrating the principle of VAM used for damage detection.
VAM technology has been widely studied for nondestructive evaluation applications. Despite many efforts have been exerted, there is still very little understanding of the physical mechanisms associated with this nonlinear phenomenon. Various theories have been proposed to explain the nonlinearity resulting from crack-wave interactions. These include the nonlinear stiffness spring (NSS) mechanism,15,16 the dissipative mechanism of elastic hysteresis,17,18 and the contact acoustic nonlinearity (CAN) mechanism.19,20 The damage severity characterization methods in VAM technology are varied and depend on the kind of explanation mechanism used. In 2001, Donskoy et al. 16 mathematically proved the proportional relation between the crack size and the amplitude ratio of sideband components to fundamental frequency ones, based on the NSS model. This amplitude ratio was called modulation index in their paper, and the effectiveness of which was also confirmed by impact-modulation (a type of VAM test methods) experiments. Since then, the effectiveness and practicability of the modulation index have been further confirmed by many investigations extending from crack sizing21,22 to impact damage detection 23 as well as fatigue life estimation, 24 and from metallic materials22,25 to composite materials.23,26 In this article, the NSS analysis model and modulation index mentioned above would be employed to evaluate the contact area of cracks.
Compared with linear and classical nonlinear acoustic approaches, the potential advantages of VAM technology are as follows. First, as nonlinear products, the VAM sidebands
It should be pointed out that there are few reports on evaluating crack closure using VAM technology. This article aims to study the applicability of VAM approach in estimating opening stresses of fatigue cracks. A procedure of approximating the opening stress by the applied tensile load of the inflection point of the modulation intensity (MI) curve is proposed. This procedure is based on the fact that once the crack is fully open under a specifically applied force which is equal to or exceeds the crack opening stress, the nonlinear modulation phenomenon will be very weak. Then, the crack opening stresses can be approximated by the current applying load when the nonlinear MI decreases to a value close to zero. To study the performance of this measuring method experimentally, in situ VAM tests were carried out on a central cracked 5052-H32 aluminum alloy fatigue sample. The validity of the estimating results and analysis of the closure behavior of a physically short crack were also discussed.
Methodology
NSS model and MI of VAM
The analysis model of VAM phenomenon, which was developed from the rough-surfaces contact theory,
27
was first proposed in Rudenko and Vu.
15
According to this model, the applied stress changes the effective contact area between the two surfaces due to deformation of asperities in contact, resulting in a nonlinear elasticity of the interface. For longitudinal stress applied normally to the interface, the wave-induced stress
It is noteworthy that this type of nonlinearity should be clearly distinguished from the CAN that is related to the “opening–closing” motion of the crack faces. In the simplest form of CAN, such a “bi-modular” can be simulated by a piece-wise stress–strain relation. 28 The most important difference between the two explanation mechanism may be that the CAN model assumes the incident wave is powerful enough to open or close the crack faces (crack mode I). However, since the nonlinearity explained by the NSS mechanism is caused by the elastoplastic deformation of the asperities on the crack faces, NSS model has a much lower requirement on the wave energy. This exciting feature has been experimentally verified by Sohn et al. 29 In addition, the potential application range of NSS model may be expanded to crack mode II and/or mode III, if a tangential stiffness is introduced in the modeling processes.
Based on NSS model, Donskoy et al.
16
obtained the amplitudes of the modulation sidebands

where

Assuming the item

where
Procedure of approximating opening stress considering PICC
Consider a linear central through fatigue crack with length
Relationship between modulation intensity and crack closing area.
From the discussion above, the general varying trend of MI versus applied load can be forecasted qualitatively as shown in Figure 3. The opening stress can be approximated by the applied load of the inflection point of the varying curve. Therefore, as an example, the opening stress estimation
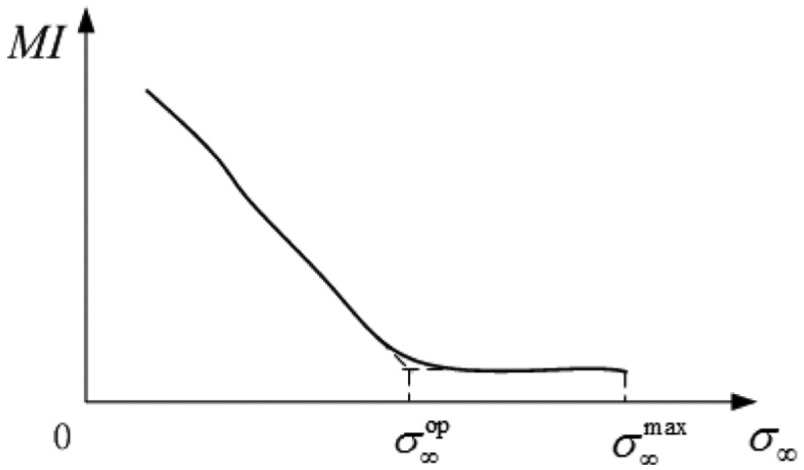
An example of opening stress estimation.
Experiments
Specimen and fatigue test
The fatigue sample was a
A constant-amplitude uniform-tension cyclic fatigue load was applied to the specimen by a MTS 810 material testing system. The frequency of the fatigue load was 10 Hz; maximum stress
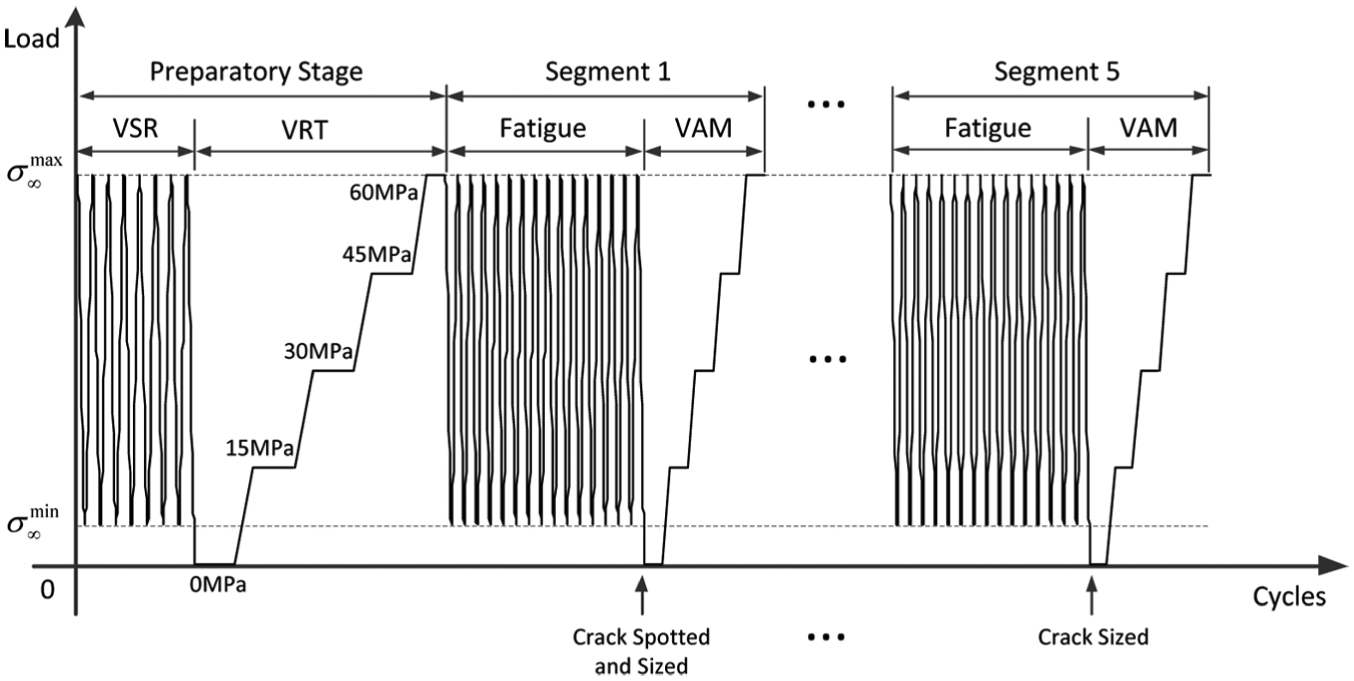
Fatigue loading and quasi-static testing sequence for opening stress estimation.
The 6000 cycles (10 min for the corresponding time duration) vibratory stress relief (VSR) 31 fatigue load in the preparatory stage was employed to relief the residual stress induced by the machining process and to initialize the entire testing system. Vibration response tests (VRT), which will be discussed in subsection “Pumping frequency selection,” were carried out in Part II of the preparatory stage, aiming to select out the reasonable pumping frequency for the following VAM tests. At the end of all the five fatigue processes, the produced fatigue cracks were sized by a digital camera through a 15× magnifying lens. VAM tests were then performed in each quasi-static step to estimate the opening stresses of the five sized cracks. The results of crack propagation are shown in Table 1.
Fatigue crack propagation results.

VSR: vibratory stress relief.
Experimental set-up
Figure 5 illustrates the schematic representation of the ultrasonic testing setup. Testing equipment consisted of four low-profile piezoelectric transducers (PZTs), a low frequency power amplifier (PI E-505 LVPZT piezo-amplifier), a band-pass (500 Hz–1 MHz) signal filter amplifier, an oscilloscope (Tektronix MSO 2014B), a signal generator (Tektronix AFG3022B), and a computer controller. All the PZTs were cemented on the right part of the plate using the X60 fast-curing two-component adhesive glue. PZT actuator VA was employed to vibrate the plate at different resonance frequency selected according to the VRT processes; sensor S2, which was located closely to the expected crack, was used to measure the vibration response; UE was used as an ultrasonic probing signal exciter; and ultrasonic sensor S1 was used to gather the VAM response signal. All the PZTs except VA (PI PL055.31, 5 mm × 5 mm × 2 mm) were PIC155 transducers (diameter 10 mm, thickness 0.5 mm). Figure 6 shows the pictorial view of the experimental setup.
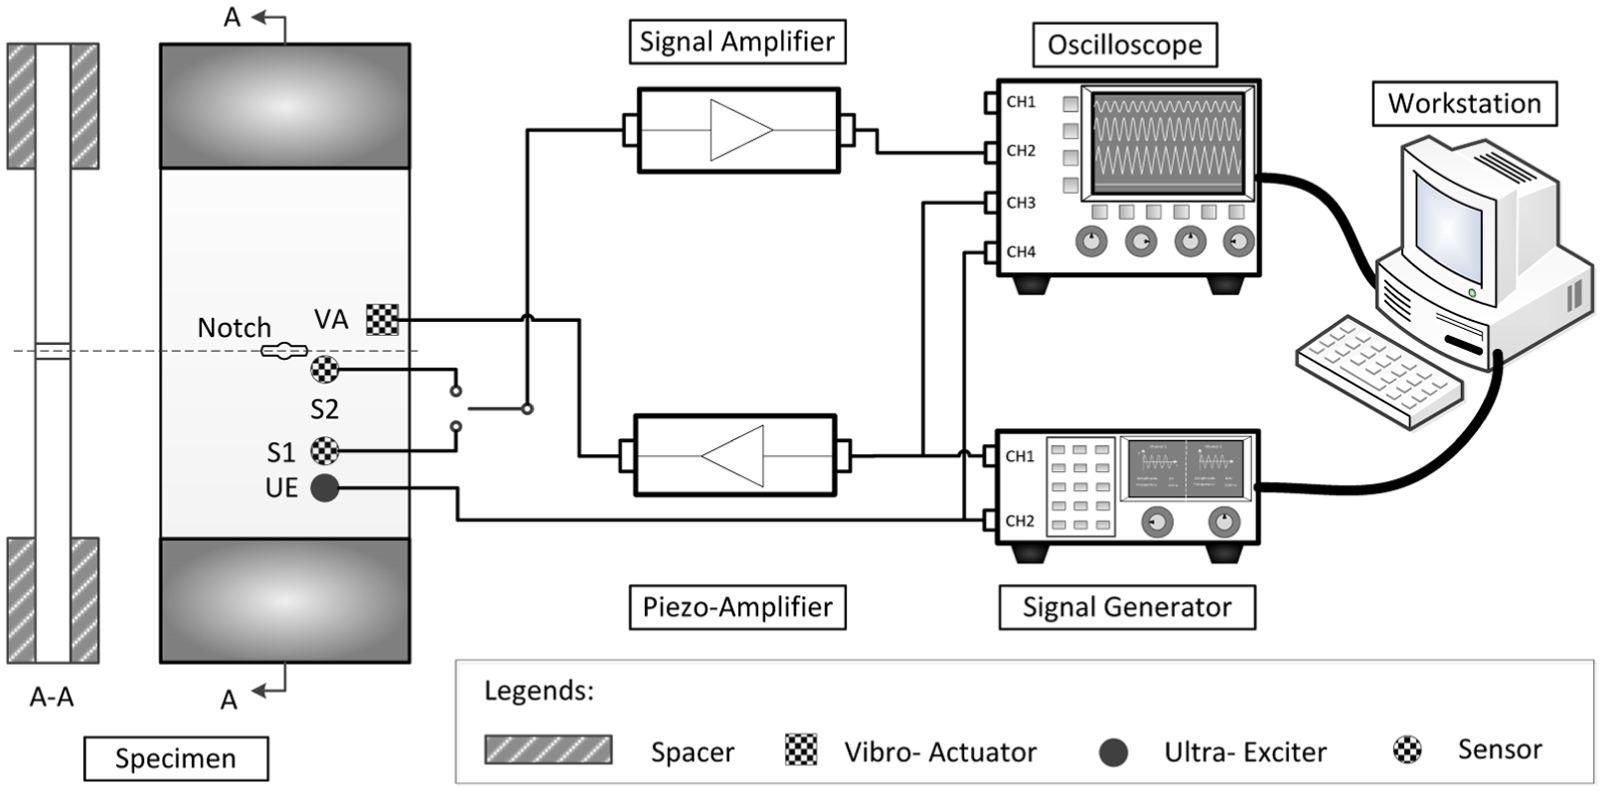
A schematic representation of the experimental setup.

Pictorial view of the experimental setup.
Pumping frequency selection
It is well known that, when applying VAM tests to a structure, the structure resonance frequency shifting caused by external load, damage propagation, and so on, may change the MI significantly. Therefore, the VRT processes were carried out in the preparatory stage mentioned in subsection “Specimen and fatigue test.” The VRT processes were performed to select out the reasonable pumping frequency to match the structure resonance frequency which is shifting during quasi-static loading. As shown in Figure 4, VR tests were not performed after the crack spotted because the results of previous preparatory experiments suggested that the resonance frequency shifting caused by crack growth is quite little. This experimental simplification is reasonable when considering that the maximum crack length (e.g. 4.33 mm in half-length) is significantly smaller than the specimen width (e.g. 50 mm in half-width).
During each VRT, a 20

where
As an example, response signals and frequency response functions of the sample under the applied load of 0 and 60 MPa are given in Figure 7. It is clearly shown in Figure 7 that, some resonant modes disappeared and the resonance frequency ascended 20 Hz when the structure was loaded to 60 MPa. On the other hand, the response function curve presents as a series of sharp peaks at different resonance frequency, so the vibration behavior of the structure and also the crack changes a lot, if the pumping frequency mismatch the current resonance frequency. The mode with maximum mode amplitude was selected as the expected pumping frequency. Table 2 shows the pumping frequency selecting results at each quasi-static load.

Vibration response testing results: (a) response signal and (b) frequency response function at 0 MPa; (c) response signal and (d) frequency response function at 60 MPa.
Selected pumping signal frequency at different applied load.

It should be explained that the reasons why the pumping frequency was chosen by finding the maximum of frequency response function rather than by modal shape analyzing which was employed in other researches23,32 generally aiming to detecting or sizing cracks in freely suspended structures, were as follows. First, as described in the second paragraph of subsection “NSS model and MI of VAM,” according to the RSS modeling theory, the nonlinearity of a rough interface seems relatively less sensitive to the energy of pumping excitation as well as the mode of the crack motion controlled by the modal shape of structure. Lastly and most importantly, the selected resonant mode (refer to Table 2) is relatively stable in all the quasi-static loading steps, while other modes change a lot in modal amplitude or even disappear (refer to Figure 7). This characteristic of the chosen resonant mode ensures the crack stress conditions as consistent as possible during following VAM tests.
VAM tests
VAM experiments were executed during each step of Part II in all the five fatigue segments. All the pumping and probing signals were sinusoidal and with a constant amplitude of 20 V peak-to-peak level. During each testing, the frequency of vibration (i.e. pumping signal) excited by the transducer UE was selected according to Table 2, and the probing signal frequency was set to 50 kHz. The nonlinear responses gathered by S1 was filtered and amplified and then fast Fourier transform (FFT) analyzed for crack opening stress estimation.
Results and discussion
Sensitivity of MI to crack contact condition
Figure 8 shows the FFT spectrum of received modulation response when the half-crack length was 4.33 mm. It is clear that the amplitudes of modulation sidebands caused by a closed crack are significantly larger than an open crack. From Figure 8 and equation (3), it can be figured out that when the applied load was 0 MPa, the MI is over six times higher than the intensity when the applied force was 60 MPa. The sensitivity of MI to crack closure confirmed the feasibility of estimating crack opening stress using VAM testing.
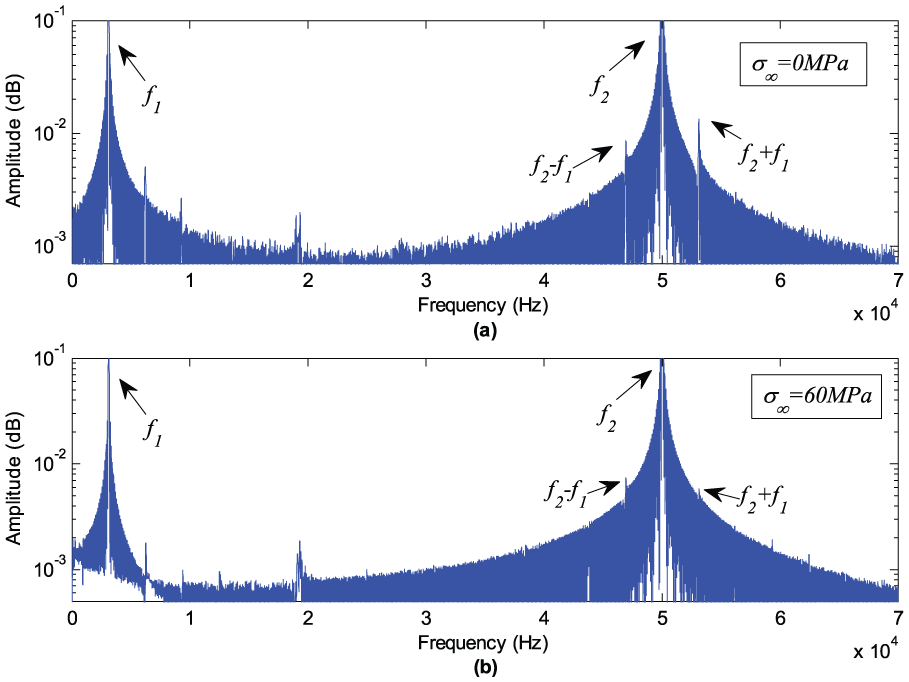
The spectrum of nonlinear modulation caused by a crack with half-length 4.33 mm under a tensile load of (a) 0 MPa and (b) 60 MPa.
Crack opening stress estimation
Once the FFT analysis was conducted, MI was calculated through equation (3). Then, the crack opening stress was estimated according to the procedure mentioned in subsection “Procedure of approximating opening stress considering PICC.”Figure 9 shows the normalized MI versus applied tensile load when the half-crack length varies from 2.55 to 4.33 mm. The closure behavior of the physically short (e.g. 1.2 mm the half-length) crack produced in segment 1 is far different from the behaviors of those relatively long cracks. Therefore, in order to study the short crack closure separately, the MI calculation results of the short crack are depicted in Figure 10 in the next subsection.

Normalized modulation intensity against applied load of long cracks with different length: (a) c = 2.55 mm, (b) c = 3.22 mm, (c) c = 3.78 mm, and (d) c = 4.33 mm.

Normalized modulation intensity against applied stress of a physically short crack.
Three primary results suggested by Figure 9 can be summarized as follows:
It is a general trend that the MI decreases with rising applied tensile load, and then plateaus to a level close to zero.
The opening stress estimations of the relatively long cracks are in the range of 30–45 MPa, according to the estimating procedure discussed in subsection “Procedure of approximating opening stress considering PICC.”
All the opening stress estimations are in the same range. That is to say, the crack opening stress is relatively stable during the crack propagation.
The first result is in consistence with the theoretical analysis discussed in subsection “Procedure of approximating opening stress considering PICC.” The second one matches well with the studies of Tong and Wu. 33 In their study, a modified crack opening stress equation is obtained for the center-crack tension infinite plate, by taking the crack tip element into account in a numerical analysis. The equation is as follows

where

where
Behavior of the physically short crack closure
The MI calculation results of the crack with half-length 1.2 mm are shown in Figure 10. In comparison with Figure 9, Figure 10 illustrates the far difference of closure behavior between the physically short crack and the relatively long cracks.
Figure 10 shows that there is an apparent increase in MI before the applied stress reaches 30 MPa. When the applied stress is larger than 30 MPa, the MI gradually decreases with increasing applied load. However, the inflection point does not appear up till the crack is loaded to the maximum fatigue stress
When the crack is just initiated at the root of the initial notch, the tiny crack surfaces will carry a huge closure stress, that is, the residual stress caused by stress concentration, which can represent nearly 40% of the yield stress.
36
This powerful compressive stress significantly increases the stiffness of the small crack and may keep it partly closing, even if the applied stress reaches
When the applied tensile load is removed, the crack will show the maximum stiffness. As a result, the pumping and probing waves may not be able to deform the micro-contact asperities on the crack faces. Then, the crack nonlinearity and also the MI will be very weak. As the crack is loading, MI will increase until the applied load is powerful enough to overcome the huge compressive stress, then the surfaces begin to open. After that, if the applied load is continuing to rise, the MI will turn to a decreasing function of applied load. The mathematical proof of the increasing relationship between the MI and the applied tension for a contact interface under an internal compressive stress is given in Appendix 1.
From the discussion above, it can be deduced from Figure 10 that the physically short crack began to partly open at about 30 MPa. In addition, the conservative opening stress estimation of the crack is in the range of 45–60 MPa. That is to say, the opening stress estimation of the physically short crack is higher than that of those relatively long cracks.
Conclusion
This article presents a method to measure central through fatigue crack opening stresses using nonlinear VAM testing. This method takes the advantage of the sensitivity of the vibro-acoustic MI to the crack contact area change. The crack opening stress is approximated by the current applying load when the nonlinear MI decreases to a value close to zero.
The in situ VAM tests on a 5052-H32 aluminum alloy plate under constant-amplitude uniform-tension fatigue load are carried out to experimentally verify the capability of VAM in opening stress measurement. The FFT analysis results show that when a crack is fully close, the MI is significantly higher than that of a fully open crack. Those results also confirm the sensitivity of MI to crack contact condition. The opening stress estimating results of cracks with half-length of 2.55–4.33 mm are all in the range of 30–45 MPa, and such results agree well with other approaches. The MI calculation results of a crack with half-length 1.2 mm indicate that the physically short crack begins to partly open at 30 MPa. In addition, the associated opening stress estimation is in the range of 45–60 MPa, which is higher than that of the relatively long cracks.
All the experimental results suggest that the VAM technology is not only capable of measuring the fatigue crack opening stresses, but also capable of analyzing the crack closure behavior, even for physically short cracks.
Footnotes
Appendix 1
Acknowledgements
The authors thank Dr Zhiwen Xian and Dr Yong Xiao for proofreading the manuscript. This work has been done in collaboration with all authors. Jun Jia contributed significantly to the designing, the performing as well as the result analysis of the experiments, and contributed to the writing of the manuscript. Haifeng Hu and Limin Tao contributed significantly to the procedure and the design of the proposed method and helped revise the manuscript. Yongpan Hu helped to design the experiments and revise the manuscript.
Academic Editor: Michal Kuciej
Declaration of conflicting interests
The author(s) declared no potential conflicts of interest with respect to the research, authorship, and/or publication of this article.
Funding
The author(s) disclosed receipt of the following financial support for the research, authorship, and/or publication of this article: This work was supported by the National Natural Science Foundation of China No. 51305449.