
Abstract
Personal travel pattern is significant to transportation analysis and modeling, and the rapid development of in-depth application of location-based services makes it possible to obtain large-scale positioning data. So, it is crucial to develop proper algorithm to identify trips/trip-segments from individual positioning records. This article presents an automatic trips/trip-segment detection method based on instantaneous Global Positioning System records collected by smartphones. The method consists of a series of procedures including data cleaning and pre-processing, inferring and removing pseudo trip ends, as well as trip combination. The result of the model has been compared with the “ground truth” collected and verified by volunteers. Finally, 1954 trips from 125 volunteers were identified and the overall detection accuracy is between 97.5% and 98.7% with a 95% confidence level. Besides, purity was introduced to evaluate the performance of the proposed method. In addition, the integration of instantaneous speed over time shows an excellent performance in calculating the trip distance.
Introduction
Individual trip data are fundamentally essential for traffic analysis in transportation system planning. The methods for personal travel survey have been experienced the stages of conventional travel surveys like paper-and-pencil interviews (PAPI), computer-assisted telephone interviews (CATI), and computer-assisted self-interviews (CASI). However, some disadvantages, including the travel time overestimating, 1 trip underreporting, 2 surrogate reporting, and sometimes confusion of trip purpose, 3 may decrease the quality of the collected data and dispirit the respondents since they were required to complete the travel log at the end of the day or the entire survey period.4–6
With the rapid development and popularization of the Global Positioning System (GPS) and smart devices, it is widely recognized that GPS-based travel survey could effectively address some of the problems existing in traditional survey methods,7,8 which can provide the alleviation of respondent burden and in turn increase the quality of data.9,10 To this day, many researches have been conducted to collect travel data since the GPS recordings first introduced to trace the movement of car based on monitoring the engine. 11 Now, individual trip survey based on smartphones is introduced. Compared with handheld and wearable GPS loggers or other GPS module, survey based on smartphones could significantly reduce the involvement and enlarge the sample size. Takuya et al. 12 designed a smartphone-based travel survey to examine the participants’ attributes without offering incentives; ultimately, 97 participants were recruited by the use of randomly distributed mail-out invitation letters. Xiao et al. 13 launched a pilot study to get the individual GPS records to infer the trip ends; finally, 885 person–day track data from 155 respondents are recorded and the overall detection rate is 96.02% while the error rate still remains 4.74%. Safi et al. 14 proposed a project named Advanced Travel Logging Application for Smartphones II (ATLAS II) to detect single-mode trip-segments automatically. Their proposed method works independent of external databases and achieves an accuracy of 97% in detecting trips from records of daily tracks. Although many researches put forward the method to identify the trips/trip-segments, the estimation parameters of the result is either correct rate or error rate, which may be confusing to evaluate the results.
We propose a smartphone-based travel survey to collect personal trip records. A series of rules, including data cleaning and pre-processing, inferring trip ends and removing pseudo ones, as well as trip combination, were introduced to identify trips/trip-segments. For the result evaluation, we come up with the concept of purity to test the performance of the method. Nevertheless, employing the integration of speed over time attains a high accuracy in calculating the trip distance.
This article is structured as follows: section “Literature review” will summarize relevant rules used in existing researches to detect trips/trip-segments. In section “Methodology,” the proposed methodology will be introduced, which includes a brief introduction of data collection and trip detection method. In section “Results and discussions,” we will discuss the main findings and results—a novel evaluation approach will be used to discuss the effectiveness of the results. Finally, some conclusions and future research recommendations will be presented in section “Conclusion.”
Literature review
Although there is no doubt that GPS offers accurate travel data and the burden on the respondents is alleviated, the proper method for identifying trips is still challenging. The content of the raw GPS data may vary for different GPS devices. They generally include the information of participant ID, longitude, latitude, timestamp, altitude, NSAT (the number of satellite that a GPS device used to position), horizontal dilution of precision (HDOP), instantaneous speed, and heading.15–17 Even though some travel information like time and speed could be obtained from the raw GPS data, start and end of the trip, travel mode, or travel distance could not be derived straightly without further data processing algorithm or other related work. Assisted with the collected GPS data and map-visualization software, some researchers rely on visual checking to obtain the information about the trip attributes. Some researchers examine trips and stops based on the places which the participants most frequently visited. However, in the real world, the collected raw data contain noise for some reasons (e.g. cold/warm start, blocked by buildings, trees or in the tunnels, or caused by “urban canyon” effect).
The GPS data streams must be pre-processed before they can be used to infer travel information. Generally, there are two steps: “Data cleaning” and “Data smoothing.”18,19“Data cleaning” removes the inaccurate GPS for lack of in-view satellites. However, “Data smoothing” removes random errors due to the causation like signal blocking or receiver problems. More rules to pre-process the raw GPS data are listed in Table 1.
Summary of rules for data cleaning.
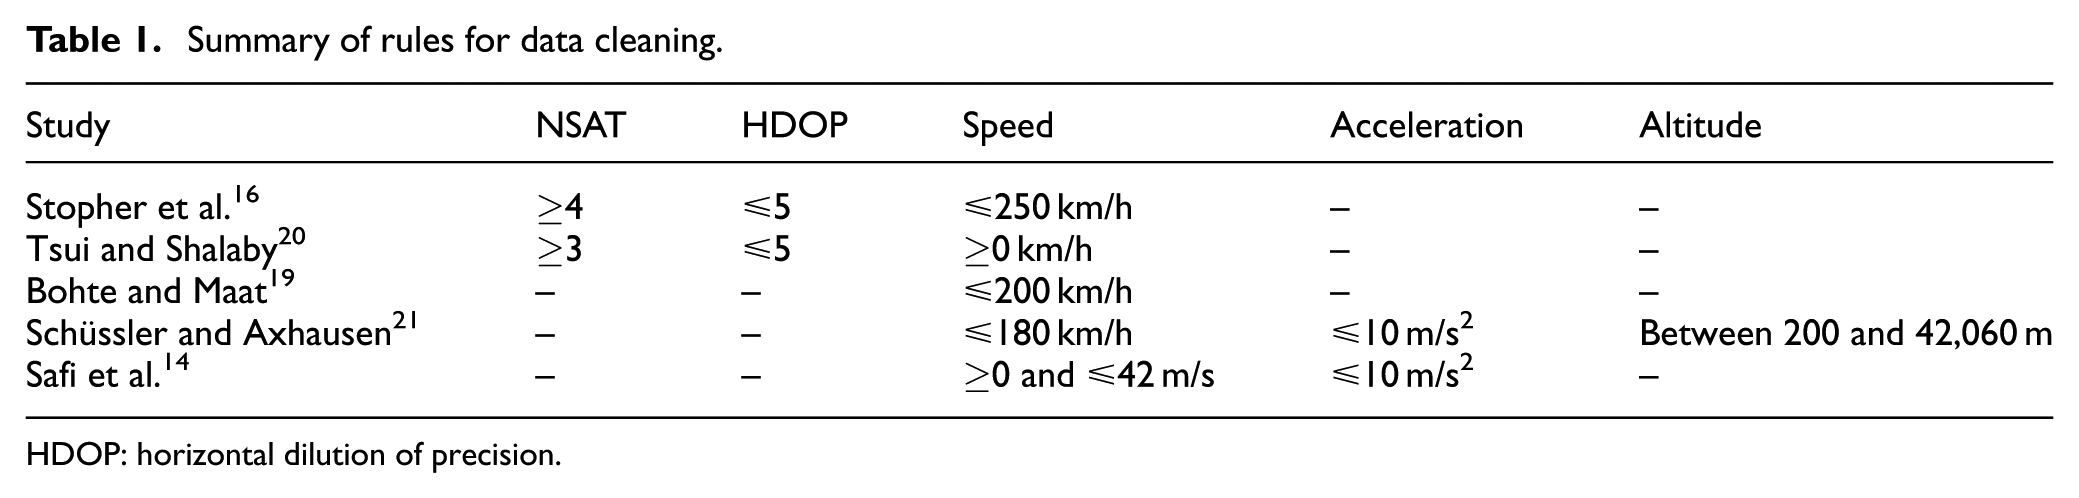
HDOP: horizontal dilution of precision.
Most of the existing studies indentify trips/trip-segments by inferring trip ends. Researchers use the dwell time with or without other parameters to detect trip ends. Table 2 summarizes the variables employed in inferring trip ends under two scenarios: GPS signal available and GPS signal lost.
Summary of trip end identification methods.

When the GPS signal is available, several rules are employed to infer trip ends. Among these, most frequently used is “dwell time,” in which it can be supposed that an activity occurs. Different values have been considered to be dwell time, ranging from 45 to 900 s, such as 45, 120, 180, 200, or even 900 s.17,19–21,24 In fact, these values mainly depend on the local transportation situation or characteristics of the studied areas. Some researchers take the instantaneous speed into consideration. They regard zero speed as the necessary condition.20,23 Besides, the change of heading and the density of the GPS points were also considered in some studies.5,16
In the situation of signal lost, the dwell time between two consecutive points was mostly used to detect the potential trip ends in some researches. Du and Aultman-Hall 5 used 20 points before and after the signal loss to calculate the average speed. He assumed that if the driver kept a comparably stable speed during and after signal loss, the time a vehicle should take to travel the distance during a signal loss is calculated by the average speed. Then, if the calculated time exceeded the real time by more than a threshold, a trip end is flagged.
All the studies discussed above employed either dwell time or speed to detect trips/trip-segments, and the most previous studies took a lot of workload and time to confirm the real trips from the map by visual check, 16 which might result in the limited number of the samples and restrict the large-scale promotion of smartphone-based travel survey. This article concentrates on designing the suitable rules to remove inaccurate GPS records and identify trips/trip-segments by comparing detected trips with actual ones. Finally, purity will be introduced to evaluate the detection accuracy.
Methodology
This section will introduce the data collection procedure and data process method.
Data collection
To collect the personal travel data, we developed a smartphone-based travel survey launched in Shanghai from mid-October 2013 to late-April 2015. A part of respondents are recruited by Internet, while others are invited by social networks of our group members. When the positioning application developed by our research group is installed and launched on the respondents’ smartphones, unique user ID will be assigned to every respondent and they were required to complete their socio-demographic attributes and household addresses online. During the survey, respondents are required to start the application prior to leaving home for the first time and upload GPS records before closing it after the last arrival home every day. After respondents have uploaded the GPS data streams to our server every day, travel information, including trip ends, travel modes, and trip purposes, can be derived and displayed on the map, and then, the respondents will be called by interviewers, our group members who major in the transportation engineering, to validate and correct the travel information. This intervention aims to help the respondents recalling more details of their trips, which can improve the accuracy of the actual travel information to a maximum extent.
Considering the high marketing penetration in China, we developed the application based on the platform of Android and iOS. As can be seen from Figure 1, the application could record time, longitude, latitude, altitude, bearing, and the number of satellite in view every second. Besides, uploading time is displayed to inform the respondents of when the data have been uploaded. The application will be closed when the smartphone keeps stationary for more than 5 min and restart when the smartphone moves again, which could effectively reduce the battery consumption, with no adverse effects on data recording. For the purpose of motivating the respondents as well as avoiding the battery drainage, we present each respondent with an external battery package. After the survey, each respondent will be presented with an extra mobile recharge card valued at about 50 RMB, which in turn attract more respondents to participate.

Two-user interface of positioning application.
Table 3 shows the results of the survey. A total of 265 potential volunteers participate in the survey. According to the quality of uploaded GPS records and the validation of verified travel logs, 125 volunteers uploaded valid travel data at last. Among them, 74 Android users uploaded 454 days’ data and 51 iPhone users uploaded 387 days’ data; thus, the average uploaded travel days are 6.14 and 7.59, respectively. This is approximate to our requirement that each participant should complete 1-week survey. A total of 2,793,492 points were uploaded to the server, and the average numbers of GPS points for 1 person-day are 3815 and 2707 for Android and iPhone users, respectively. As for trips, Android users uploaded 1112 trips and iPhone users uploaded 767 trips; a total of 1879 trips were reported. All these trips were verified by participants with the prompt recall from our interviewers and rectified trips will be served as “ground truth” to test the accuracy and reliability of the proposed trip detection model.
Survey and uploaded trips overview.

GPS: Global Positioning System.
Data process
This section consists of the data cleaning and pre-processing, inferring trip ends and removing pseudo ones, as well as trip combination.
Data cleaning and pre-processing
The raw GPS data were cleaned and pre-processed with four steps to remove inaccurate and incomplete track points. First, GPS points with less than four satellites in view are deleted. As has been discussed in the literature review part, four satellites are the minimum number of satellites to position accurately. Second, GPS points with the altitude of more than 200 m are also deleted since the average altitude of Shanghai City is about 4 m and the peak value is no more than 150 m. Third, GPS points away from the adjacent points due to the signal shift caused by blocking or “urban canyon” effect are also deleted. As is shown in Figure 2, GPS points away from both the before and after 5 points center for more than 200 m should be considered as shift points. Fourth, based on the studied areas, the maximum allowable speed in Shanghai city is 120 km/h; considering the overspeed in certain circumstances, the GPS points with instantaneous speed of more than 150 km/h are deleted. Table 4 is the original collected GPS data streams.

Deleting shift points.
Example GPS output from the smartphone application.

Identifying trip ends and removing pseudo ones
GPS signals may be lost caused by an indoor environment or blocking, which results in the loss of GPS records by the time intervals. So, we take different measures to identify trip ends under two situations.
Identifying trip ends with signal loss
The dwell time is most frequently used in the existing researches to infer trip ends with signal loss. If the time difference between two consecutive GPS points exceeds a certain threshold, we suppose that a potential trip end will occur. Based on the previous studies, 120 s is usually employed to represent the minimum time gap that an activity would reasonably take place. We select GPS records with time difference for more than 120 s as the potential trip ends. As has been mentioned before, signal loss generally occurs due to the signal blocking when volunteers are in the indoor buildings or underground. To remove the pseudo trip ends, we compare the average speed of the signal loss segment (equal to the distance traveled divided by time length of the signal loss period) with the lower bound of walking with 0.5 m/s. If the average speed of the signal loss segment is less than this value, then a real trip end is flagged, while if not, we consider it as the pseudo one and remove it.
Identifying trip ends during normal GPS recording
During the normal GPS recording, every point is recorded chronologically. Trip ends usually perform with the point clustering, where sequential GPS points close to each other are in an approximate circle area. To infer this type of trip ends, we adopt k-means clustering algorithm by calculating the maximum distance between any two points in the cluster. We define the diameter of 10 m of the circular cluster. If the maximum distance does not exceed this value, the whole cluster will be detected as a potential trip end. The first point in the cluster in the order of time is the starting of the trip end and the last point is the terminal of the trip end. In this situation, the dwell time also indicates the minimum duration that a real activity should occur. A proper dwell time should significantly distinguish real trip ends from pseudo ones such as waiting for the traffic signal or greeting the acquaintance during the trip. Based on the specific traffic situations in Shanghai, we assume that a vehicle should be less likely to remain absolutely stationary for a traffic signal or traffic congestion for more than 120 s. Therefore, we take the dwell time of 120 s to remove the pseudo trip ends. It is assumed that there does exist a trip end if the duration of the point clustering exceeds 120 s; otherwise, it is treated as the pseudo one and will be removed.
In addition, some short trip ends may take less than 2 min such as “picking up or dropping off somebody.” Most existing researches identify this type of trip end by examining the change in direction to determine whether there exists a trip end. However, only considering the change in direction may misidentify turning at the intersections as the trip ends. Actually, drivers usually take the same road links before and after picking up/dropping off somebody. Thus, we calculate the length of overlapped links before and after an abrupt change in direction. If the overlapped length exceeds the value of 50 m (considering the physical size of intersections in Shanghai), a trip end is flagged.
Trip combination
After identifying trip ends, a common sense that trips are segments separated by the detected trip ends. However, trips are mostly probable to be over-split since some trip ends may be detected twice or more. For instance, one trip end may be split into several parts when the respondent takes several stops in a scenic spot. Therefore, two rules are applied to rearrange trip ends and combine trips. First, points with the distance less than 50 m to a trip end center are merged into the trip end, which can avoid a single trip end being identified as multiple ones. Second, trips with the distance less than 400 m or the duration less than 5 min are merged according to the definition of a trip.
Instead of adding the linear distance of two consecutive GPS points straightly, we calculate the travel distance with the integration of instantaneous speed over time, which could precisely calculate the distance by taking the change of speed over time into account. As is shown in Figure 3, the area enclosed by the curve and the coordinate axis is the calculated distance.

Integration of instantaneous speed over time.
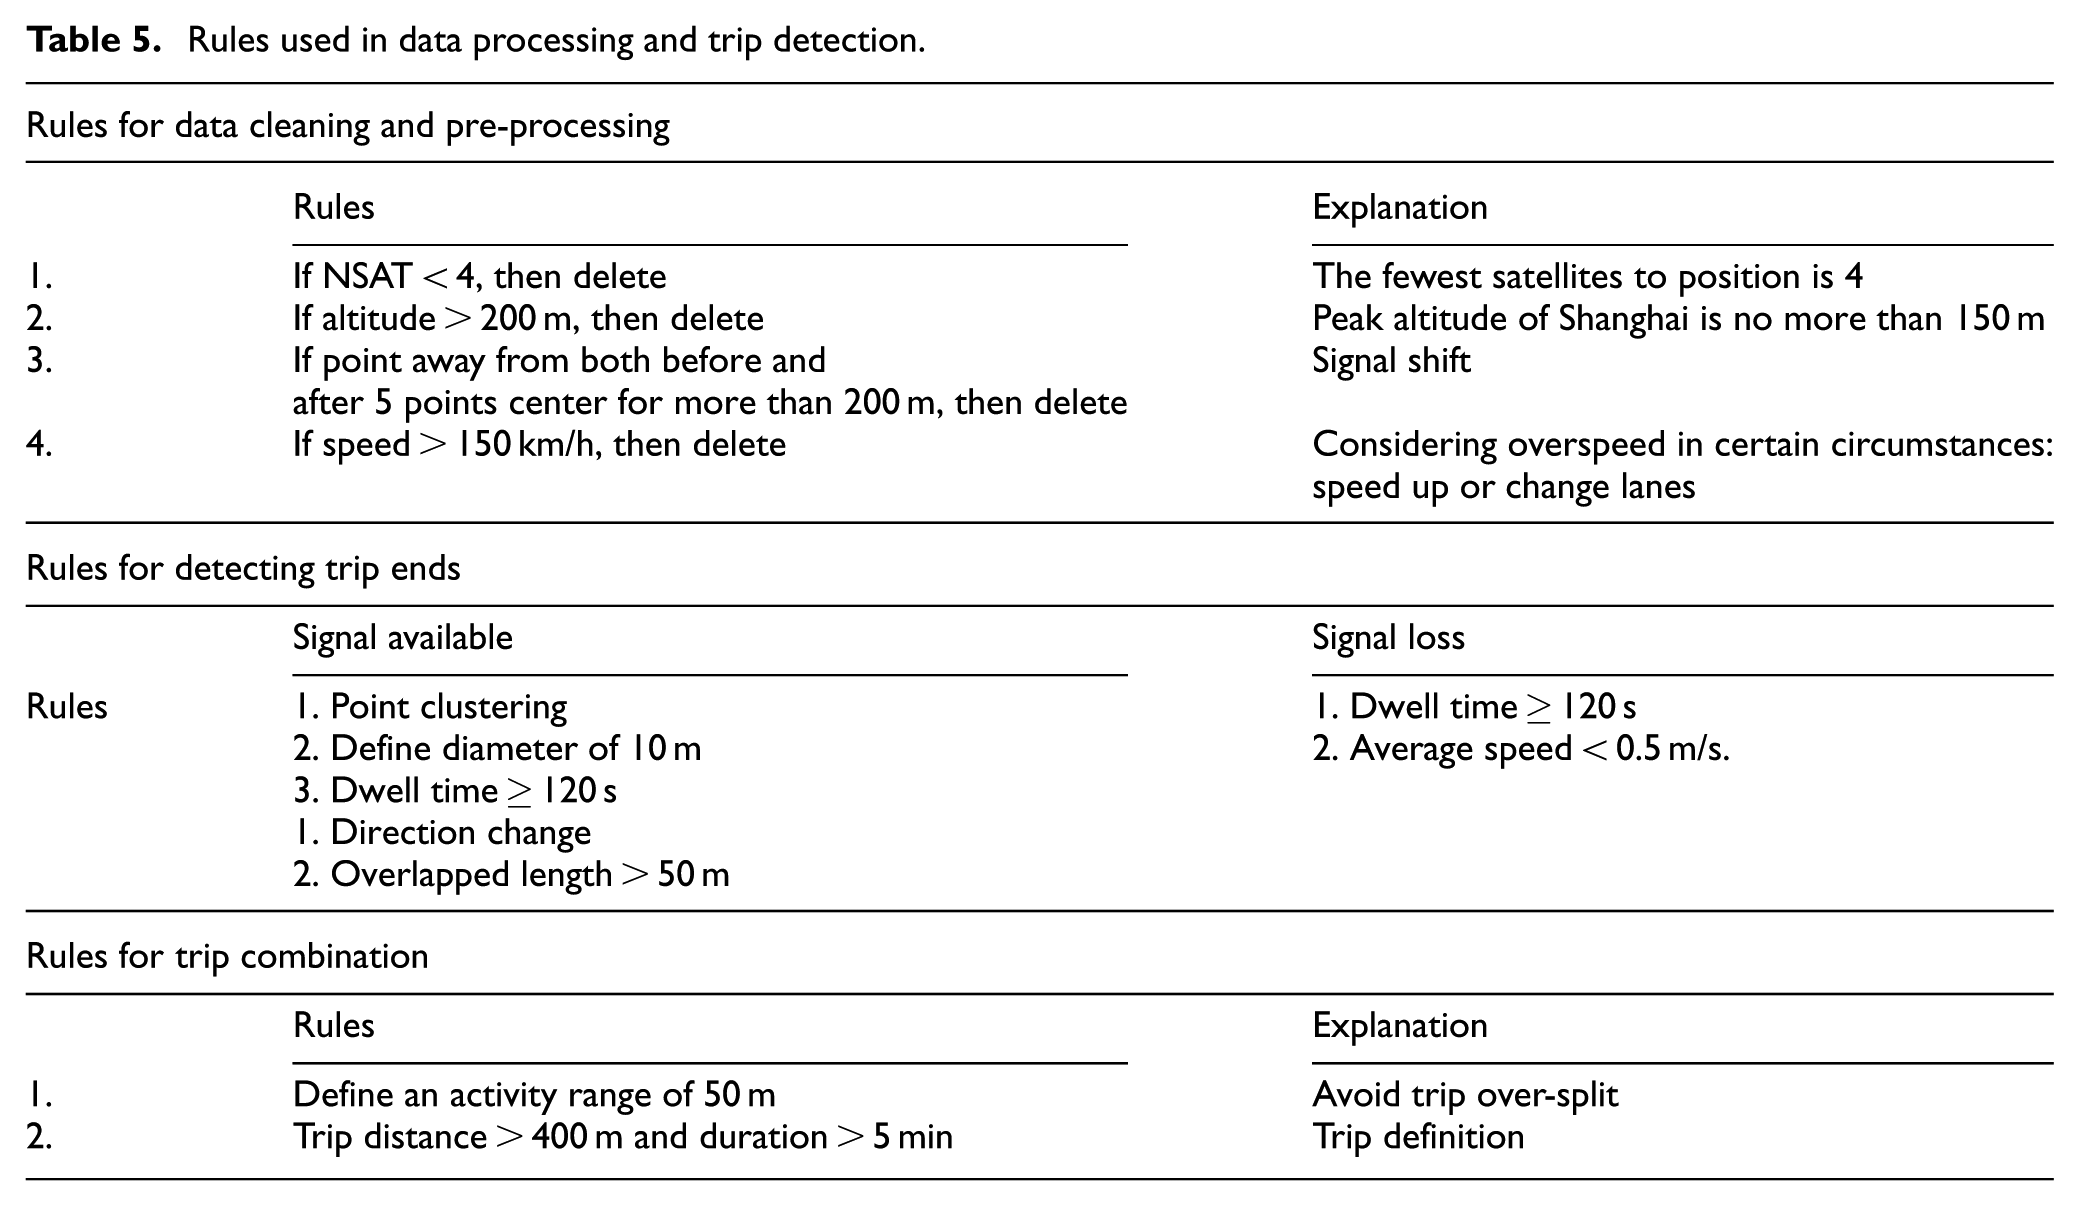
Summary of the rules used in data processing and trip detection is listed in Table 5. The proposed model is implemented in the MATLAB R2012a.
Rules used in data processing and trip detection.
Results and discussions
Table 6 shows an overview of the results of data cleaning and pre-processing. A total of 2,793,492 GPS points are recorded and uploaded to our server, and 206,992 track points (quite a small proportion compared with initial records, namely, 7.4%) were removed in the data cleaning and pre-processing step, which indicates that the quality of the uploaded data is fairly reliable. The difference of 2.9% between Android and iOS system may illustrate the better validity of iOS system in collecting GPS data compared with Android system to some extent.
Trips/trip-segment detection results.

As is shown in Table 6, 51 more trips were identified by the proposed model; we visualize these trips by importing the GPS records into ArcMap 10. The results show that these trips did occur while volunteers did not record in the “ground truth,” which indicates that the trip underreport does exist even with the prompt recall from the interviewers. Therefore, a total number of 1930 trips which consist of 51 more detected trips together with 1879 reported trips were considered as “ground truth.” The comparison of the detected trips with the “ground truth” shows the satisfying result of the proposed method. A total of 1954 trips were detected, only 1.24% more than the “ground truth.” Among them, 1893 trips were accurately detected, with the accuracy rate of 98.1%, while there are still 61 falsely detected trips that do not exist. In the stage of trip combination, only 89 trips were removed by the aforementioned two rules, which confirms that the value of threshold used in trip end detection could effectively distinguish a real trip from waiting for traffic signals or greeting the acquaintance; 50 m of the range of a trip end could avoid a single trip end being detected as several ones.
Table 6 shows the excellent performance of the proposed method in detection of the individual travel data. Results show that the average length of detected trips is 336 m (namely, 3.0%) less than that of reported trips, which attributes the success to employing the integration of instantaneous speed over time. Correspondingly, the difference in average duration between the detected trips and reported ones is only 88 s (namely, 4.3%).
Previous researchers applied either error rate or accuracy rate to evaluate the performance of the developed method.5,13 However, since the sample size or the comparison dimension is different, it is unconvincing to adopt these parameters to determine which method is better. Actually, accuracy rate obtained by sample estimation is a variable and there exists deviation to the real value. Traditionally, confidence interval is usually used to determine the region of the estimation. We assume that accuracy rate p is an actual value. The number of accurately detected trips X is subordinated to binomial distribution with the probability of p and the total real trips of N. When N is big enough that binomial distribution can be approximated with the normal distribution, 25 thus the interval of accuracy rate could be calculated by the confidence interval of normal distribution.
First, standardizing the accuracy which equals X divided by N. Namely

Second, selecting the confidence level of
To further judge the performance of the proposed method, purity is introduced to evaluate the reliability of method. Entropy (also called “weighed information”) is usually used to calculate the purity. 26 Specific definitions and calculations are exhibited as follows
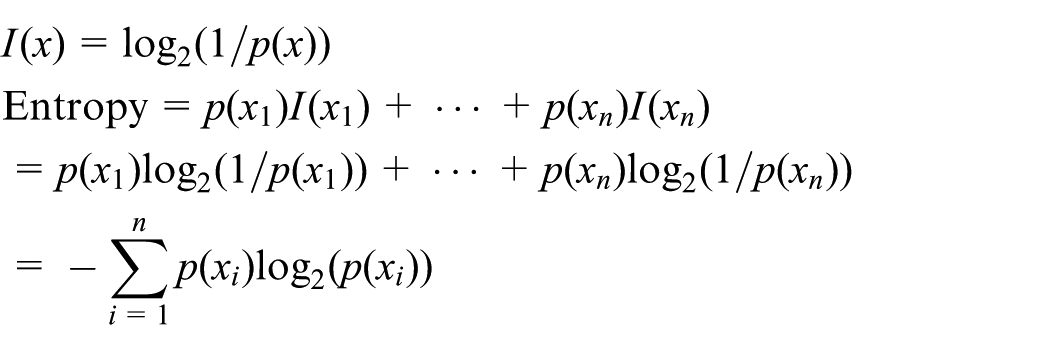
I(x) denotes the information content of incident X and p(x) denotes the occurrence probability of X; entropy reflects the randomness of a system: the smaller the entropy is, the more orderly a system is. Applying the entropy to evaluate the detection method, the smaller the entropy of a certain method is, a trip is more likely to be detected (accurately or falsely) by the proposed method.
We can calculate the purity of the proposed trip detection model by the above formula

So, the purity of the proposed method is 0.18, which is relatively small and reflects the successful performance of the proposed trip detection model. Table 7 shows a case study to understand the function of the purity intuitively. There is no doubt that the effectiveness of the following methods: method 1 > method 2 > method 4 and method 1 > method 3 > method 4. Compared with method 3, method 2 detects 100 more accurate trips with the cost of 100 more falsely detected trips. Thus, we cannot directly decide which method is better based on common sense. However, the purity of method 3 is smaller than that of 2, and we can assert that method 3 is better than method 2. Thus, method 1 > method 3 > method 2 > method 4.
Case study of trip detection comparison by purity.

Conclusion
This article introduces a methodology to detect trips for a large-scale travel survey based on smartphones. Travel information was rectified and confirmed by volunteers with the prompt recall from our interviewers. The result of the survey shows the successful performance in providing the alleviation of respondent burden and collecting valid individual travel data. Based on the previous literatures, a rule-based method with a series of procedures including data cleaning and pre-processing, inferring trip ends and removing pseudo ones, as well as trip combination was introduced. Only 7.4% GPS logs were removed from initial records, which confirms the satisfying validity of smartphone-based travel survey in GPS data collection. Considering the specific traffic situation in Shanghai metropolis, the dwell time of 120 s effectively distinguishes the real trip ends from pseudo ones under two circumstances of GPS signal available and lost. A total number of 89 trips were removed in the step of trip combination, where we set 50 m of the range of a trip end. Regarding trip attributes, the average duration of the detected trips is 336 m less than that of the reported, owing to the employment of integration of instantaneous speed over time. Accordingly, the time difference is only 88 s. It is worth mentioning that even with the prompt recall, volunteers forget to record 51 trips, which illustrates that trip underreport does exists.
The method has successfully detected 1893 trips, with 61 other trips that were detected but did not exist. So, the accuracy rate attains as high as 98.1%. Regarding the accuracy of the method as a variable, we estimate the accuracy interval between 97.5% and 98.7% with a 95% confidence level. To further evaluate the effectiveness of the proposed method, purity was introduced to express the likelihood that a real trip would be accurately detected by calculating the entropy. The entropy of our method is 0.18, which is relatively small and reflects the excellent performance of the method in trip detection. Finally, a simple but meaningful case study was presented to illustrate the function of purity. Taking both the accuracy rate and error rate into consideration, purity could provide a uniform standard of comparison in any GPS-related results. Although the proposed method does not rely on external data source (e.g. Geographic Information System (GIS)), the threshold value of the rules mainly depends on the studied area. It is recommended that future studies should concentrate on selecting proper threshold value combined with machine learning method.
Footnotes
Acknowledgements
The author would like to appreciate all who has provided recommendations and comments on this paper.
Academic Editor: Tao Feng
Declaration of conflicting interests
The author(s) declared no potential conflicts of interest with respect to the research, authorship, and/or publication of this article.
Funding
The author(s) disclosed receipt of the following financial support for the research, authorship, and/or publication of this article: This work was supported by the National Natural Science Foundation of China (grant no. 51478266) and the Fundamental Research Funds for the Central Universities (grant no. 16JCCS24).
Geolocation information
A part of respondents are recruited by Internet, while others are invited by social networks of our group members. The travel survey was launched in Shanghai from mid-October 2013 to late-April 2015. All the respondents are from Shanghai and the GPS records are collected within Shanghai.