
Abstract
Static and tension–tension fatigue experiments were conducted on T800/MTM46 cross-ply composite laminates. Fatigue limit and residual strength of the survival specimens were determined. Failure modes of static specimens are characterized by brittle fracture. However, failure modes of fatigue specimens are dominated by delamination, which tends to be more serious under low stress levels. Stiffness degradation can be presented by four stages, which is different from the previous researches. Matrix-dominated damage initiates first in the exterior plies especially in exterior 90° plies. Then, various types of damage appear in interior plies when damage in exterior plies has been very serious. Fatigue life data distribution was determined. Reliability fatigue life incorporating both reliability and confidence level was calculated using the single-side allowance factor. p-γ-S-N curve/surface was proposed to predict reliability fatigue life under various reliability and confidence levels.
Keywords
Introduction
Carbon fiber–reinforced polymer (CFRP) composites are widely used in aeronautics engineering because they exhibit excellent mechanical properties and good fatigue resistance, thus making the aircrafts lighter and improving performance.1–5 So, they frequently replace the metallic counterparts for numerous primary and secondary load-bearing structures.6–8 Although exhibiting good fatigue resistance, fatigue performances of CFRP composites are still a big concern because of long service life (25 years or even more) for both military and civil aircrafts. Usually, with the progress of cyclic load, many damages such as intra-ply delamination (delamination within plies), inter-ply delamination (delamination between plies), matrix cracks, fiber breakage, and interface debonding may appear, which can lead degradation in the mechanical properties of composites such as tension/compression strength.9,10 However, some researchers also found the opposite results. For example, tensile strength might increase after a certain number of fatigue cycles, which was resulted from that much off-axis fibers had been reassigned to the loading direction. 11 Thus, the strength after fatigue is one of the major ways to study fatigue issues in cost of material fracture. Later, many non-destructive evaluation (NDE) techniques were developed to evaluate the damage of CFRP composites under fatigue, such as infrared thermographic techniques, 12 acoustic emission, 13 X-ray radiography, 14 and X-ray micro-computed tomography (μCT). 15 Liang et al. 16 studied the properties of flax/epoxy composites under fatigue loading. The stiffening phenomenon of flax reinforcements which were oriented parallel to the loading direction has been confirmed. Philippidis and Passipoularidis 17 investigated the residual strength after fatigue in composite both theoretically and experimentally. They proposed several modified models to predict the residual strength, and the models could reach a good agreement with the experimental data. T Lotfi et al. 18 studied the damage evolution in woven composite laminates using infrared techniques. They found that the average temperature in the gage section of specimen increased with the increase in fatigue cycles. JS Tate and AD Kelkar 19 built a stiffness degradation model for biaxial braided composite of various braid angles. The proposed model could predict the stiffness degradation accurately compared to the experimental data. Kelkar et al. 20 investigated the static and tension–compression behavior of unstitched, stitched, and Z-pinned plain-woven composites applied in aerospace industry. They found that the reinforcements in Z-direction (thickness direction) such as stitching and Z-pinning improved interlaminar shear strength, but at the expense of reduction in tensile and compression strength. However, there are still few investigations on how and where various types of damage initiate and develop.
For many traditional metallic materials, their fatigue life data usually obey to logarithm-normal21,22 or three-parameter (3P) Weibull distribution.23,24 However, the damage and failure caused by fatigue loading are more complex than metallic materials. 25 Moreover, the complex damage and failure coupling with the inevitable defects generated in manufacturing may lead to a large dispersion in fatigue life data of composite materials, which can vary among two orders of magnitude or even more at a single-stress level.26–28 Thus, it is very necessary to explore distribution and reliability of fatigue life data of composite, which is important to guarantee the safety of composite applied in aircraft. Some researchers had pay attention to this problem. Raman 29 studied the rotating bending fatigue using two-parameter (2P) Weibull distribution. The reliability fatigue life under different failure properties Pf (Pf = 1 − Pr, Pr is the survival probability) was calculated, but the confidence level is not incorporated in the fatigue life. S Raif and AY Irfan 30 studied the bending fatigue life data of glass-fiber-reinforced polyester composite using 2P Weibull distribution. They drew the S-N curves under various reliability. However, the confidence level is not involved. Lee et al. 31 predicted the fatigue life of fiber composite materials using Weibull distribution. They drew the S-N curve under reliability 0.5 without confidence level. Other researchers also studied the reliability of composite materials using different distributions.32–34 However, as the authors know, the most of current studies on the reliability fatigue life just involve the reliability. Few investigations have include both reliability and confidence level to predict the reliability life.
In this article, the static and tension–tension (T-T) fatigue experiments were conducted on the T800/MTM46 cross-ply composite laminates. The fatigue performances were investigated. Fatigue life data were described by both logarithm-normal distribution and 3P Weibull distribution, and then, the better distribution was chosen. Based on the chosen distribution, the reliability fatigue life incorporating both reliability and confidence level was calculated.
Experiment
Materials
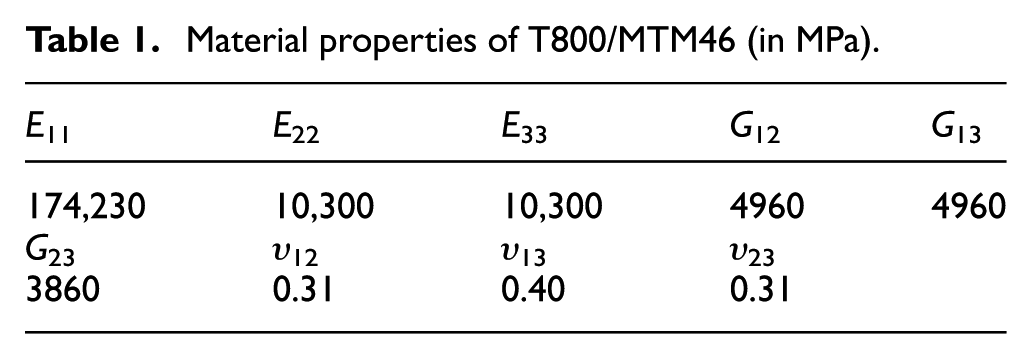
Specimens are made of carbon/epoxy composite T800/MTM46 unidirectional (UD) prepreg of thickness 0.125 mm. The materials are cured in 130°C for 120 min and then in 180°C for 90 min in an autoclave facility. Material properties of the prepreg are listed in Table 1. The static and fatigue specimens are designed by ASTM D3039/D3039M, 35 with the nominal dimensions of 250 mm (length) × 25 mm (width) × 2.5 mm (thickness). Ply sequences are cross-ply of [90/0]9. Both edges of all specimens are wet sanded with ordinal 180, 320, and 600 grit to improve edge quality. All specimens are end tabbed with 2-mm-thick glass fiber–reinforced polymer to protect the specimen surface from the jaws of test machine, leaving a gauge length of 150 mm.
Material properties of T800/MTM46 (in MPa).
Experimental method
Static tension experiments were conducted according to ASTM D3039/D3039M on a MTS 810 servo-hydraulic test machine, with a constant loading rate of 1 mm/min. An average of 10 MPa was typically used for grip pressure applied at the end-tabs. During the experiment, an extensometer with 30 mm gage length was used to monitor the strain. A total of three specimens were involved in the static experiments.
T–T fatigue experiments were conducted under constant amplitude load according to ASTM D3479/D3479M. 36 The fatigue experiment parameters were sinusoidal waveform, 10 Hz frequency, and stress ratio of 0.1. Fatigue loads were applied as percentages of ultimate tensile strength (UTS) determined by static tension experiments. Stress levels were starting from 70% UTS to 95% UTS in step of 5%. Fatigue tests were stopped at specimen failure or when cycles reached 106 cycles. In this article, failure refers to total catastrophic fracture. The fatigue load, where specimens survived 106 cycles, was referred as “fatigue limit” in this article. In each stress level, five specimens were involved. The experimental setups are shown in Figure 1.
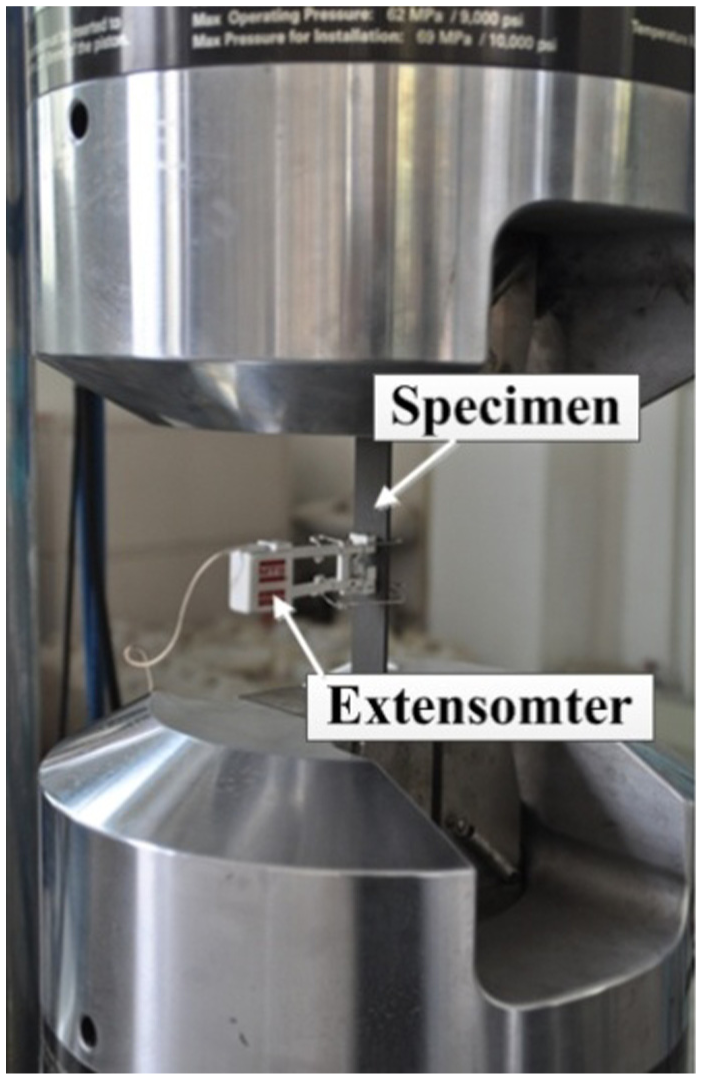
Experimental setup.
Experimental results and discussion
Static experiments
The stress–strain curves of T800/MTM46 composite laminates are shown in Figure 2. It is obvious that all curves (three curves) show good linearity during the whole loading process. Results of the three specimens are very repeatable, which indicates that the experiments are convincible and reasonable (Table 2). According to the previous researches, for many fiber-reinforced polymer composite laminates whose 0° ply occupies a relatively large proportion, its stress–strain behavior can exhibit total linearity in the whole loading history. 37 The average UTS is 1210.04 MPa with the Cv (coefficient of variation, standard deviation/average value ratio, representing the dispersion of data) of 0.01362. The modulus E in Table 2 is the tangent modulus in axial direction and determined based on the ratios of the UTS and ultimate strain. The average modulus E and ultimate strain are 85.94 GPa and 0.01408, respectively, with Cv of 0.01055 and 0.00325. Thus, the dispersion of static data is very small. The small dispersion of UTS may be caused by natural dispersion of fabrics and fiber mechanical properties. 15

Stress–strain curve.
Static experiment results.
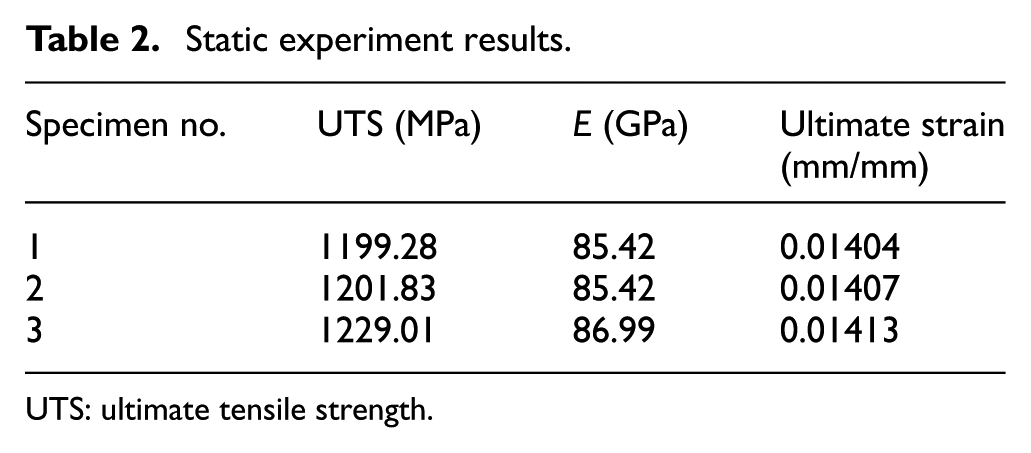
UTS: ultimate tensile strength.
Fracture modes of static specimens are shown in Figure 4(a). An obvious brittle fracture occurs around the middle section. The fracture part goes along the transverse direction (vertical to the loading direction) and exhibits linear type, which is located in the very limited region in the middle section compared to the whole scale gauge length of specimens. Lot of 0° fiber breakage can be found around the fracture part. However, no obvious delamination appears. Similar phenomenon is also found by F Ahamed et al. 26 and S Marouani et al. 38
Tension–tension fatigue experiments
Fatigue life data are listed in Table 3, which show a relatively low scattering compared to the fatigue testing results in Wang et al.
39
As mentioned in previous researches about metallic materials, the fatigue life data under low stress level tend to show large scatter and that under high stress level has small scatter.40,41 However, the Cv of fatigue life data under 95%–75% UTS is 0.6, 0.6, 0.72, 0.74, and 0.54. Thus, there is no clear trend in scatter of fatigue life data for T800/MTM46 composite laminates, which is far different from the fatigue life data of traditional metallic materials. Due to too much run-out fatigue life data under 70% UTS, S-N curve was graphed without the 70% UTS data in Figure 3. y axis is shown by the normalized stress level
Tension–tension fatigue life data.

UTS: ultimate tensile strength.

S-N curve.
The fracture modes of fatigue specimens under various stress level (75%–95% UTS) are shown in Figure 4(c)–(g). Ultimate failure of fatigue specimens is catastrophic and engender an explosive sound. The main fracture modes contain much 0° fibers breakage and extensive delamination. Especially, delamination is very dominating, which is far different from brittle fracture of static ones. Additionally, various-degree pull-out fibers and missing/fall-out matrix can be found during and after the experiments. This phenomenon indicates that much damage occur in fiber/matrix interface. So, the fatigue load applied on the composites can lead more matrix-dominated damage, such as delamination and fiber/matrix interface failure. However, the degree of delamination under different stress level tends to show large discrepancy. Fatigue specimens under low stress level tend to have more serious delamination. In Figure 4(c)–(g), the fatigue specimens under 95% and 90% UTS have relatively slight delamination. However, the delamination of fatigue specimens under 80% and 75% UTS is more extensive and catastrophic. Especially, the 75% UTS specimens tend to be the most serious ones. Obviously, the most extensive pull-out fibers and missing/fall-out matrix can be also observed in failure specimens of 75% UTS (Figure 4(i), in edge view), which is more obvious by comparing with specimens under 85% UTS (Figure 4(h), in edge view). Usually, more mechanical energy by test machine is imposed on the fatigue specimens under low stress level, which may contribute to this phenomenon.

Fracture modes of (a) static specimen, (b) run-out specimen, (c) 95% UTS, (d) 90% UTS, (e) 85% UTS, (f) 80% UTS, and (g) 75% UTS in top view and (h) 85% UTS and (i) 75% UTS in edge view.
Run-out specimens were also tested to evaluate residual tensile strength. The stress–strain curve of one run-out specimen is shown in Figure 2, which also shows obvious linearity through the whole loading process. (Because of the very repeating results, only one run-out specimen is shown in Figure 2. In total, three run-out specimens are tested.) The residual strength results of run-out specimens are listed in Table 4. UTS of the run-out specimens has no obvious change compared to non-cycle ones. However, the average modulus of run-out specimens descends about 14.03%. The fracture modes of run-out specimens are shown in Figure 4(b), which is different from the non-cycle specimen (Figure 4(a)). Many pull-out bundles of fibers and loose matrix sites can be observed. Additionally, obvious delamination also appears. Thus, although the run-out specimens survived 106 cycles, much damage in interface has been accumulated during the fatigue, which leads to the obvious delamination in failure modes.
Run-out residual strength.

UTS: ultimate tensile strength.
As mentioned before, the modulus or stiffness degradation often occurs during fatigue loading, which can show the progressive damage accumulation. So, the stiffness degradation under various stress level was monitored during fatigue loading in this article. The stiffness was calculated using equation (1) 42

EN is the stiffness at N cycle, E0 is the initial stiffness,
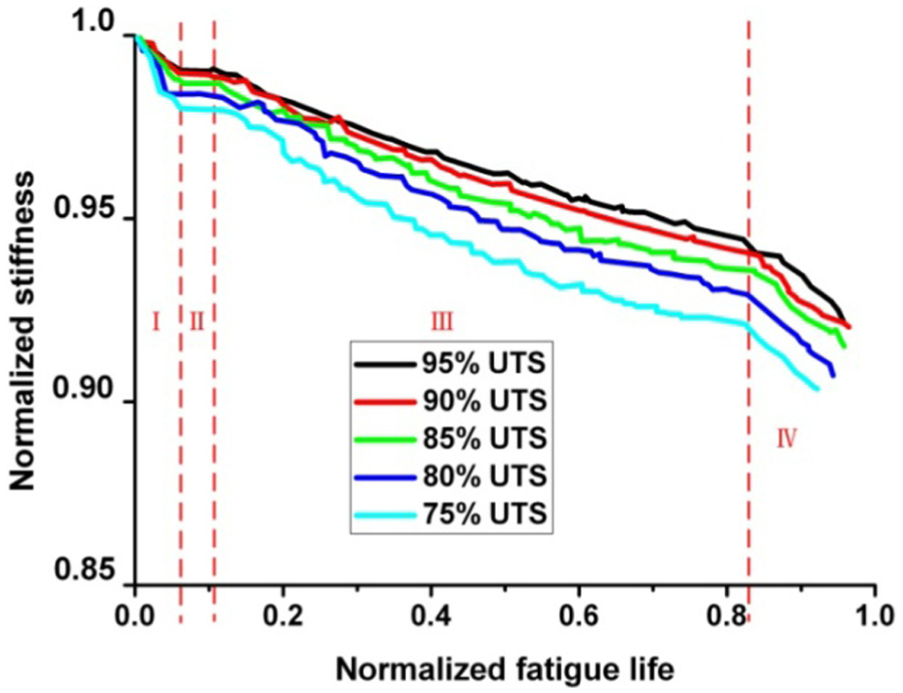
Stiffness degradation curves.
The failure of composite under fatigue load is very complex, which may result in many types of damage. Thus, the edge views of specimens were observed during fatigue loading. In this article, the edge view under 85% UTS (No. 2 specimen; Nf = 35,589 cycles) is presented in Figure 6 to verify the damage evolution during the fatigue loading. Before the experiments, no obvious damage can be found (Figure 6(a)). However, various types of damage appear successively with the increase in fatigue cycles. In Figure 6(b) (Nb = 3000 cycles), intra-ply delamination and transverse cracks appear in the exterior 90° plies (especially surface 90° plies). On the contrary, the interior plies do not show obvious damage. When the cycles reach 10,000 (Figure 6(c)), clear inter-ply delamination can be observed between the exterior 90° and 0° plies. Additionally, transverse matrix cracks come into being in the exterior 90° plies. No obvious damage appears in the interior plies. In Figure 6(b) and (c), the matrix cracks form along the fiber–matrix interface, propagate in through-thickness direction, and terminate at the adjacent plies (another interface). In Figure 6(d) (Nd = 15,000 cycles), the interior plies begin to show damage such as intra-ply delamination in 0° plies, inter-ply delamination, and obvious pull-out fibers. At the same time, the damage in exterior plies develops more seriously. In Figure 6(e) (Ne = 30,000 cycles), a large number of fiber breakage and pull-out fibers can be found in interior 0° plies. Obvious matrix appears in interior 90° plies. It is interesting to note that Ne/Nf = 84.2%, around which the stiffness tends to decrease sharply in stage IV (Figure 5). Thus, the initiation of plenty of 0° fiber breakages and pull-out fibers in interior plies may contribute to the sharp decline in stiffness around 82% fatigue life and then lead to the ultimate failure.
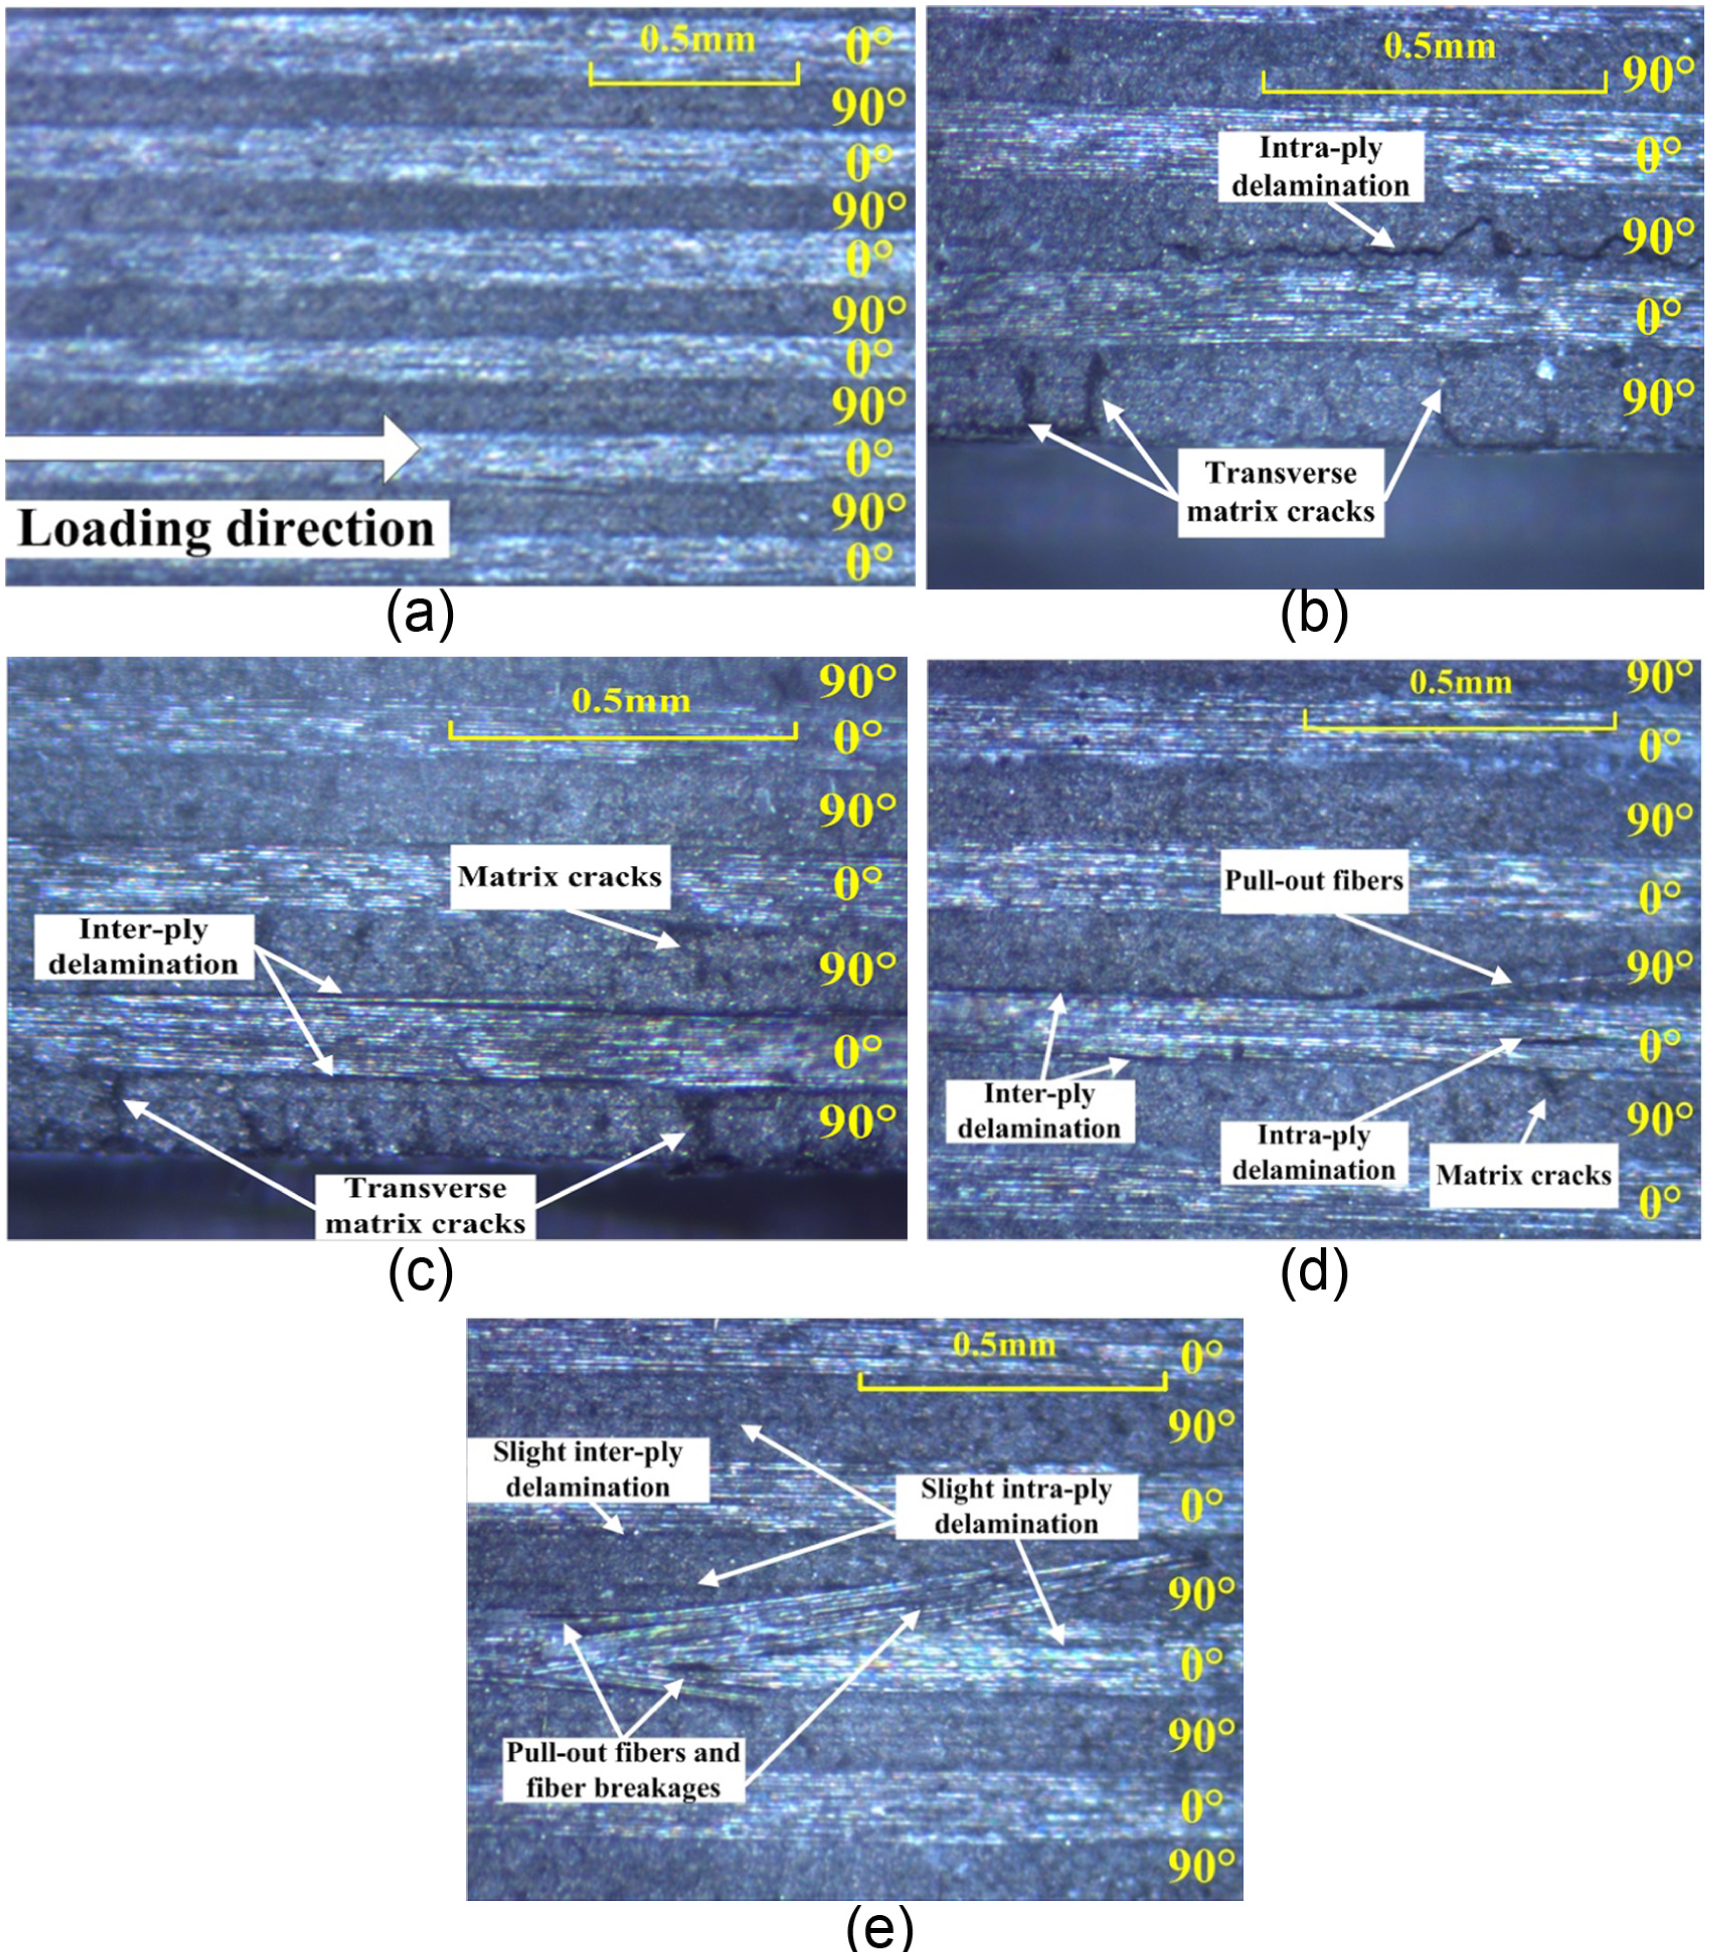
Edge views of fatigued specimens under 85% UTS at (a) 0 cycles, (b) N = 3000 cycles, (c) 10,000 cycles, (d) 15,000 cycles, and (e) 30,000 cycles.
The damage initiates in the exterior plies especially in the exterior 90° plies. Matrix cracks and intra-ply delamination appear first; 90° plies are matrix-dominated, which contribute to the easy initiation of damage such as matrix cracks and intra-ply delamination. With the increase in fatigue cycles, other types of damage appear successively such as inter-ply delamination, fiber breakages, and pull-out fibers both in exterior and interior plies. According to the observation, the damage in interior plies appears only when the damage in exterior plies reaches a very serious level or the exterior plies tend to hold no more damage. Once large amount of damage generate in interior plies, the stiffness may begin to decrease at high rate, which is the signal of ultimate failure of specimens.
Distribution determination of fatigue life data
In this article, logarithm-normal distribution and 3P Weibull distribution were both used to fit the fatigue life data. The better fitting distribution was determined according to the correlation coefficient r.
Distribution of fatigue life data
Logarithm-normal distribution
Probability density function (PDF) and cumulative distribution function (CDF) of logarithm-normal distribution are shown in equations (2) and (3)


where
Equation (2) can be converted into equation (4)
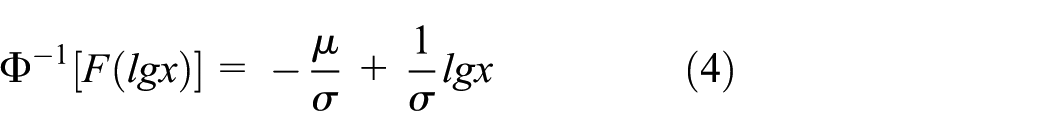
By setting

The evaluating values of
The evaluating value of
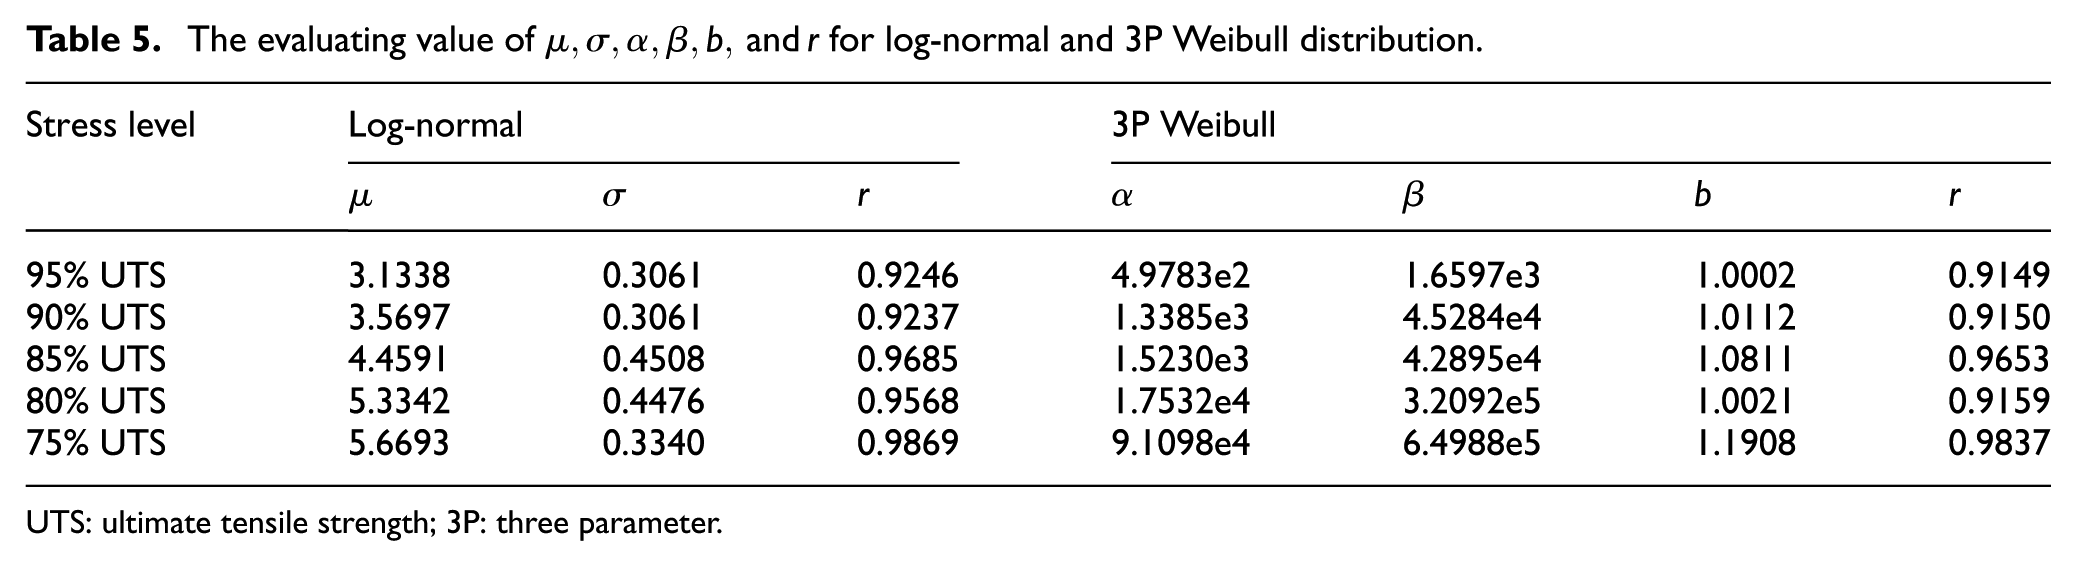
UTS: ultimate tensile strength; 3P: three parameter.
3P Weibull distribution
PDF and CDF of 3P Weibull distribution are shown in equations (6) and (7)


where
Equation (7) can be converted into equation (8)
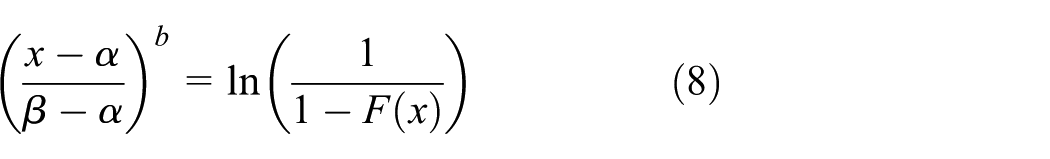
Taking logarithm of both sides of equation (7), it can be rewritten as equation (9)

Setting

The empirical frequency function is defined as equation (11)
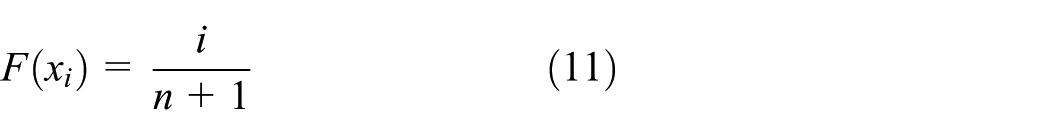
where n is the sample size and i is the serial number of fatigue life data in the ascending order of the minimum to maximum. The values of
Statistical test
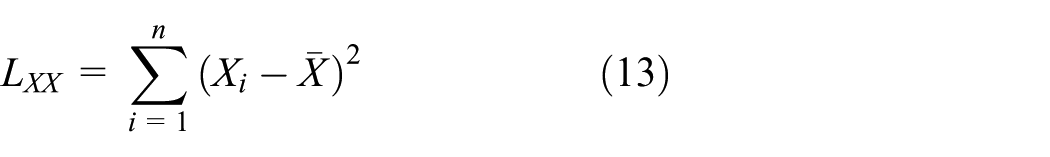
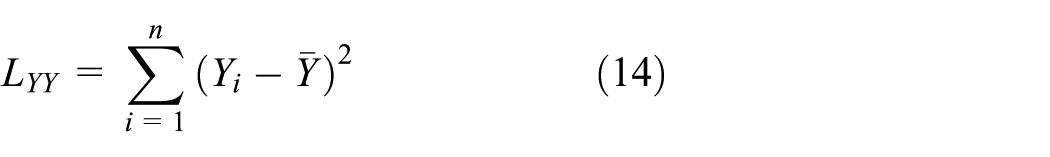
To determine which distribution, logarithm-normal distribution or 3P Weibull distribution, is more precise to fit the fatigue life data, the correlation coefficient r is applied. r is defined as equation (12) 44

where

Equation

where
Based on equation (16), the threshold value ra can be obtained as equation (17) at a given confidence level
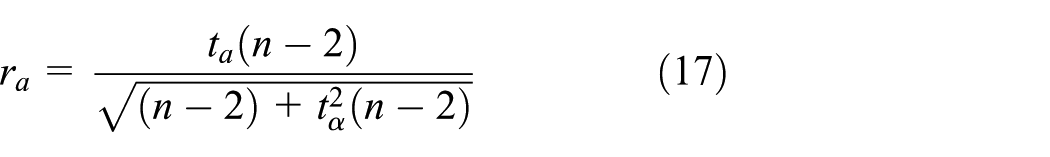
The calculated correlation coefficient r of logarithm-normal distribution and 3P Weibull distribution is listed in Table 5. It is obvious that r of the two distribution at each stress level is larger than the threshold value 0.878 (at the sample size of n = 5). So, fatigue life data of T800/MTM46 materials obey to both logarithm-normal distribution and 3P Weibull distribution. However, the r of logarithm-normal distribution is larger than that of 3P Weibull distribution at each stress level, which indicates that the logarithm-normal distribution is better to describe the fatigue life data of T800/MTM46 materials. Thus, the reliability fatigue life was analyzed later using logarithm-normal distribution.
Reliability fatigue life
Single-side allowance factor
In many fatigue experiments on composite materials, the numbers of specimens are limited because of high cost. Thus, it is necessary to study the reliability fatigue life. However, as mentioned above, almost all the current researches fail to incorporate both the reliability and confidence level to predict the reliability fatigue life. Thus, single-side allowance factor was used to solve this problem based on logarithm-normal distribution. Reliability fatigue life involving reliability and confidence level can be calculated using single-side allowance.
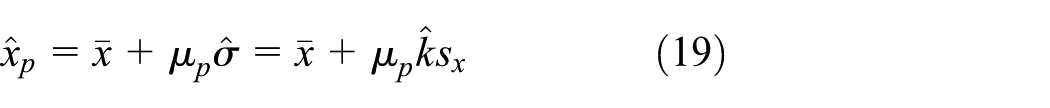
In previous analysis, the logarithm-normal distribution can describe the fatigue life data more accurately. Thus, the logarithm reliability life

Due to the uncertainty of

n is the sample size and
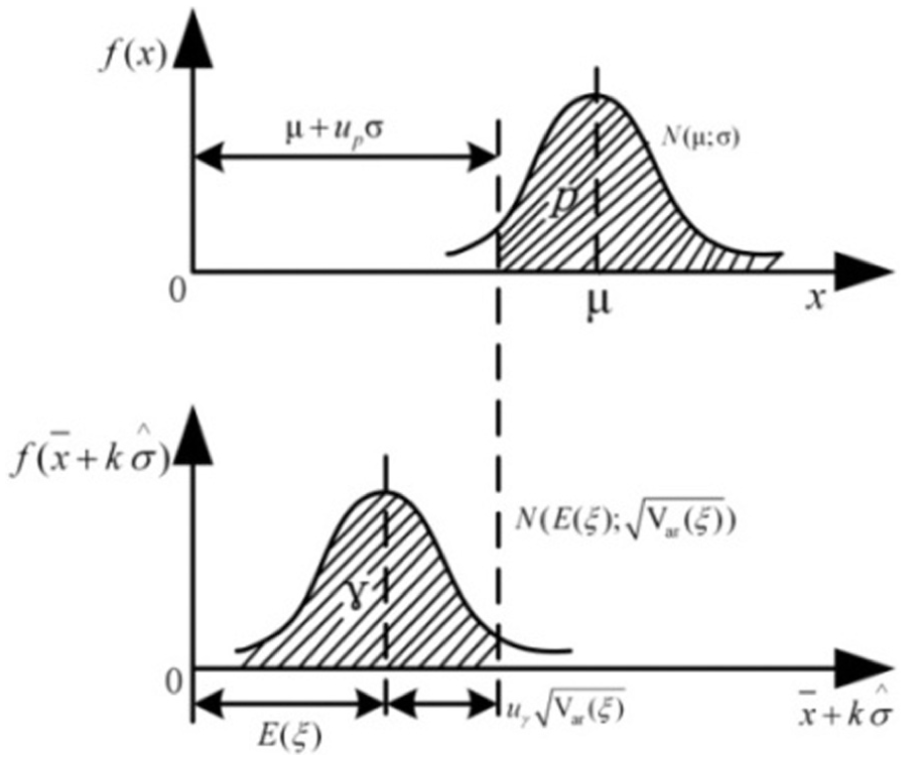
PDF of normal distribution.
Thus
Random variable ξ can be expressed as

Assuming

According to the statistical theory,

It is obvious that

Based on equation (22), the variance

Here

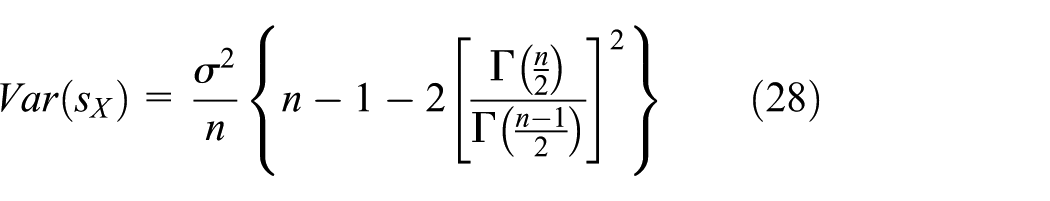
Substituting equations (20), (27), and (28) into equation (26),

When

Thus, equation (29) can be simplified into equation (31)

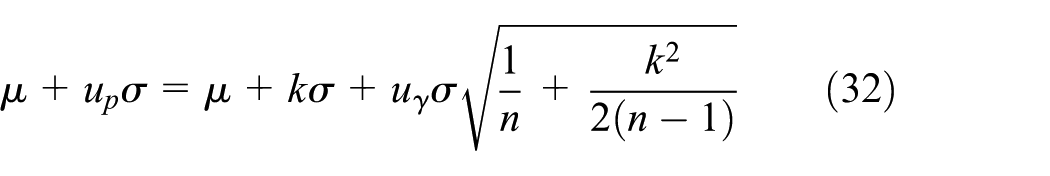
Substituting equations (25) and (31) into equation (23), equation (32) can be obtained
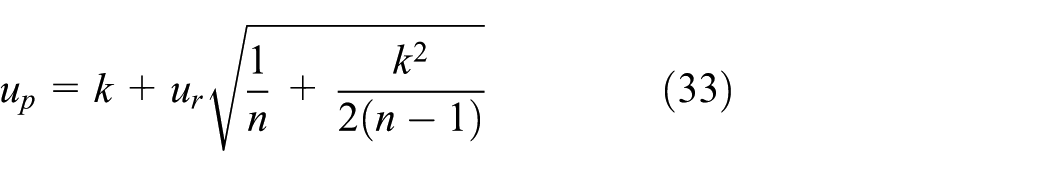
Then
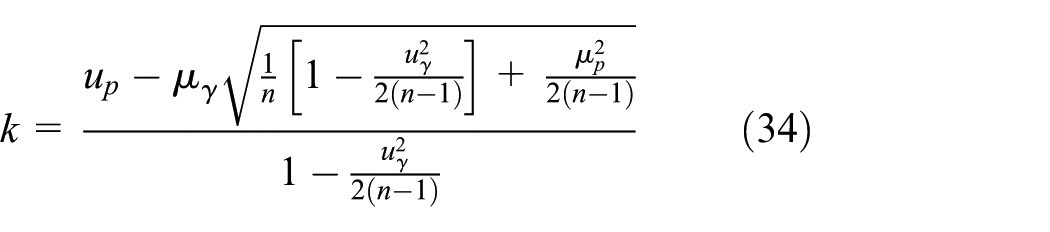
So, the single-side allowance factor k can be presented as equation (34)
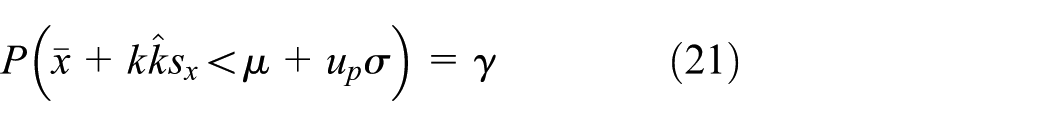
When the reliability p and confidence level

Eventually, reliability fatigue life

The value of

The value of k under various reliability p and confidence level
The value of k is graphed against the sample size n under various confidence level (Figure 9) and various reliability (Figure 10). k increases with the sample increasing at a given confidence level or reliability (except when p = 90% and

The value of k versus sample size number at various confidence level (p = 90%).
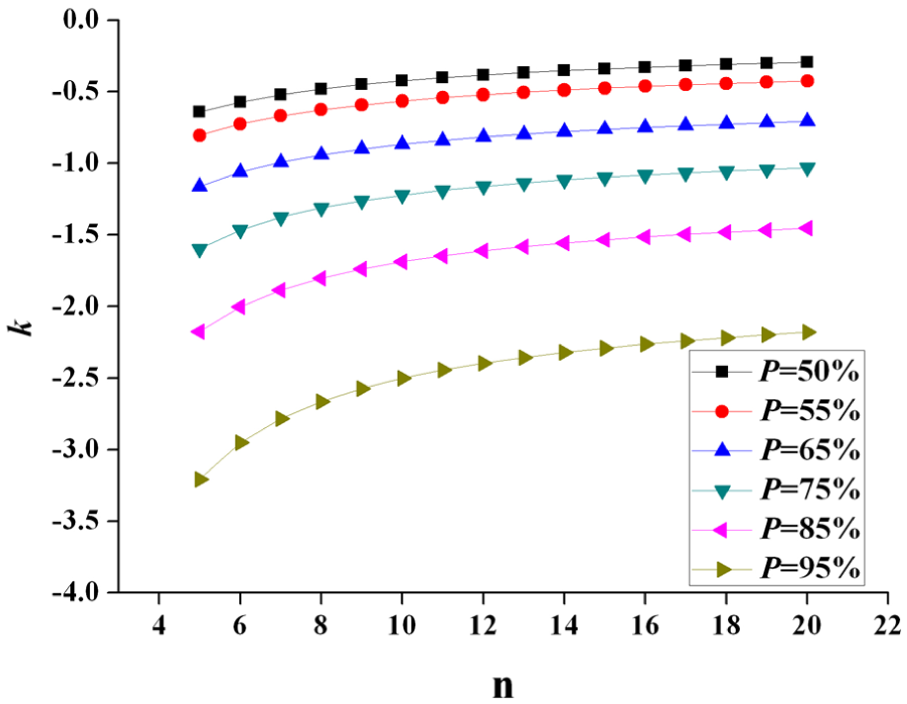
The value of k versus sample size number at various reliability
Reliability fatigue life and p-γ-S-N curve/surface
Reliability fatigue life

UTS: ultimate tensile strength.
Reliability fatigue life

UTS: ultimate tensile strength.
One of the most popular ways to describe the fatigue life data is power function. Thus, the S-N curve is presented as equation (37)

S is the stress level, N is the fatigue life, and m and C are the constants.
Replace N by

Taking logarithm on both side of equation (38), equation (39) can be obtained

Through setting

Thus, the p-γ-S-N curves under various confidence level (reliability p = 95%) are graphed in Figure 11 using the fatigue life data in Table 6. The correlation coefficient r for γ = 50%, 65%, 80%, and 95% is 0.9861, 0.9877, 0.9891, and 0.9812, respectively, which indicates that the fitting is very precise. The reliability fatigue life

p-γ-S-N curves under various confidence level (p = 95%).

p-γ-S-N curves under various confidence level (γ = 95%).
Actually, the S-N curves in Figure 3 are obtained under reliability p = 50% and γ = 50%, which is a special case in p-γ-S-N curves (the dashed line in Figures 11 and 12). Obviously, the p-γ-S-N curves predicted in this article are all located on the left side of S-N curve, which also indicate that the reliability fatigue life decreases when the reliability and confidence level increase. So, we can get a safer prediction of fatigue life using p-γ-S-N curve (p ≥ 50% and
To predict the whole scale

p-γ-S-N surface.
Conclusion
T–T fatigue behaviors of T800/MTM46 composite laminates and its reliability fatigue life involving both reliability and confidence level were studied in this article. The major results and conclusions are summarized as follows:
Various degree of delamination is the most notable failure modes of fatigued specimens, which is far different from the brittle fracture of static specimens. Additionally, the fatigued failure specimens under low stress level (75% and 80%UTS) have more serious delamination (through the whole gauge length) than those under high stress level (90% and 95% UTS).
Average UTS of the run-out specimens do not show obvious change compared to that of non-cycle specimens. However, the modulus has a 14.03% decline. The stress–strain curves of run-out specimens still show clear linearity. Scatter of fatigue life data under various stress level does not show clear trend, which differs with the traditional metallic materials. The fatigue limit is about 74.5% UTS.
Stiffness degradation is presented by four stages. In stage I (about 0%–7% fatigue life), the stiffness decreases quickly. Then, a notable stable platform follows behind, which is stage II (about 7%–11% fatigue life). After that, the stiffness decreases at a quasi-constant low rate in a time-consuming manner, which is stage III (about 11%–82% fatigue life). In stage IV (about 82%–100% fatigue life), the stiffness tends to have a sharp drop, which is the signal of ultimate failure.
Matrix-dominated damage including the matrix cracks and intra-ply delamination initiate first in exterior plies, especially in exterior 90° plies. Then, the interior plies generate the damage only when the exterior plies have very serious damage and tend to have no ability to carry more damage. Lot of 0° fiber breakages and pull-out fibers in interior piles in the later period of fatigue life may contribute to the sharp decline of stiffness in stage IV.
Log-normal and 3P Weibull distribution both can describe the fatigue data well but the log-normal distribution is the better one. Reliability fatigue life
p-γ-S-N curve is proposed using power function to predict
Footnotes
Acknowledgements
The authors wish to thank the reviewers and editors for their help.
Academic Editor: Filippo Berto
Declaration of conflicting interests
The author(s) declared no potential conflicts of interest with respect to the research, authorship, and/or publication of this article.
Funding
The author(s) disclosed receipt of the following financial support for the research, authorship, and/or publication of this article: This study was financially supported by the National Natural Science Foundation of China (51475470).