
Abstract
Gear failure is the main cause of machine malfunction. Therefore, it has become increasingly important to detect gear failure to ensure the normal operation of a machine. Here, we propose a gear damage detection and localization approach by studying the vibration signal of an individual gear tooth and support vector machines. Generally, it is difficult to detect a small gear failure in the total vibration signal. The waveform of an individual gear tooth was studied to investigate the vibration features of a gear in more detail. The characteristics of damaged and normal teeth were investigated by analyzing their individual waveform. Besides, the feature parameters were also extracted from both the time and frequency domains of the waveform to investigate the characteristics of each gear tooth. The difference between the damaged and normal teeth was detected by the waveform and feature parameters. Additionally, the condition of each gear tooth was diagnosed by support vector machines using the extracted feature parameters. The method was used to analyze the results of cyclic fatigue experiments. The conditions of most of the gear teeth were correctly classified, validating the proposed method.
Introduction
In most machine systems, the gear device is one of the essential transmission mechanisms. Gear failures affect the operation of the entire system. Therefore, it is crucial to diagnose gear failures to ensure the normal operation of a mechanical system. Several methods have been developed for the diagnosis of gear failures. Especially, vibration signal analysis is an efficient method for diagnosing gear damage. 1
Although vibration signal analysis is convenient and efficient, this method still suffers from some problems. Because vibration signal is usually affected by environmental noise or vibration of other components, the abnormal features of gear damage are not clear in the original signal, especially when the gear damage is small. 2 In addition, because many gears work at the same time, it is beneficial to study the signal of some specific gears in order to precisely locate the gear damage. The time synchronous averaging (TSA) technology has advantages of reducing noise and extracting the signal of the target object.3,4 Many methods for gear failure detection have been developed using the TSA technique. Mafadden1,5 used the TSA technology to develop the residual signal method. Then, the damaged tooth was detected by studying the phase angle and amplitude of the residual signal. Wang and McFadden 6 extracted the signal of an individual gear using the TSA technology and detected the early gear damage by investigating the extracted signal in the frequency domain. Dalpiaz et al. 7 used the TSA method to preprocess the vibration signal. Then, the vibration features of two different depths of the crack were investigated, and the damaged tooth was localized. However, most of the previous studies including all the cases shown above mainly concentrated on detecting the gear failures by analyzing the total vibration signal. In some precision or important machines, it needs not only the detection but also the localization of gear tooth fault. Some literatures have reported a few studies on the detection and localization of gear faults. Jena et al.8,9 detected the gear faults by utilizing undecimated wavelet transform method to denoise the acoustic signal or the vibration signal on gear box, and located the tooth fault by measuring the angles between prominent spikes in the time marginal integration graph of the analytic wavelet transform (AWT) scalogram. This study detected the gear fault with a satisfactory accuracy, but it located the damaged tooth by manually observing the prominent spikes in the graph, which cannot be used in the automatic diagnosis program. Yang and Makis 10 detected and located the gear fault using an autoregressive model with exogenous variables for a gear box. However, this study could only locate the gear fault in some section of the gear which consists of a few adjacent teeth, which could not find the exact tooth. Gui et al. 11 detected and located the tooth breakage fault on wind turbine planetary gear system by analyzing the fault characteristic frequencies of gears. However, the tooth fault can only be located in some gear and the tooth breakage is a serious failure. The effectiveness of this method to the small gear damage still needs to be investigated. This article tried to study on the precise detection and localization of small gear damage by analyzing the vibration signal on one gear tooth meshing. Normally, the abnormal waveform generated by a small gear damage is weak in the total vibration signal, and it is difficult to detect a small failure. Because of the damage on tooth surface or manufacturing error, the tooth profile error and surface condition of each gear tooth are different. The waveform on each gear tooth is also different from each other. If we separately extract the signal of an individual tooth to study further in detail, the vibration features of each gear tooth would be more clear. Then, it is possible to distinguish the damaged tooth from the normal tooth. Therefore, the signal of an individual gear tooth was investigated in this study. The signal of the test gear was acquired after processing the original signal by the TSA method. Then, the acquired signal of the test gear was divided into many parts by the meshing time interval of one gear tooth. Each part of the signal represents the signal of a complete tooth meshing. Then, the characteristics of one gear tooth were investigated using the waveforms and their feature parameters. Therefore, we attempted to detect and locate the gear fault by studying the features extracted from the time synchronous averaged vibration signal of each gear tooth. Particularly, each gear tooth profile which is not identical in a gear was studied, and the difference in the vibration signal generated by the tooth profile error was evaluated.
In recent years, with the development of information technology, many artificial intelligent methods have been developed and used in health on-line monitoring and failure diagnosis systems. 12 Support vector machine (SVM) is a new artificial intelligent method that can analyze the data, recognize the pattern, and used in classification and regression analysis. SVM was developed by Vapnik 13 in the early 1990s. SVM has been used in the fault diagnosis of many machines because of its good generalization capability and high diagnostic accuracy.14–17 In particular, SVM is appropriate for solving small sample machine learning problems. 13 Because the number of samples acquired in a gear-testing experiment or practical application is usually not large enough, SVM was used to diagnose gear failure in this study.
The method developed in this study not only detects but also locates the gear fault by applying SVMs to the features extracted from the time synchronous averaged vibration signal of an individual gear tooth. Especially, each gear tooth profile and the difference in the vibration signal generated by the tooth profile error were investigated in this study. The vibration signal of a gear box was investigated. The signal of the test gear was acquired by preprocessing the vibration signal using the TSA method. Next, the waveform of an individual gear tooth was acquired to investigate the features of the test gear in more detail. Besides, some feature parameters were also calculated to quantitatively investigate the characteristics of each gear tooth. The failure feature vector was obtained by optimizing the extracted feature parameters. Finally, the gear damage was diagnosed by SVMs using the optimized failure feature vector. A cyclic fatigue experiment was conducted to validate the developed method.
SVMs
SVMs were developed based on statistical learning theory.
12
This can improve the generalization ability of the learning machine by minimizing the structural risk. Therefore, SVMs are effective in solving the learning, classification, and prediction problem of small samples. Supposing a case of linear classification of two classes (see Figure 1), a set of samples was expressed as {(

Linear classification of two classes using SVMs.
The decision function of SVMs for linear classification can be defined as follows 18

where
SVMs can also solve the nonlinear classification problem. In this case, the feature vector was mapped into the high-dimensional feature space using a kernel function. Next, the hyperplane was constructed in the feature space.12,19 The decision function of SVMs can be defined as follows 18

where k (
Experiments
Experimental apparatus
Cyclic fatigue experiments were conducted using a power circulating–type gear-testing machine as shown in Figure 2. The bearing stand and gear box were separately mounted on the base plate. The vibration of gear box was caused by the test gear using the transmission of gear shaft, bearing stand, and base plate. The vibration acceleration of gear box was measured using an accelerometer set on a gear box cover. Besides, the index disk and photosensor were used to acquire the pitch signal. The temperature of lubricating oil was monitored using a thermometer.

Schematic diagram of power circulating–type gear-testing machine.
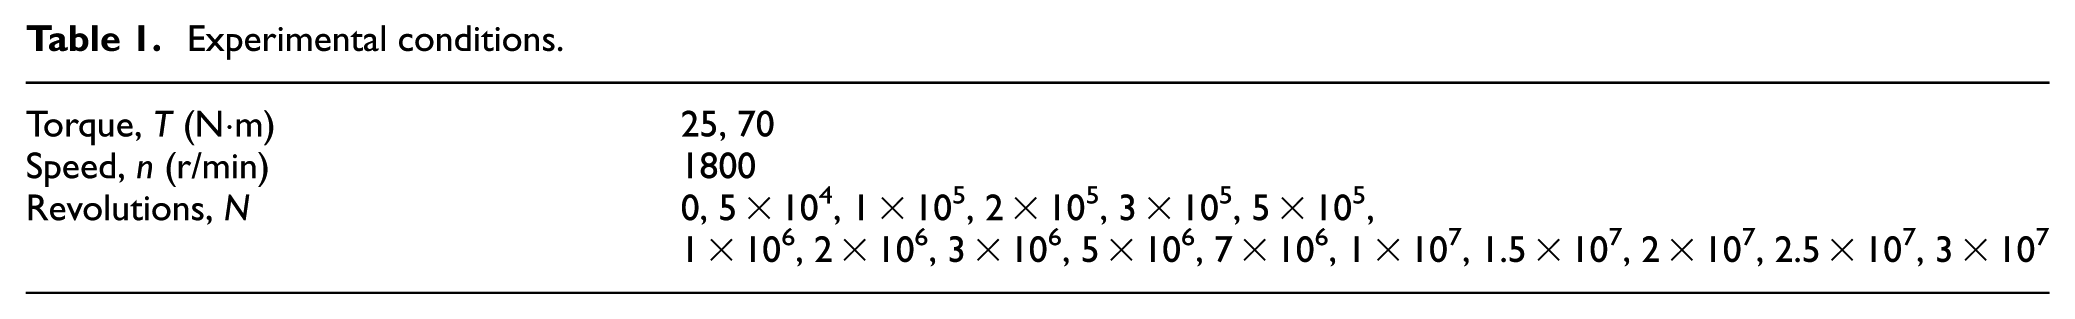
Table 1 shows the experimental conditions. The cyclic fatigue tests were conducted using two loads and two test gears. One of the test gears was run until 3 × 10⁷ revolutions with a speed of 1800 r/min and loading torque of 25 N
Experimental conditions.
Test gears
Two gears were separately tested in the experiment. The gear specifications are shown in Table 2. The test gear is the driving gear. The teeth number of both the test gears and their driven gears were 27 and 31, respectively. All the gears are involute spur gears.
Specifications of the test gears.

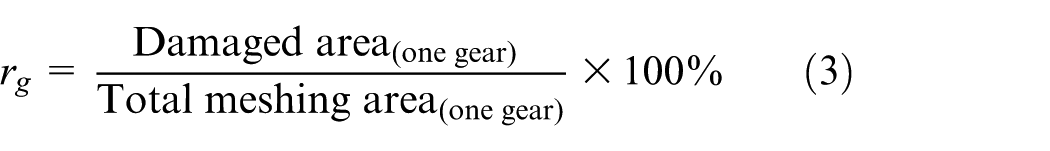
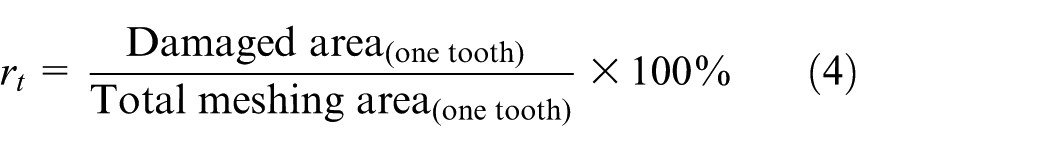
The damage area ratio of the test gears was also measured during the experiment. As shown in Figure 3(a), the pitting damage appeared on the test gear since 2 × 10⁶ revolutions and increased with the increase in revolutions. The damage area changed slightly between 2 × 10⁶ and 1.5 × 10⁷ revolutions, and it clearly increased after 1.5 × 10⁷ revolutions. Figure 3(b) shows that the pitting damage of test gear appeared since 106 revolutions and increased rapidly since 2 × 10⁶ revolutions. Compared to the result acquired under 25 N·m load, the pitting damage occurred earlier on the test gear under 70 N·m load. This shows that a larger load torque will accelerate the deterioration of gears. The test gear status was classified into normal, small failure, and serious failure conditions based on the damage area ratio of test gear (rg). When the ratio was <0.5%, the gear condition was defined as a small failure, and when the ratio is >0.5%, it was defined as a serious failure. Under 25 N·m load, the gear condition of the test gear was normal from 0 to 2 × 10⁶, small failure appeared between 2 × 10⁶ and 1.5 × 10⁷ revolutions, and the serious failure appeared after 1.5 × 10⁷ revolutions. Under 70 N·m load, the gear condition of the test gear was normal before 106 revolutions, small failure appeared between 106 and 3 × 10⁶ revolutions, and the serious failure appeared after 3 × 10⁶ revolutions. The tooth condition was also classified into normal, small failure, and serious failure conditions based on the damage area ratio of one tooth (rt). The tooth condition was defined as a small failure when the ratio was <5%, whereas it was a serious failure if the ratio was >5%. The damage area ratio can be calculated as follows

Pitting damage area ratio of the test gears: (a) ratios acquired under 25 N·m and (b) ratios acquired under 70 N·m.
The tooth surface photograph of the test gear under 25 N·m load was used to show the variation in the pitting damage during the cyclic fatigue test. According to the result, when the load was 25 N·m, the pitting failure initially occurred on No. 25 tooth surface of the test gear, and the damage area of No. 25 tooth was almost the largest at different stages. Therefore, the photograph of No. 25 tooth was used to typically represent the tooth surface of different conditions, as shown in Figure 4. Under the normal condition, the tooth surface had no damage. Under the small failure condition, the pitting damage occurred around the pitch line, and the damage area was small. Under the serious failure condition, the pitting failure extended to the entire tooth width, and the damage area was obviously larger than that of the small failure condition. The tooth profile error was also measured during the experiment. Figure 5 shows the tooth profile error of No. 25 tooth of test gear under the load of 25 N·m. The tooth profile error was approximately within 40 µm. Compared to the normal condition, some profile errors became slightly larger under the small failure condition. The tooth profile error clearly changed under the serious failure condition, especially around the pitch point. Because the contact stress and friction of the pitch point are higher than those of the other parts on the tooth surface, the pitting damage will occur around the pitch line first.

Tooth surface of the test gear under 25 N·m: (a) normal condition (N = 5 × 10⁴), (b) small failure condition (N = 3 × 10⁶), and (c) serious failure condition (N = 3 × 10⁷).

Variation of tooth profile error of the test gear under 25 N·m: (a) normal condition (N = 5 × 10⁴), (b) small failure condition (N = 3 × 10⁶), and (c) serious failure condition (N = 3 × 10⁷).
Experimental results and discussions
Original and TSA signals
The original signal is the vibration signal of gear box. In the signal processing, the original signal was averaged using the TSA method based on the driving gear revolutions. After the signal processing, the acquired signal was named as the TSA signal, mainly consisting of the vibration signal of the test gear. The experimental results acquired under 25 N·m load was selected as the example to illustrate the data processing procedure.
The original and TSA signals under the normal, small failure, and serious failure conditions were used as the examples as shown in Figure 6. The signals shown in the figure were acquired at N = 5 × 10⁴, 3 × 10⁶, and 3 × 10⁷ revolutions. The gear condition was normal at N = 5 × 10⁴ revolutions. At N = 3 × 10⁶ revolutions, a small pitting damage appeared on No. 25 tooth surface. The damage area ratio was 0.04%, and the gear condition was small failure. At N = 3 × 10⁷ revolutions, the damage area ratio was 6.5%, and the gear condition was serious failure. Compared to the original signal, the waveform of TSA signal became smoother and smaller. This is because some disturbance signals, such as the noise and signals of the other components in the machine, are decreased using the TSA method. Besides, in the TSA signal under the normal and small failure conditions, the crest was clear, and its number was 27. The number is the same as the teeth number of the test gear. The TSA method was found to be efficient in extracting the signal of the interested gear. Figure 6(a) shows that the signal is almost stable around the entire period. Figure 6(b) shows that the signal of No. 25 tooth is slightly larger. However, it is still difficult to detect the abnormal waveform in both the original and TSA signals. Figure 6(c) shows that the vibration accelerations became larger and more disordered. This is because most of the gear teeth were damaged at 3 × 10⁷ revolutions, and a larger tooth profile error resulted in a stronger vibration. The serious failure condition can be generally diagnosed by observing the vibration signal. However, because the distinction between the small failure and normal conditions is not clear, it is difficult to detect a slight damage from the total vibration signal.

Vibration signal and TSA signal on gear box acquired under 25 N·m: (a) normal condition (N = 5 × 10⁴), (b) small failure condition (N = 3 × 10⁶), and (c) serious failure condition (N = 3 × 10⁷).
Vibration signal of an individual gear tooth
As discussed in the last section, it is still difficult to detect the abnormal waveform caused by gear damage. Thus, the waveform of an individual tooth was analyzed to investigate the characteristics of a damaged tooth in more detail. The TSA signal shown in Figure 6 was separated into 27 parts by the meshing time interval of one tooth, which is 2.03 ms. Each divided part of the TSA signal represents the signal of a complete tooth meshing. Because it is difficult to clearly show the waveforms of all the teeth in a graph, the waveforms of Nos. 14 and 25 teeth were selected to illustrate the vibration features of normal and damaged teeth, respectively, as shown in Figure 7. Furthermore, the average signal of one gear tooth was also acquired by averaging the waveforms of all the gear teeth. As presented in Figure 7, the signals of Nos. 14 and 25 teeth and average signal are shown by dotted, dashed, and solid lines, respectively.
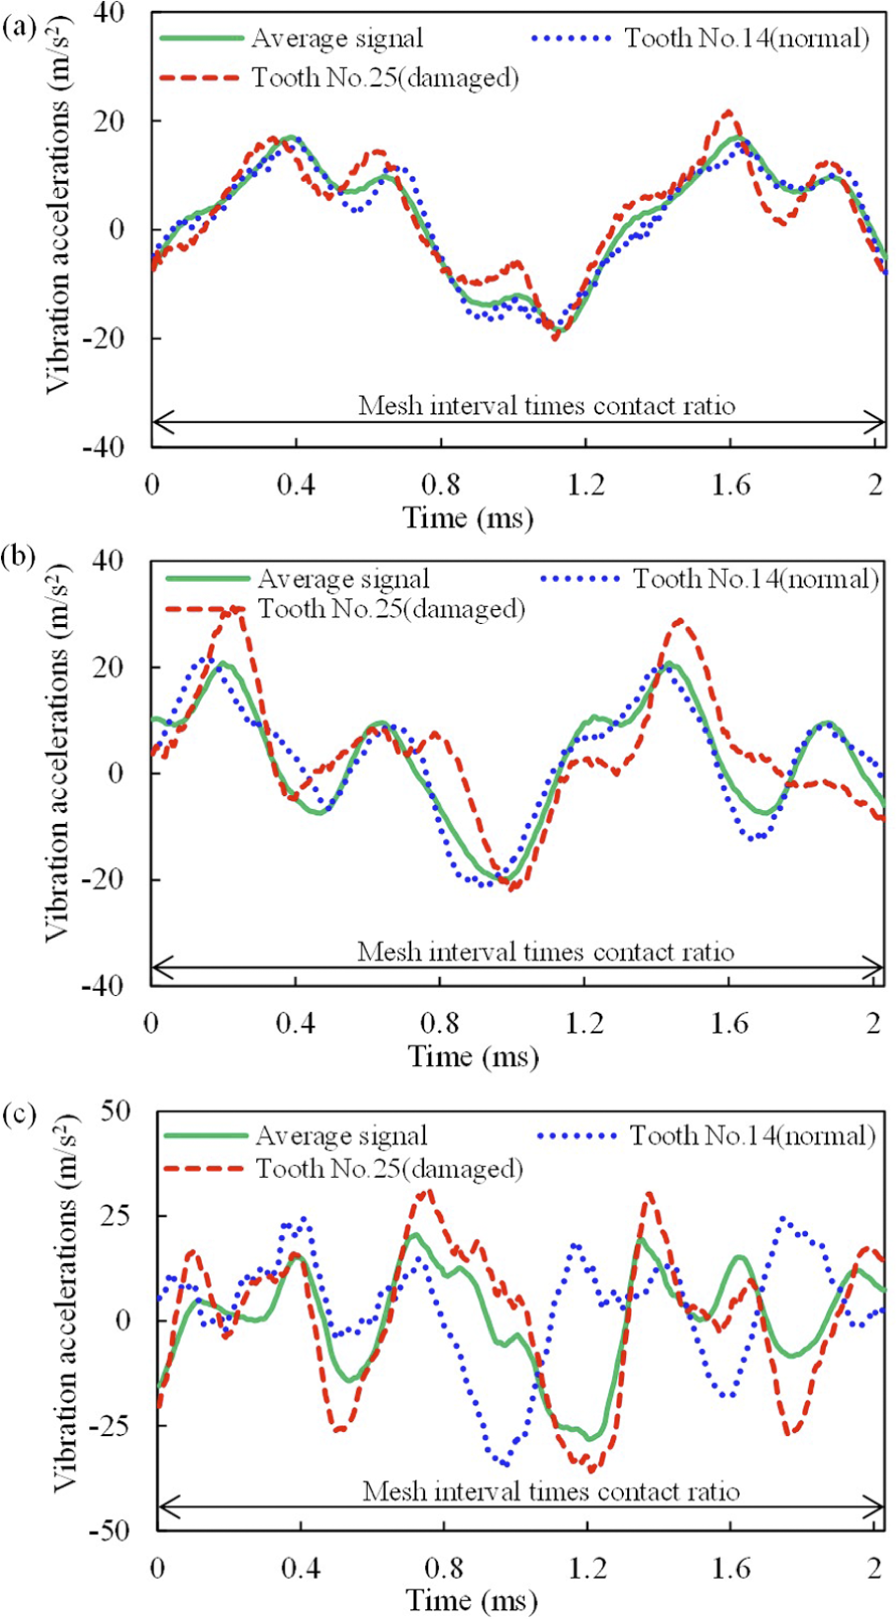
Vibration signal of an individual gear tooth under 25 N·m: (a) normal condition (N = 5 × 10⁴), (b) small failure condition (N = 3 × 10⁶), and (c) serious failure condition (N = 3 × 10⁷).
Figure 7(a) shows the signals of Nos. 14 and 25 teeth and the average signal at N = 5 × 10⁴ revolutions. All the gear teeth are normal. The vibration accelerations of three curves are almost the same. Besides, the waveforms of all the other teeth are almost the same as those shown in Figure 7(a). This result shows that the vibration characteristics of the normal teeth are similar to each other. Figure 7(b) shows the waveforms of Nos. 14 and 25 teeth at N = 3 × 10⁶ revolutions. The conditions of Nos. 14 and 25 teeth are normal and small failure, respectively. The waveform of No. 14 tooth is very close to the average signal. However, the waveform of No. 25 tooth slightly deviated from them. Besides, the vibration acceleration of most of the normal teeth is slightly smaller than that of No. 25 tooth. Figure 7(c) shows the signal acquired at N = 3 × 10⁷ revolutions. No. 19 teeth of the test gear had pitting damage, and Nos. 14 and 25 teeth were normal and serious failure, respectively. This figure shows that the waveform of No. 25 tooth is close to the average signal. However, the waveform of No. 14 tooth deviated from them and is also slightly weaker than that of No. 25 tooth. The waveforms of all the other teeth were also studied. The waveforms of most of the damaged teeth are different from those of the normal teeth.
The figure shows that the vibration accelerations and dispersion degree of the waveform gradually became larger from the normal condition to the serious failure condition. This is because the increased damaged area intensified the vibration of test gear and increased the instability of the signal. Therefore, the difference in tooth waveform could be used for gear damage detection. In addition, the average signal is close to the normal tooth waveform when the gear condition is small failure, whereas it is similar with the waveform of damaged tooth when the gear condition is serious failure. This indicates that some tooth waveform will dominate in the total signal if the number of this type of tooth is more in the test gear. The similarity between the tooth waveform and average signal can also be used to diagnose gear conditions.
Feature parameter extraction
To quantitatively investigate the characteristics of each gear tooth, some feature parameters were calculated using the extracted waveform. The last section shows that the vibration accelerations are different under various tooth conditions. Thus, root mean square (


where S is the signal,
Parameters of revolutions N = 5 × 10⁴, 3 × 10⁶, and 3 × 10⁷ were used as the examples to illustrate the features of different tooth conditions, as shown in Figure 8. In Figure 8(b) and (c), the open mark represents normal tooth, and the solid points show the damaged teeth.

Time-domain features of the signal under 25 N·m on each gear tooth: (a) normal condition (N = 5 × 10⁴), (b) small failure condition (N = 3 × 10⁶), and (c) serious failure condition (N = 3 × 10⁷).
Figure 8(a) shows the feature parameters of normal teeth at 5 × 10⁴ revolutions. The parameter values of all the gear teeth are different, but the difference is small. Besides, the correlation coefficient is almost stable and approximate to one, indicating that all the tooth waveforms are similar to the average signal. Figure 8(b) shows the feature parameters at 3 × 10⁶ revolutions. No. 25 tooth had a small pitting damage. The kurtosis and root mean square of each gear tooth changed slightly, and the value of the other normal teeth was slightly smaller than that of No. 25 tooth. The maximum value clearly changed, and the values of Nos. 25 and 26 teeth were clearly larger than the other teeth. Conversely, the correlation coefficient of No. 25 tooth was smaller than that of the other teeth, indicating that all the waveforms on normal teeth are more similar to the average signal than the waveform on the small damaged tooth. This is because most of the gear teeth were normal under the small damaged condition, and the average signal was more close to the waveform on normal teeth. Figure 8(c) shows the feature parameters of the test gear under the serious failure condition. The damage area ratios of the damaged teeth were 10%, 5%, 10%, 11%, 11%, 10%, 13%,7%, 4%, 10%,11%, 12%, 8%, 3%, 5%, 11%, 15%, 7%, and 9% in the order of solid points in the figure. All the parameter values, especially the kurtosis and maximum value, clearly changed. The parameter values of normal teeth were smaller than most of the damaged teeth. Besides, the correlation efficient of the damaged teeth was relatively larger, indicating that the waveform of the damaged tooth was more close to the average signal. It can be concluded that the average signal is more close to some tooth waveforms when this type of teeth number is more in the test gear. Besides, the waveform and feature parameters are also distinct among each damaged tooth. This is because the damage degree of each gear tooth is different.
As discussed above, the feature parameters of damaged and normal teeth are different. In addition, with the increase in the damage area ratio, the parameter value fluctuates more strongly, and the distinction between the damaged and normal teeth also became more clear. Thus, these parameters can be used to diagnose gear conditions.
The frequency spectrum of the signal also changed with the variation in gear damage. Therefore, the frequency-domain features were also extracted to compare the effectiveness of damage detection with time-domain features. The frequencies of the signal were divided into 10 bands. Then, the spectrum energy of each frequency band was calculated. The total energy was defined as the sum of all the spectrum energies of all the frequency bands. The ratios of the spectrum energy of each frequency band to the total energy were used as the feature parameters. The ratios were calculated as follows


where Esi is the spectrum energy of the ith frequency band, Amj is the frequency amplitude, n is the data number of each frequency band, E is the total energy, m is the number of bands, and
Figure 9 shows the frequency-domain features of one gear tooth under different conditions. When the tooth was normal, the ratios gradually decreased form the first frequency band. When the tooth condition was small failure, the ratio of the third frequency band became larger, whereas the ratio of the first band decreased slightly. Moreover, it is difficult to distinguish the difference in the ratios between the normal and small failure conditions. The ratios clearly changed when the gear condition became serious failure. The ratio of the third frequency band increased significantly. It can be concluded that the high-frequency components become stronger with the increase in gear damage.

Frequency-domain features of the signal under 25 N·m: (a) normal condition (N = 5 × 10⁴), (b) small failure condition (N = 3 × 10⁶), and (c) serious failure condition (N = 3 × 10⁷).
Feature parameter optimization
The above section proved that the extracted feature parameters can be used as the failure feature vector for gear damage diagnosis. Nevertheless, these parameters have different sensitivities to the change in gear damage. It is necessary to optimize the feature vector by recombining all the parameters. The principal component analysis (PCA) method was used in this study to optimize the vector by integrating the properties of each feature parameter into one index.
The transforming algorithm of PCA can be expressed as follows

where
According to the algorithm of PCA, the first several principal components usually contribute >90% effect in the transformed vector. Therefore, the characteristics of the feature vector can be approximately presented by the first several principal components. In the transformed result obtained in this study, the first three principal components occupy 96% contribution of vector
To show the distribution of these samples in the feature space, a three-dimensional space graph was made based on the principal components p1, p2, and p3. The distribution of the test samples at N = 5 × 10⁴, 3 × 10⁶, and 3 × 10⁷ revolutions were selected as typical examples. Figure 10 shows the distribution of the test data in the feature space based on the time-domain features. Figure 10(a) shows the distribution of the test gear teeth under the normal condition. The normal teeth were distributed closely with each other. Figure 10(b) shows the distribution of test data at N = 3 × 10⁶ revolutions. In the figure, the small failure tooth is shown using a triangle, and all the other normal teeth are shown using a square. Most of the normal teeth are clustered together. The small failure tooth and three samples of normal teeth are slightly away from them. Figure 10(c) shows the distribution of the test gear teeth under the serious failure condition. The normal, small failure, and serious failure teeth are shown by a square, triangle, and circle, respectively, in the figure. The distribution of the test teeth is scattered in Figure 10(c). A sample of normal teeth is in the range of small failure teeth. The other normal teeth can be distinguished from the small failure teeth even though the difference is small. The serious failure and normal teeth are clearly separated from each other. However, some samples of serious failure teeth were distributed in the range of small failure teeth. It would be difficult to classify these samples. Compared to the distribution of normal and small failure teeth, the distribution of serious failure teeth was more scattered, consistent with the feature parameter values shown in the last section.

Distribution of test gear tooth data under 25 N·m in the time-domain feature space: (a) test gear at normal condition (N = 5 × 10⁴), (b) test gear at small failure condition (N = 3 × 10⁶), and (c) test gear at serious failure condition (N = 3 × 10⁷).
Figure 11 shows the distribution of the test data in the future space based on the frequency-domain features. As shown in Figure 11(a), the distribution of normal teeth is slightly scattered. In Figure 11(b), the data of small failure tooth can be distinguished from the normal teeth. The data distribution of Figure 11(c) is slightly complicated. Different types of data intermix with each other. It became difficult to classify them clearly. Compared to Figure 10, the data distribution of Figure 11 is slightly more scattered, which may increase the difficulty of classification.

Distribution of test gear tooth data under 25 N·m in the frequency-domain feature space: (a) test gear at normal condition (N = 5 × 10⁴), (b) test gear at small failure condition (N = 3 × 10⁶), and (c) test gear at serious failure condition (N = 3 × 10⁷).
Gear failure diagnosis by SVMs
In this study, because three gear conditions should be classified, two SVM classifiers were constructed by the training data. Then, the built classifiers were used to diagnose the test data and output the diagnostic result. The training dataset was acquired by conducting experiments on other gears, whose conditions also include normal, small failure, and serious failure. The experimental conditions were the same as those of the cyclic fatigue experiment. A total of 60 experimental results were separately acquired under load torques of 25 and 70 N·m to form the training dataset. The experimental results of the cyclic fatigue experiment were used as the test dataset. First, the classifiers were constructed using the training dataset. Then, the training model was used to diagnose the condition of the test data according to the failure feature vector.
Table 3 shows the diagnostic results obtained by applying SVMs to time-domain features. Each tooth status of the test gear was diagnosed using the method. The diagnosis accuracy is a percentage of the correctly diagnosed data divided by the number of test data. 12 The result shows that most of the teeth conditions can be correctly diagnosed using this method. This proves the effectiveness of the proposed method. The diagnosis accuracy acquired under 25 N·m load was almost the same as that acquired under 70 N·m load. This is because the training dataset was also acquired under 25 and 70 N·m loads. Our previous studies 24 showed that the load torque and rotation speed will affect the vibration accelerations and feature parameters, thus reducing the robustness of the proposed method. How to reduce the effect of load torque and rotation speed on the extracted features is a problem in our study now. In the future, we will focus on increasing the robustness of the proposed method by reducing the influence of load torque and rotation speed on the features.
Diagnostic result by applying support vector machines to time-domain features.

Table 4 shows the diagnostic results obtained by applying SVMs to the frequency-domain features. Most of the tooth condition can also be correctly diagnosed by the frequency-domain features. However, compared to the diagnostic result shown in Table 3, the accuracy shown in Table 4 is slightly lower, indicating that the time-domain features provide a better classification performance.
Diagnostic result by applying support vector machines to frequency-domain features.

The detailed diagnostic results of some test data selected from the result of 25 N·m load in Table 3 are shown in Table 5. In the diagnostic result of 5 × 10⁴ revolutions, all the teeth conditions were diagnosed accurately. In the diagnostic result of the test data at N = 3 × 10⁶ revolutions, the small failure tooth was correctly detected. However, Nos. 4, 9, and 26 normal teeth were misdiagnosed as small failure tooth. As shown in previous sections, the vibration accelerations and feature parameters of these teeth are almost the same as those of small failure tooth. Besides, in the distribution of the test data in the feature space shown in Figure 10, three normal teeth are separated from the other normal teeth, consistent with the diagnostic result. This is because some normal teeth surfaces also begin to deteriorate after a long running time. The vibration acceleration and feature parameters of these teeth are slightly larger. Thus, the condition will be probably misclassified as small failure. In addition, the meshing process of Nos. 25 and 26 teeth is continuous, and No. 26 tooth would be more easily misdiagnosed because of the effect of No. 25 damaged tooth. In the diagnostic result of N = 3 × 10⁷ revolutions, all the damaged teeth were detected. No. 15 normal tooth was misclassified as small failure. Figures 8(c) and 10(c) show that the parameter value and feature distribution of No. 15 tooth are almost the same as those of small failure teeth. In addition, Nos. 9, 19, and 26 serious failure teeth were also misdiagnosed as small failure teeth. The damage area ratios of the three teeth were 7%, 8%, and 7%, respectively. Although the condition of these teeth was defined as serious failure, their vibration features and parameter values are almost the same as those of small failure teeth, because the damage area of these teeth is small. Thus, Nos. 9, 19, and 26 serious failure teeth would be misclassified as small failure teeth.
Detailed diagnostic results by applying support vector machines to time-domain features under load 25 N·m.

Nor: normal condition; Sma: small failure condition; Ser: serious failure condition
Misclassified data.
In the result, almost all the damaged teeth were correctly detected by the proposed method, even though some misdiagnosis cases were observed in identifying the degree of damage. Therefore, how to improve the capability of the proposed method in classifying the degree of damage is our study objective in the future.
Conclusion
This study developed a gear damage detection and localization approach by analyzing the vibration signal of an individual tooth and SVMs. The waveform of an individual gear tooth was studied to investigate the characteristics of gear tooth under normal, small failure, and serious failure conditions. The dispersion degree and vibration accelerations of the tooth waveform are different under various gear tooth conditions. Compared to the total signal, the difference in the vibration features between the damaged and normal teeth became more clear in the waveform of an individual gear tooth. Besides, the extracted feature parameters are also different when the tooth condition changes; this can be used for diagnosing gear conditions.
The method was used to analyze the experimental results of a cyclic fatigue experiment under different loads. Gear tooth condition was classified by SVMs. The diagnostic results with time-domain feature extraction and those with frequency-domain feature extraction was compared. This shows that the time-domain features provide a better classification performance. Almost all the damaged teeth were correctly detected using the proposed method, even though some misdiagnosis cases were observed in identifying the degree of damage. Therefore, how to improve the robustness and capability of the proposed method in classifying the degree of damage is our future study objective.
Footnotes
Appendix 1
Academic Editor: Mario L Ferrari
Declaration of conflicting interests
The author(s) declared no potential conflicts of interest with respect to the research, authorship, and/or publication of this article.
Funding
The author(s) received no financial support for the research, authorship, and/or publication of this article.