
Abstract
Geomagnetically induced currents through the transformer windings produce biases of transformers, increase transformer reactive power losses, and lead to a significant lack of reactive power support in the power system. As a result, the geomagnetically induced currents cause voltage fluctuations and affect the safe and stable operation of the power network. This study focuses on the problem of multi-objective reactive power optimization strategy to mitigate the negative effects of geomagnetically induced current on the power network. Using the stochastic response surface method, this article establishes a model of the probabilistic power flow calculation, combines a particle swarm optimization algorithm based on the niche chaotic mutation, and sets up a multi-objective reactive power optimization model. The introducing of chaos mutation avoids the result falling into a local optimal solution and improves the global search ability. The geomagnetically induced current–benchmark simulation verified the accuracy and effectiveness of the model and algorithm, and proved that the strategy can effectively reduce the voltage deviation caused by the geomagnetically induced current.
Keywords
Introduction
Solar storms caused by violent outburst of explosive activities on the sun may lead to geomagnetic disturbances (GMDs). GMDs cause geomagnetically induced currents (GICs) flowing through long-distance transmission lines, transformer neutral groundings, and the earth. 1 GICs cause transformer magnetic flux saturation, lead to transformer heating, increase in transformer reactive power demand, and harmonics. A severe GIC may lead to transformer damage or a power grid blackout. 2 After the Quebec blackout caused by a GMD in 1989, PR Barnes pointed out that the blackout was caused by two factors: (1) GIC caused the increase in transformer reactive power demand and (2) the existence of the harmonics forced the capacitor banks to drop out, which caused a voltage collapse triggered by the reactive power imbalance. 3 With the monitoring data at a 345/115-kV transformer during a GMD on 10 May 1992, Electric Power Research Institute (EPRI) in the United States showed that the transformer reactive power demand caused by the GIC (GIC-Q for short) is significant. 4 GMDs occur approximately at the same time in the global context; therefore, the GIC-Q has characteristics such as cut-in clusters and abruptness. Because the number of power transformers is large, the total amount of the GIC-Q will be large enough to cause power system voltage instability issues or large-scale voltage collapse. 5
After the Quebec blackout, many countries conducted research to determine the numerical
relationship of the GIC-Q. The mechanism of transformer
GIC-Q was revealed comparatively early by R Pirjola.
6
J Berge
7
described the linear
relationship of the GIC-Q by means of experimental simulation and field
data. Marti et al.
8
deduced the linear relationship between the GIC-Q through effective
susceptance. Liu et al.
9
calculated the numerical relations of the GIC-Q using the
V – I curves provided by the transformer manufacturers
and the
In recent years, with the development of power system, many GMD issues were identified in the mid-low latitude area including South Africa, Brazil, Japan, China, and some other places.10–14 GMDs are natural phenomenon and happen from time to time. The continuous expansion of the power grid in China, especially the large-scale construction of ultra-high-voltage (UHV) power grid and the use of single-phase autotransformers, will increase the probability of GIC events, and thereby cause the grid GIC-Q having a wider effective range and a stronger influence.15,16 Therefore, the power company must not only take reasonable defensive measures against GMD but also study the mitigating schemes for GIC-Q. Neutral point blocking devices can effectively reduce the reactive power demand caused by the GIC,17,18 but their impacts on power system stability still need further research. Making full use of the existing reactive power compensation equipment, reasonable allocation of the blocking devices and optimization of the scheduling are all feasible defensive safeguards against the GMD.
However, a precondition is to forecast accurately the solar storms for defending GIC-Q through the effective scheduling. For this reason, since 1989, when the solar storm caused the Quebec power grid blackout, the solar storm forecasting has gained great importance. 19 The Advanced Composition Explorer (ACE) satellite, launched in August 1997, is designed to monitor the solar storms at the sun–earth gravitational equilibrium point. It can predict the occurrence of the magnetic storms 15–60 mins in advance, and promptly remind the power company to attract attention, so that it provides a protection for the power grid from the space weather disaster. 20
For the target of the minimum expectations of the offset voltage and reactive power compensation capacity, by considering the uncertainty of the GIC-Q, this article proposes a reactive power optimization strategy, which is the combination of the stochastic response surface method (SRSM) and multi-objective particle swarm optimization (MOPSO) algorithm based on niche chaotic mutation. Simulation results with GIC standard examples show the practicability and validity of the method.
The rest of this article is organized as follows. After a general description of the calculation method of the GIC and GIC-Q in section “GIC-Q modeling,” and the establishment of a probabilistic power flow calculation model for the case of considering the effect of GIC-Q in section “Probability trend model based on SRSM,” the multi-objective reactive power optimization algorithms are presented in section “Multi-objective optimization algorithm,” and a standard numerical simulation analysis of GIC is presented in section “Example analysis.” Finally, section “Conclusion” summarizes the article.
GIC-Q modeling
Primarily, there are two risks associated with GIC in the power system. The first is the transformer’s permanent damage, primarily the high-voltage (HV) transformers. The second is the demand of reactive power support leading to the potential frisk of a voltage collapse. This article focuses on the second risk. The main problem of reactive power demand caused by the GIC represents a significant threat to the power grid. Considering the GIC-Q is of great significance for the study of reactive power optimization.
GIC modeling
Since the current system of magnetosphere, ionosphere, is complex, using deep magnetotelluric survey data, establishing equivalence earth resistivity model, and calculating inductively field are common methods. Simultaneously, the feature of the ionospheric current direction is not obvious in the mid-low latitude. The electric field may occur at any direction. For this reason, without accurate earth electrical and structural data, we can select the electric field of 1 V/km to compute GIC. So, the transmission line equivalent to DC voltage Uij is only related to the location of line ends

where EN/EE is the North/East component of the electric field, respectively (V/km), and LN/LE is the North/East distance of the line between the two end points, respectively (km).
The equivalent node is obtained by the line-induced DC voltage Uij, and the node is injected with a DC current source. Furthermore, with the DC network parameters of the components including transmission lines, transformer windings, and the ground resistance of the substations, the GIC in each branch of the network can be calculated from the network node voltage. The detailed calculation can be seen in Zheng et al. 21
Equivalent GIC calculation of a transformer
The path of GIC is represented as a DC network which consisted of the transmission lines, transformer windings, and the ground grid of the substations. Thus, a DC model of the transformer is needed to study for GIC calculation. The corresponding transformers can be generally categorized as autotransformers and step up/down transformer which are divided into two types, YN0-YN0 and YN0-D; their DC models are illustrated in Figure 1.

DC model of an (a) autotransformer, (b) step up/down (YN0-YN0), and (c) step up/down (YN0-D) transformers.
In the case of autotransformers shown in Figure 1(a), the HV and low-voltage (LV) terminals of the transformer are electrically connected through the series winding, featuring the DC resistance RS. The path to the ground is provided through the common winding of the autotransformer, with the DC resistance denoted by RC. The two windings are the flow paths of the GIC.
During the period of the GMD, the flow path of the GIC is different between the series winding and common winding of an autotransformer. The equivalent GIC is

Namely

where Ieff is the equivalent GIC, IS is the GIC flowing into the series winding, IC is the GIC flowing into the common winding, N = VH/VL, and VH and VL are the terminal voltages of HV side and LV side, respectively.
In the case of a YN0-YN0 transformer shown in Figure 1(b), the GICs will flow in two windings. The same equivalent GIC flowing into the transformer is
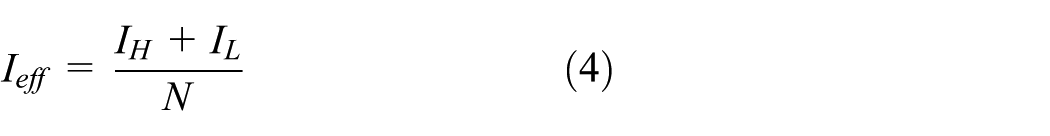
where IH and IL are the GIC flowing into HV winding and LV winding through the DC resistance RHV and RLV, respectively, and N is the same as in equation (3).
In the case of a YN0-D transformer shown in Figure 1(c), the HV and LV windings are separate, and only the HV winding is modeled. The reason is that the LV winding can be ungrounded. In this case, the effective GIC of the transformer winding is one-third of the GIC through the transformer’s neutral point.
GIC-Q modeling
The reactive power demand of a transformer caused by GIC is calculated based on the method in Dong et al. 7 and Rezaei-Zare 22 which is

where K is the GIC’s reactive loss coefficient obtained from experimental testing with the unit of MVar/A; the coefficients K = [1.8, 1.18, 0.33, 0.29, 0.66] correspond to a single-phase autotransformer, single-phase-transformer group, three-phase shell-type transformer, three-phase three-column core transformer, and three-phase five-column transformer, respectively; and UPU is the per-unit voltage at the transformer’s terminal.
Voltage fluctuation theory caused by geomagnetic storm
Figure 2 shows the two-node system which forms a DC network model to calculate GIC, where Vi and Vj are, respectively, both ends of the transmission line voltage; Udc is the DC line-induced voltage caused by the GMD; Rdc is the DC resistance of the line; RS/RC are, respectively, autotransformer series winding and common winding DC resistance; and Rg is the transformer’s neutral grounding DC resistance.

Diagram of the two-node network.
Taken

where node j are, respectively, injected active and reactive power by
Pj and Qj; QCj is
the charging reactive power of the line; X is the line reactance; and

Therefore, under the condition that the transmission power and parameters of the line are unchanged, the voltage drop during storms is only related to QGIC.
Probability trend model based on SRSM
GIC is quasi-DC with characteristics of deep penetration into the earth, however, to obtain the earth’s accurate conductivity over the large scope and depth of 400–500 km is quite difficult. Different land areas have different values of electrical conductivity. Currently, there is still a lack of accurate ground conductivity model, so that it is difficult to accurately calculate the induced electric field caused by the geomagnetic storm and GIC in the power grid. In this situation, the calculation results of the reactive power losses of transformers caused by the GIC must have some uncertainty. There is a deviation in the voltage distribution calculation which makes it not a good guide to the actual power network operation. Therefore, it is necessary to use the probability method to calculate the voltage distribution caused by the magnetic storm, so that the calculation results can be better to guide the practice. In this article, the SRSM is used to model the probability flow.
The SRSM is a typical method to analyze the uncertainty, whose basic principle is that the probability distribution of an n-dimensional random variable is mapped to a Hermite chaos polynomial of known parameters. By selecting a few typical samples to determine the undetermined coefficients of the polynomial, the probability distribution of the output response is achieved.
In terms of the uncertainty of reactive power demand of the transformer caused by a GMD, there is still no detailed model of the probability distribution. Consequently, this article uses a normal distribution probability model to describe the GIC-Q uncertainty existing in the calculation process. For node i, the GIC-Q is called QGICi, and the probability density function is
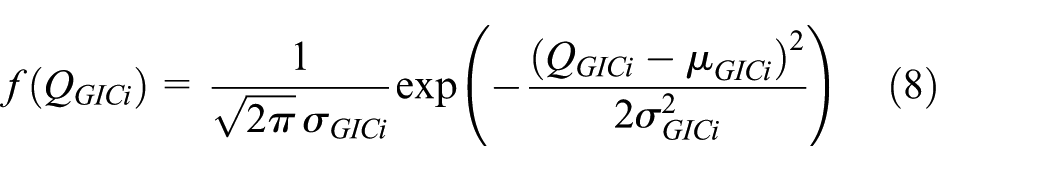
where
The GIC-Q is noted as the uncertain parameter X, and the
solutions of the power flow calculation are recorded as output response Y
of the system. N random input variables

where F(X) is the distribution function of x.
The requirements of the SRSM are not only that the random input variables are independent of each other but also that they must obey the same standard distribution. Hence, this study switches the input random variables to random variables obeying the standard normal distribution.
The different distributions of the random variables are represented as

where

where n is the number of variables, and

The calculation formula of an m-order, n-dimensional Hermite polynomial is
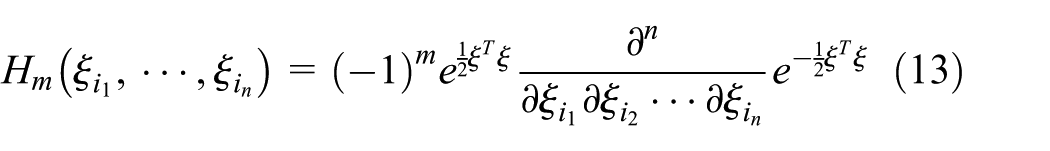
When the order number of the Hermite polynomial is higher, the simulation accuracy of the output response Y is better. At the same time, the number of undetermined coefficients needed to confirm is greater. The measured results show that when m = 2, the fitting precision of a second-order Hermite polynomial can meet the requirements. Therefore, this study uses second-order polynomial chaos

The process is as follows. Select the configuration points of

Flowchart of the collocation points selection method.
This process is as follows: calculate the response values of the configuration points based on the configuration points obtained through the power flow calculation model; in turn, determine the undetermined coefficients of the Hermite polynomial by solving the linear system of equations; and finally, the probability distributions of all variables are obtained according to the combination of the Hermite polynomial and the power flow equation. The equations of n nodes are as follows

Because of assuming a uniform geoelectric field, we can determine the reactive power demand value of each transformer and set it to be a PQ node in the power flow calculation.
Multi-objective optimization algorithm
Because of the uncertainty of GIC-Q, this study uses the SRSM to describe the output response as a probability distribution function. Then, we combine the MOPSO algorithm to make the reactive power optimization process closer to actual operation and improve the adaptability and reliability of the optimized scheme under the GMD.
Multi-objective optimization problem
The multi-objective optimization problem can be defined as
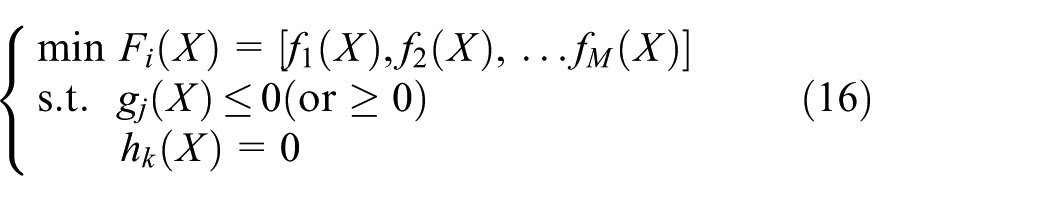
where
Several definitions associated with this discussion are given below.
Definition 1
Pareto dominance: there are two feasible solutions, which are
x1 and x2, considering
x1 dominates x2 to meet all
Definition 2
The optimal solution of Pareto, a solution that exists,

Definition 3
The optimal solution set and cutting edge of Pareto. All sets of Pareto solutions are referred to as the Pareto optimal solution set. Namely

The area formed by all the Pareto optimal solutions corresponding to the objective function value is referred to as the Pareto frontier or equilibrium surface.
In this study, the GIC-Q is used as the research object. Under the condition where the structure and capacity of the grid have been defined, this study makes full use of the existing adjustable reactive power output of generator and on-load voltage regulating transformer, and at the same time, collocates reactive power compensation equipment at appropriate nodes to deal with voltage fluctuations caused by the GIC-Q to ensure the safe and stable operation of the power system under the GMD. The objective functions and constraint functions of the multi-objective are as follows.
1. Objective function
For the target of the minimum cost of the node voltage deviation and reactive power compensation equipment, this article sets up the multi-objective reactive power optimization function considering the influence of GIC

where
2. Constraint condition
The constraint condition is namely the power flow equation in the process of the probabilistic power flow calculation

The control variable range constraints are
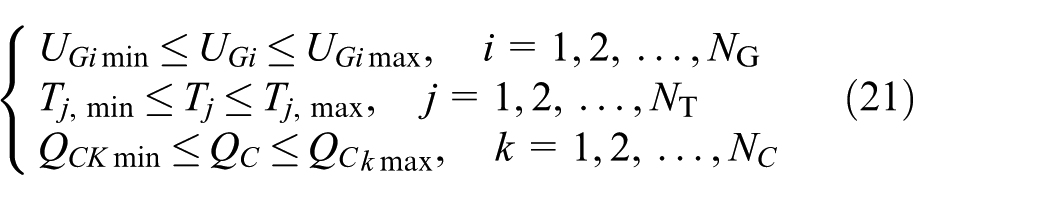
The state variable range constraints are

where
Particle swarm optimization algorithm
The particle swarm optimization (PSO) algorithm was first proposed by Kennedy. It is a calculation method based on swarm intelligence evolution. The basic principle is searching the optimal solution through iteration. At each iteration, particles tracking individual optimal positions (Pbest) and the global optimal position (Gbest) update themselves. The speed and position formulas of the particles named i in the kth iteration and the first d components are


where
Niche chaotic mutation MOPSO algorithm
Because the PSO algorithm has the disadvantages of precocious phenomena and late convergence speed, this article proposes MOPSO 24 by considering the niche chaotic mutation.
The niche algorithm forms a niche for each particle based on the distance between the particles. They become a particle swarm, and then a particle swarm algorithm is used for each particle group to update the speed and position values. The updated particle swarm uses the sharing mechanism to improve fitness of the particles, and ensure optimization of the group.
To save the Pareto optimal solution which is found in the process of evolution, an external pre-strike technology is established in the process of iteration to adjust the external archive and improve the computational efficiency. This study uses the crowded distance sorting archived external set of particles. 25
The distance between the particles and the fitness is determined according to the following equations. The distance between the particles is
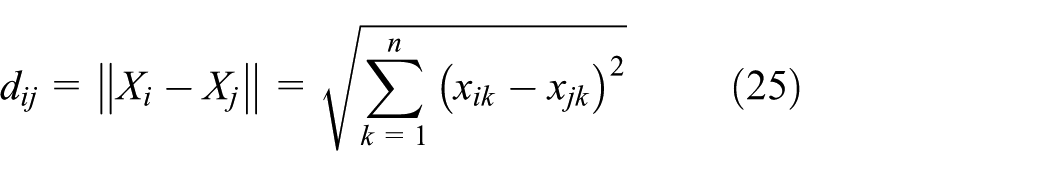
where
Fitness is

where

where
A too fast convergence speed will make the MOPSO algorithm to search for a local optimum, which is the Pareto optimal frontier instead of the global optimal frontier. For this reason, the chaotic mutation is brought in MOPSO in this study, which generates a chaotic disturbance for the current particle to return the best individual and to bring the solution out of the local extremum interval. Here, the chaotic mutation mapping logistic iterative formula is given by

where k is the number of iterations;
Flowchart of the niche chaotic mutation MOPSO is shown in Figure 4.
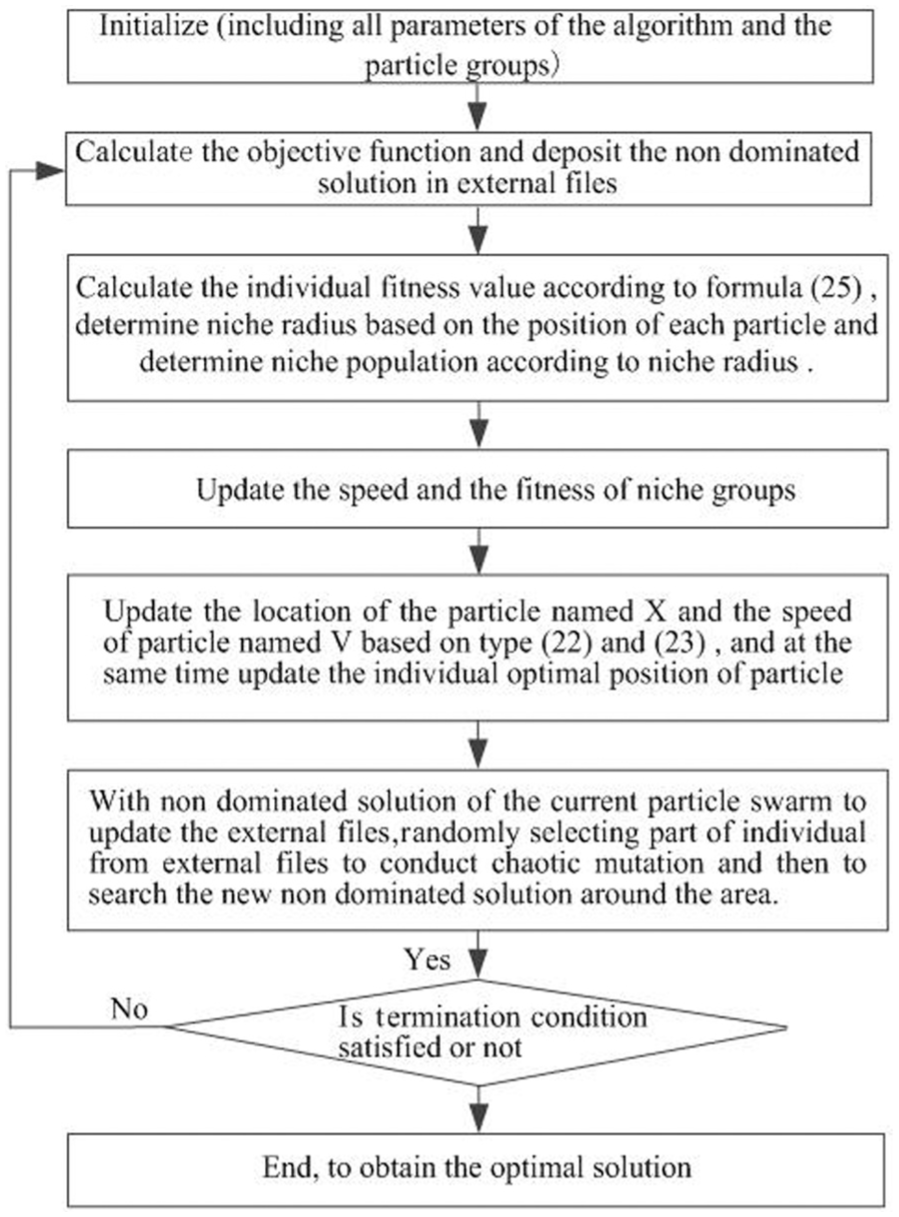
Flowchart of the niche chaotic mutation MOPSO.
Example analysis
Example overview
The simulation calculation of this study uses a GIC standard test system, as shown in Figure 5.
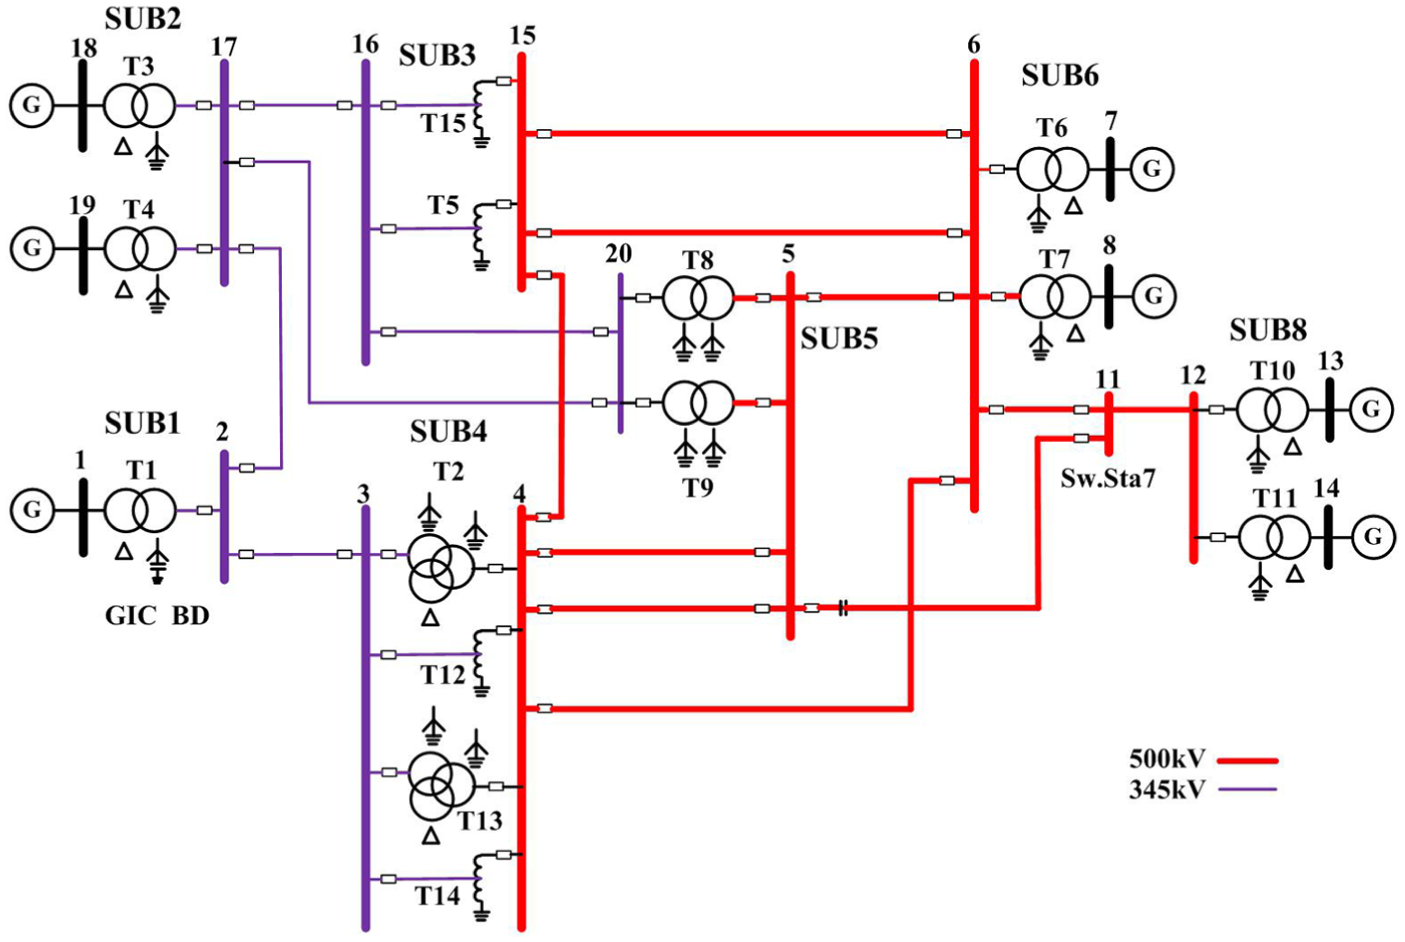
Diagram of the GIC-benchmark case.
The system includes buses, generators, switching stations, transmission lines, and transformers in the quantities of 18, 7, 1, 15, and 15, respectively. Bus 1 is selected as a balancing bus, the load of which is 4700 MW+1800 MVar; other parameters can be found in Pirjola 26 and Liu and Wu. 27
GIC-Q calculation
In the simulation, GMD caused by the solar activity impacts the current systems in the mid-low-latitude ionosphere. At present, no research has yet proven the direction characteristics of the current systems of the mid-low-latitude ionosphere. It is thought that the geoelectric fields at the mid-low-latitude levels are 1 V/km and can occur in any direction. 28
The GICs through the transformer windings and transmission lines are calculated for
directions

GIC at high-voltage winding for different directions of geoelectric fields.
According to the basic principle of GIC calculation and the calculation results of Figure 6, the direction of the electric field between [0°, 360°] of GIC is a 180° symmetry, which means the magnitude of GIC is equal and the polarity of GIC is opposite. The loss value of GIC-Q is related only to the magnitude of the GIC and is not related to polarity. For this reason, while calculating the value of GIC-Q, we considered the direction of the electric field between [0°, 180°]. The calculation results are shown in Figure 7.

GIC-Q losses for different directions of geoelectric fields.
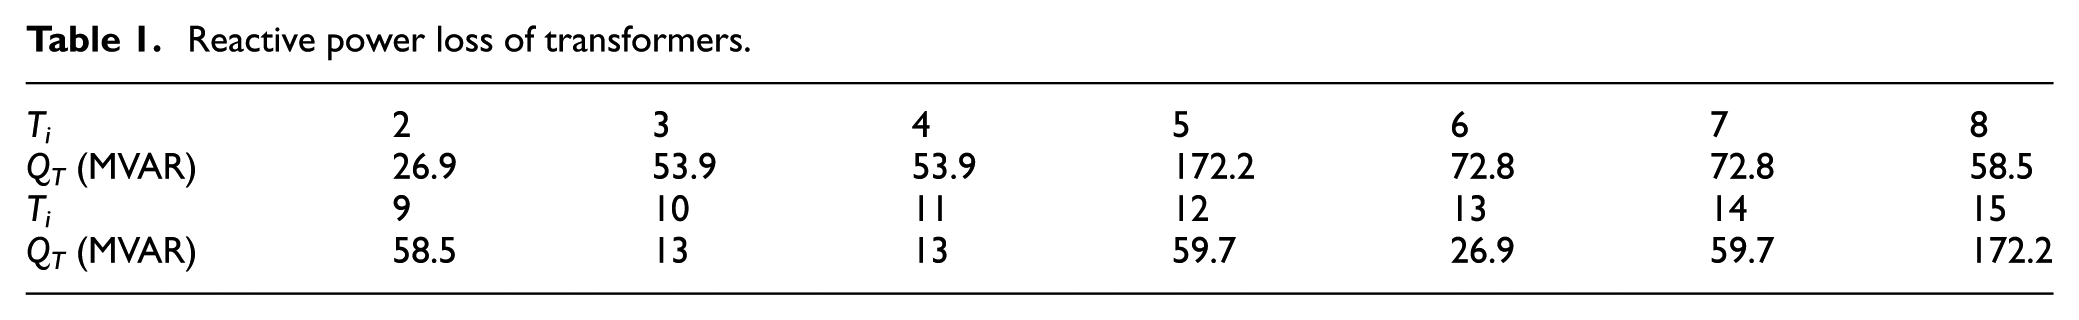
It is known by the calculation that the GIC-Q achieves a maximum value of 914 MVar with the direction of geoelectric fields at 135°. The reactive power loss of each transformer is illustrated in Table 1.
Reactive power loss of transformers.
With the calculated value of GIC-Q at each transformer in Table 1 as the mean value, 10% of the mean value as the standard deviation, and the uncertainty of GIC-Q described by the normal distribution function, the specific expression is shown in equation (6).
Figure 8 shows the voltage cumulative distribution function of node-20 through the SRSM and Monte Carlo method (MCM).

Cumulative distribution function of the node-20 voltage amplitude.
Figure 8 shows that the cumulative distribution function obtained through the SRSM is the same as that obtained with the MCM. However, the computing speed and precision of the SRSM are superior, thus verifying the effectiveness of the SRSM.
Consequently, the limit probability value of each node voltage below 0.95 pu can be obtained using the SRSM probability flow model proposed in this article, which is shown in Table 2.
Low-voltage limit probability (%) of the node.

It is seen from Table 2 that under the effect of a uniform geoelectric field of 1 V/km, the limit risk of nodes 4, 15, and 20 is up to 100%, which seriously threatens the safe and stable operation of the power grid, and therefore, the reactive power must be optimized.
Multi-objective optimization calculation
The process of this calculation is as follows: ensure the largest reactive power output of the existing generator and the largest adjustment range of the on-load regulating transformer; select nodes 4, 15, and 20 of the risk of the low-pressure limit to the parallel capacitor group; and proceed with reasonable reactive power optimization to make each node voltage within a reasonable range and ensure the safe and stable operation of power grid.
In this study, we use the SRSM method to establish the probability calculation model of reactive power optimization. The node voltage offset and reactive power compensation equipment’s minimum cost are the optimization goals. Pareto optimal solutions of these two targets are obtained through niche chaotic MOPSO.
Parameter settings of the niche chaotic MOPSO algorithm are as follows: inertia weight,
To illustrate the effectiveness of the optimization algorithm in this study to increase the solution of niche MOPSO and MOPSO, with the largest number of iterations as calculation termination conditions, the convergence process and convergence speed of the three types of algorithms are compared, as shown in Figure 9.
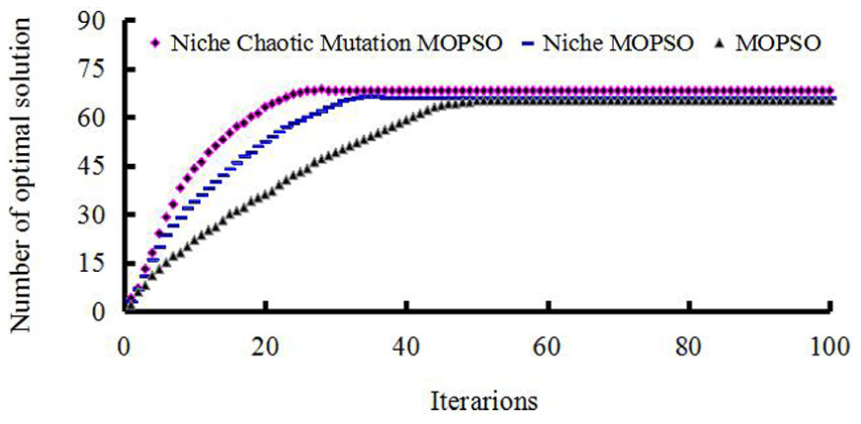
Diagram of the iteration convergence.
It is shown in Figure 9 that the rate of convergence of the early stage of the iterations and the number of optimal solution searches of the niche chaotic mutation MOPSO are significantly faster and more than niche MOPSO and MOPSO, respectively. The individual number of Pareto optimal solution sets has reached the upper limit when the iteration is 27 and realizes the algorithm convergence. Niche MOPSO and MOPSO, respectively, realized the algorithm convergence when the iterations were 38 and 44, respectively. By contrast, the search ability and search speed of the algorithm proposed in this article are higher than niche MOPSO and MOPSO.
The target is the minimum expectations of offset voltage and reactive power compensation capacity, using niche chaotic MOPSO to calculate the Pareto frontier optimal solution set, which is shown in Figure 10.

Diagram of the distribution of Pareto optimal solution set.
It is shown in Figure 10 that the optimal solution set is searched by the niche chaotic MOPSO, which forms the optimal solution of multiple optimization objectives in different situations. It is also known by the calculation that the optimal compromise solution of niche chaotic MOPSO is 3.67 pu and 960 MVar. The optimal solution of the optimization of the proceeds is that nodes 4, 15, and 20, respectively, input capacitor banks whose capacities are 210, 350, and 400 MVar. After the reactive power compensation optimization, node 20, whose voltage expectation is 0.964 pu, and its limited risk increase by 44.15%.
Conclusion
Using an uniform electric field of 1 V/km, this study calculated the GIC-Q of GIC-benchmark case in the direction of the electric field between [0°, 180°] with a 5° increment. The calculation results show that the GIC-Q reaches a maximum value of 914 MVar when the direction of the electric field is 135°. Such reactive power loss will inevitably cause a power grid reactive power shortage. For this reason, the reactive power compensation equipment should be reasonably collocated in the power grid and optimized.
Considering the uncertainty of GIC-Q of the power grid, this study set up a power system probabilistic power flow calculation model including the GIC-Q using the SRSM. The calculated results were compared with the MCM, showing that the SRSM used to address the uncertain random issue remains the same level as the MCM, but has the advantages of high precision and fast computing speed.
With the minimum expectations of the offset voltage and reactive power compensation capacity as the targets, this study established a multi-objective reactive power optimization calculation model and then solved the reactive power optimization model through the niche chaotic MOPSO algorithm. The example calculation results show that the convergence rate of the proposed method is faster and the optimal solution set searched is closer to the optimal frontier of ideal Pareto; thus, it has better optimization performance. The optimal compromise solution given by the niche chaotic MOPSO algorithm provided a reactive power optimization configuration that can improve the grid voltage dramatically and ensure the safe and stable operation of power grid under the GMD.
Footnotes
Academic Editor: ZW Zhong
Declaration of conflicting interests
The author(s) declared no potential conflicts of interest with respect to the research, authorship, and/or publication of this article.
Funding
The author(s) received no financial support for the research, authorship, and/or publication of this article.