
Abstract
Traffic congestion has been a challenging problem in urban areas during rush hours. Transit priority (especially transit signal priority) strategy can provide smooth flow for decreasing travel times, stops, and delay. However, on urban arterials, the performance of transit signal priority scenario along arterial corridors of urban traffic network is primarily affected by coordinated signal control strategy. This article proposes a transit signal priority green duration optimization model considering passengers traveling delay at intersections and bus stops, and then the optimized transit signal priority phase plan considering arterial coordinated signal control is addressed. Consequently, the proposed method is evaluated using a VISSIM model calibrated with field traffic volume and traffic signal data of Qingliangmen-Bridge community in Nanjing, China. Comparing with the non-transit signal priority scenario, the optimized transit signal priority–based phasing plans result in the reduced delay at intersections and bus service stops. The evaluation results illustrate the promising performance of the proposed transit signal priority optimization method considering arterial coordinated signal control in reducing the passenger delay for urban traffic network during rush hours.
Keywords
Introduction
To handle the challenge of severe traffic congestion in the urban area during rush hours, high occupancy vehicle (especially transit vehicles) priority strategy is implemented to carry larger numbers of passengers efficiently. 1 However, the performance of transit vehicles priority is usually limited in some bottleneck areas (such as intersections and bus stops) of traffic networks. Previous experience has shown that transit signal priority (TSP) control can improve traffic operation in urban areas when compared to traditional signal control strategies.
W Smith 2 and colleagues were among the first to conduct bus preemption experiments to reduce bus travel time. In the early periods, most studies focused on TSP system optimization within traditional fixed-time traffic signal control systems for bus delay reductions and negative traffic impacts. Then, the signal priority procedure for optimization in real-time (SPPORT) model was created and evaluated specifically with the target of explicitly considering the unique nature of transit vehicles and the interference caused to the general traffic by transit vehicles.3,4 A number of improved real-time, traffic-responsive TSP optimization models and control systems are developed and proposed for enhancing overall system operation efficiency, 5 improving transit traveling reliability, 6 and minimizing the impacts on other vehicular traffic7,8 of isolated intersection,9,10 bus stop-to-stop segment, 11 arterial progression, 12 and coordinated network. 13 Besides that, transit operation characteristics such as bus stop dwell time (DT)14,15 and transit vehicle arrival distribution 16 are also considered for establishing TSP optimization model with high-level performance and reliability. These previous studies have focused primarily on TSP optimization models examining the interaction between general vehicles and transit vehicles in urban areas (intersections, arterial corridors, and network). However, the strategies of arterial coordinated signal control and TSP are usually implemented on arterial roadways simultaneously, and the optimization model considering the influence of arterial coordinated signal control should be paid more attention. Moreover, the effect of transit vehicles’ real-time movement characteristics at transit routes (especially at bus service stops) to TSP control system optimization needs further development.
The research in this article developed a TSP green duration optimization model considering both the passenger delay (PD) at intersections and bus service stops. Then the optimized TSP phase plan considering arterial coordinated signal control is proposed. A VISSIM-based simulation platform is established for analyzing and testing the performance of the optimized TSP program. The simulation is calibrated by field traffic flow, signal, and bus stops data of urban network including two commuting arterial corridors in Nanjing, China.
This article is organized as follows. In section “Methodology,” the control units of urban traffic network are classified into two categories (intersections with and without downstream service stop), and the TSP plans of intersections are developed regarding TSP green duration optimization model and phase allocation method under arterial coordinated signal control scenarios. Section “Case study” is the field data–based analysis, calibration, and evaluation of the proposed TSP optimization scenarios. The TSP optimization plans of the test area are generated, and the performance is analyzed and simulated by VISSIM-based simulation platform. In the end, conclusions and recommendations are included.
Methodology
For minimizing passenger traveling delay in urban traffic network under arterial coordinated signal control condition, the TSP optimization method is developed for improving the TSP system operation efficiency. The flowchart of TSP optimization method is shown in Figure 1, and the process of this methodology is divided into control unit division phase, TSP strategy optimization phase, and arterial coordinated signal control phase. The details are summarized in the following description.

Flowchart of the methodology.
TSP control unit division
The control units are classified into two categories (illustrated in Figure 2): Control Unit Type 1 and Control Unit Type 2. Control Unit Type 1 means the isolated intersection, and Control Unit Type 2 involves the intersection with a downstream stop.

Visualization of the control units.
TSP timing plan optimization
TSP green duration optimization
In this article, we use passengers’ total traveling delay as the optimized index. And minimized passengers’ total traveling delay in control units of traffic network is chosen as the optimized target. The proposed TSP timing optimization model is described in equation (1). For Control Unit Type 1, total passenger delay (
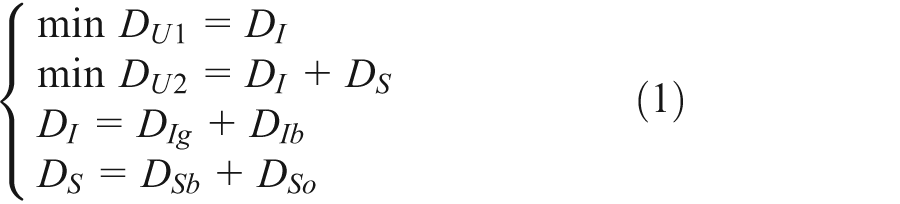
where
PD at intersection
Considering the degree of saturation pattern for urban traffic network, delay formula cited from Highway Capacity Manual (1985) is chosen for calculating the average delay of vehicles. The average delay for general vehicles in phase

where
The formula for the total passenger delay of general vehicles at one intersection is addressed as follows

where
For TSP buses, the average delay at one signalized intersection is illustrated in equation (4)

where
The formula for the total passenger delay of transit vehicles for TSP phase at one intersection is addressed as follows
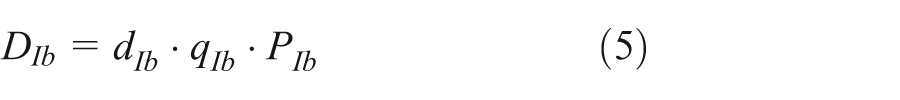
where
PD at bus stop
Passengers’ traveling delay at transit service station includes travelers’ waiting delay on buses and at the bus stop. Based on the trajectory data of transit vehicles (as shown in Figure 3), traffic delay (of passengers on buses) at bus service station can be analyzed.

Time-space trajectory diagram of buses.
The delay of travelers on buses at bus stops (

where
Figure 4 illustrates the waiting delay patterns of passengers at bus stop bay for different transit arrival rates. Figure 4(a) and (b) shows normalized and overflow situation of the bus stop. The normalized condition means that the arrival transits can load and unload passengers without waiting for entering berths, while overflow situation means some arrival buses need to wait for serving passengers because the berths are filled fully with the former arrival buses.
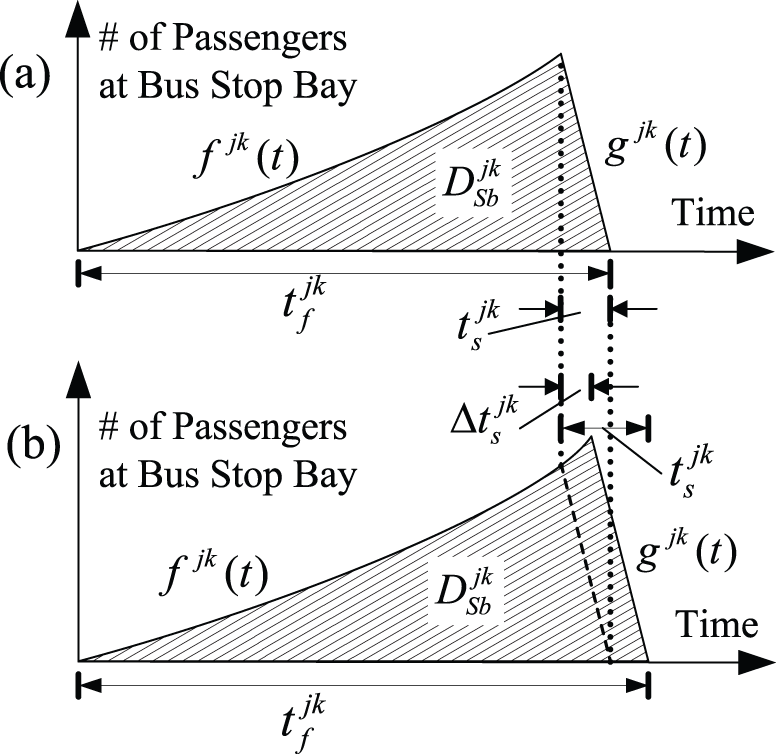
Illustrative passenger arrival and boarding patterns at bus stop.
The arrival and boarding rate of passengers bus
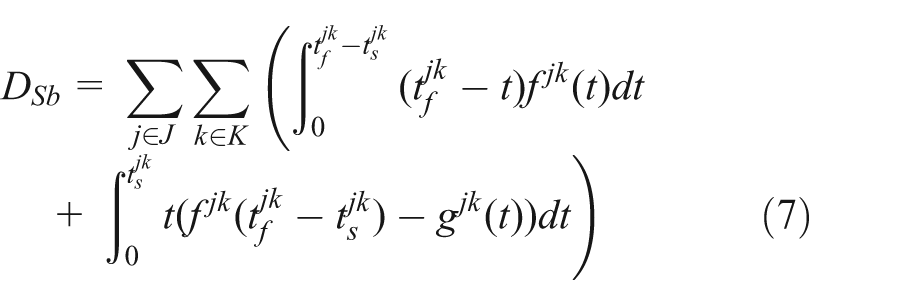
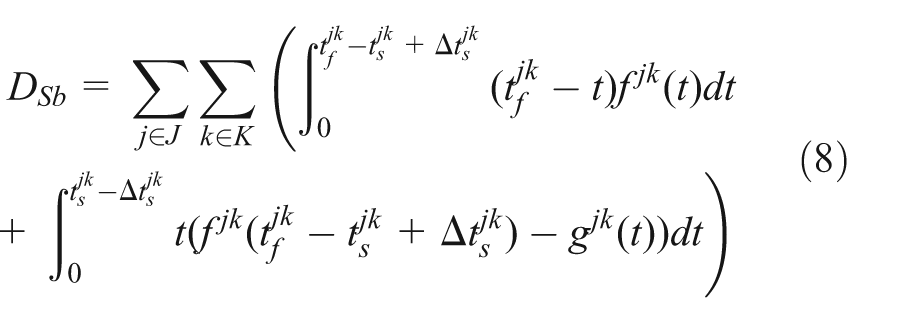
For formalized situation (as shown in Figure 4(a)), the PD for each arriving transit vehicle at bus stops can be formulated in the following equation
For the overflow situation, the number of berths is less than bus arrivals, and the downstream buses are required to wait at the entrance of curbside stop until the upstream berths are vacated.
17
The DT of bus
Intersection signal phasing allocation
Figure 5 shows a sample four-phase ring diagram with TSP strategy of green extension. Phase 1 includes a through and right movement of vehicles on the major street. Phase 2 includes a left-turn movement for the main street. Phase 3 consists of a through and right movement of vehicles on the minor street. Finally, Phase 4 has one left-turn phase on the minor street. The transit vehicle movements follow the through movement in the major direction. The initial phasing plan without TSP is Plan 1. Plan 2 is the TSP phasing program with green phase extension where

Ring-and-barrier diagram and TSP strategies.
In this article, the TSP green duration and signal phasing plans are optimized with fixed cycle lengths. Then the phase plans are predetermined and fixed. TSP strategy of green extension is selected for optimization, and the TSP green duration for transit vehicles is calculated by the following equation
where
Arterial coordinated signal optimization
A well-timed, coordinated system enables continuous movement along an arterial or throughout a network with minimum delays, which, reduces fuel consumption and improves air quality. 18 The two fundamental parameters (cycle length and offset) should be adjusted for acquiring the optimized coordinated system. The maximum cycle length of the arterial is usually chosen as the common cycle length.
Every signalized intersection has an offset point referenced to the master clock. Therefore, each intersection will have a relative offset to each other. The optimized offset can be acquired regarding the time-space diagram considering the DT of transit vehicles at intersections and bus service stops.
Case study
Experiment design
The network used in this case study is the two commuting arterial corridors (Zhanjiang Ave and Qingliangmen Blvd) of Qingliangmen-Bridge community in Nanjing, China. These two arterial corridors have five adjacent signalized intersections, Zhanjiang Ave at Hengqi Rd (I-1) and Hanjiang Rd (I-2), Qingliangmen Blvd at Zhanjiang Ave (I-3), at Nenjiang Ave (I-4), and at Beiwei Ave (I-5). The test area also includes four bus stops, serviced by 11 transit routes (Transit Routes 15, 20, 23, 57, 60, 91, 133, 204, 303, 317, and 550). Hanjiang Bus Stop (S-1) and Qingliangmen Bus Stop (S-2) are located in Zhanjiang Ave, and Zhanjiang Bus Stop (S-3) and Qingliangmen West Bus Stop (S-4) are located in Qingliangmen Blvd. The geometric layouts of the evaluation area are illustrated in Figure 6. Field data collected from the evaluation area are used in the numerical experiments for the proposed TSP models.

Layouts of test area in Qingliangmen-Bridge community.
Based on the warrant of TSP control unit, these two commuting arterial corridors are divided into five control units: Control Unit-1 (CU-1, including I-1 and S-1), Control Unit-2 (CU-2, including I-2 and S-2), Control Unit-3 (CU-3, including I-3 and S-3), Control Unit-4 (CU-4, including I-4 and S-4), and Control Unit-5 (CU-5, including I-5 only).
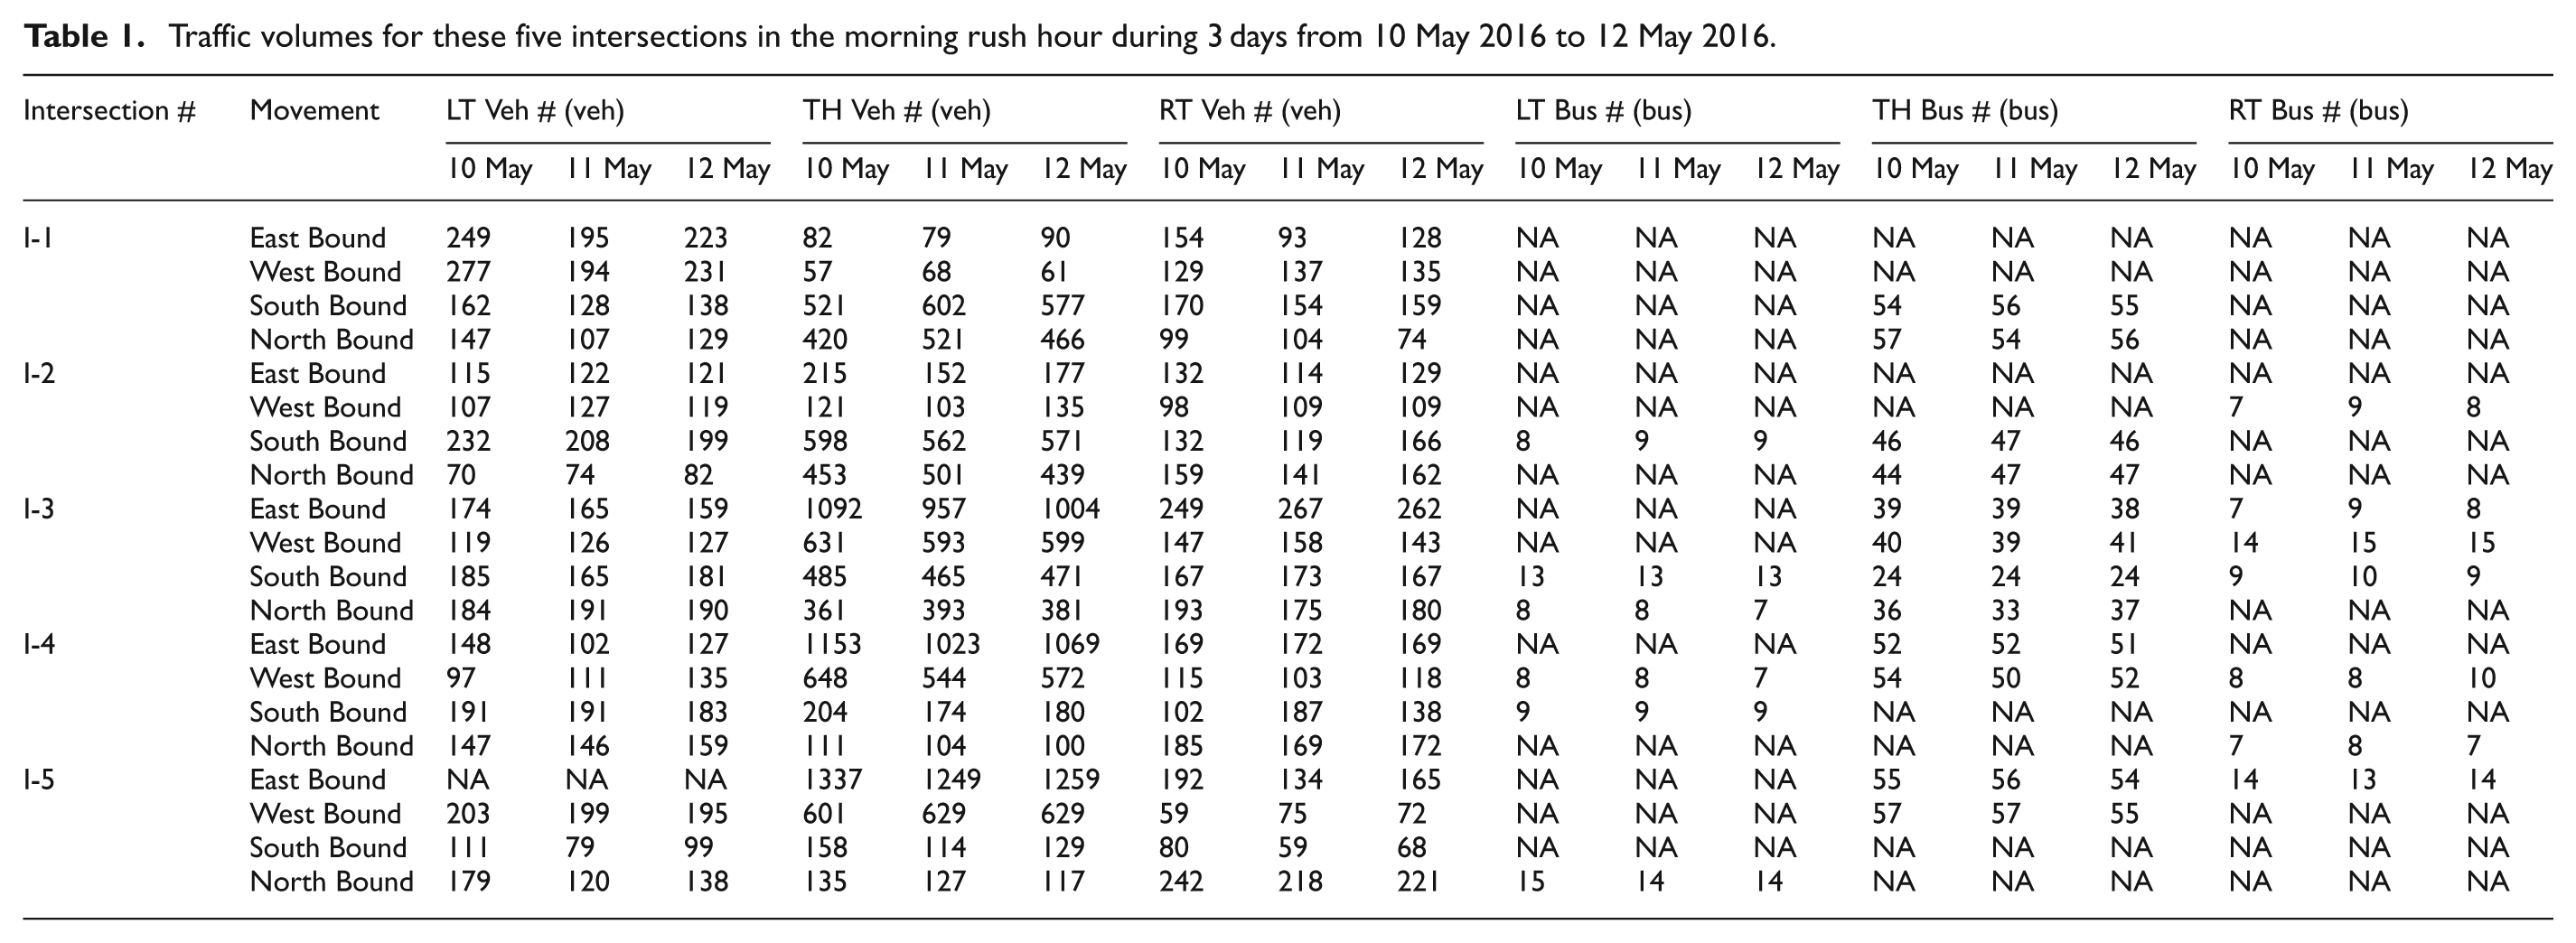
The initial signal phase plans (without TSP strategy) for these intersections are shown in Figure 7. Traffic volumes data collected in the morning rush hour (from 8:00 a.m. to 9:00 a.m.) during 3 days from 10 May 2016 to 12 May 2016 are shown in Table 1, and the movements of each phase for these intersections are illustrated in Table 2.

Initial signal phase plans of these five signalized intersections.
Traffic volumes for these five intersections in the morning rush hour during 3 days from 10 May 2016 to 12 May 2016.
Movements of original traffic signal phasing plan for these five intersections.

Several preliminary experiments were performed to determine the capacity of vehicle lane is 1700 vehicles per lane per hour approximately, 19 and the transit lane capacity is nearly 850 buses per lane per hour. 20
The APO of general vehicles during morning rush hour is observed to be 1.8 persons per vehicle by field observations. Passenger occupancy (PO) of these transit routes are calculated using automated passenger count (APC) data and the empirical calibrated by Nanjing Transit Agency. Table 3 lists the APO of all transit routes in the morning rush hour during the test days at the different approaches of these five signalized intersections.
Average passenger occupancy of all transit routes for these five intersections.

In this study, TSP strategies are developed to respond to morning peak hour direction, the southbound direction for Zhanjiang Ave, and the eastbound direction for Qingliangmen Blvd. The transit route characteristics of these four bus stops are illustrated in Table 4.
Transit routes of these four bus stops.

The Time-Space trajectory diagram of these 11 transit routes between 8:00 a.m. and 9:00 a.m. during 3 days from 10 May 2016 to 12 May 2016 is illustrated in Figure 8. The DT of these transit routes at the four bus service stops can be acquired in Figure 8. Arrival time data are obtained from the Automatic Vehicle Location (AVL) system (between 8:00 a.m. and 9:00 a.m. during 3 days from 10 May 2016 to 12 May 2016). PO, the number of boarding passengers (BP), and alighting passengers (AP) in the morning rush hour of these four bus service stops for the same period are depicted in Figures 9–11. The PO is calculated based on APC data and the empirical observations of local Transit Agency. The BP and AP count data are collected through the observation at the bus stops.

Time-Space trajectory diagram of these 11 transit routes.
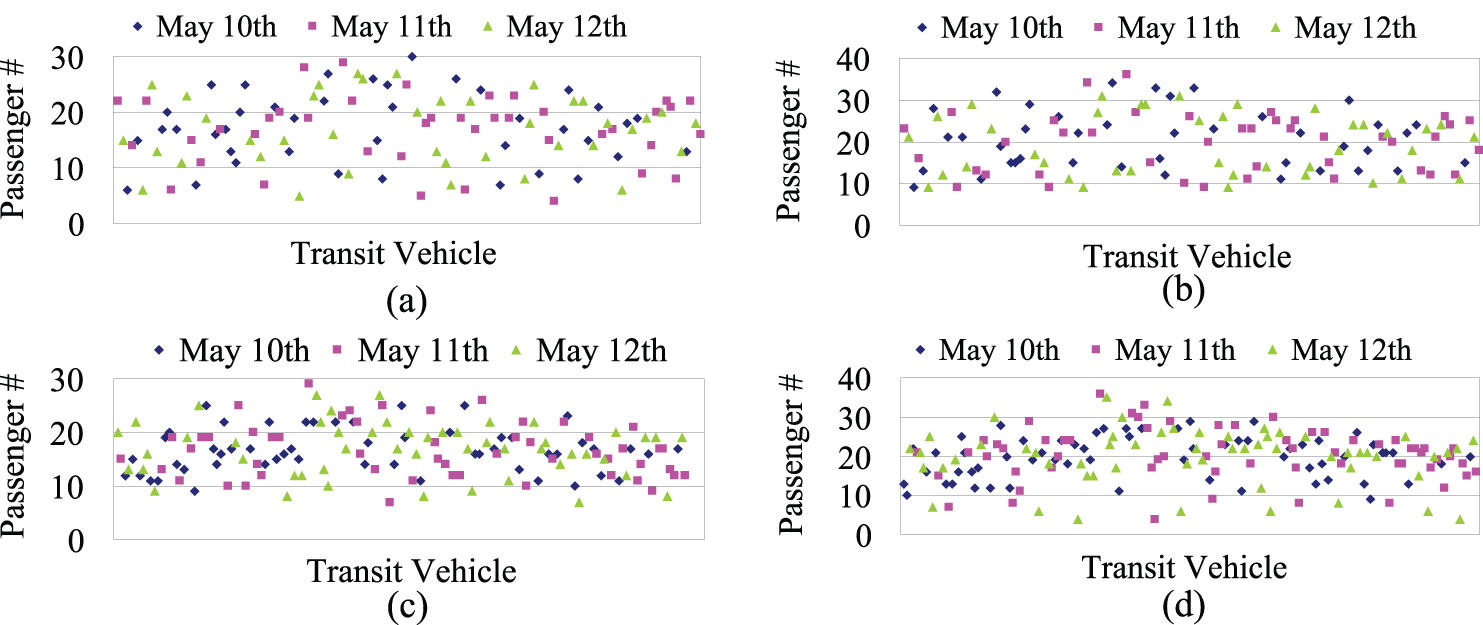
Passenger occupancy for transit vehicles at bus stops during the experimental days: (a) S-1, b) S-2, (c) S-3, and (d) S-4.

Boarding passenger # for transit vehicles at bus stops during the experimental days: (a) S-1, b) S-2, (c) S-3, and (d) S-4.

Alighting passenger # for transit vehicles at bus stops during the experimental days: (a) S-1, b) S-2, (c) S-3, and (d) S-4.
Based on the observation data for the number of Passengers’ boarding and alighting at these four bus stops, the number of BP is higher than AP for nearly all transit routes (except Bus Route 15) in the morning rush hour. Besides, the number of BP directly affects the duration of DT of transit vehicles during the test time.
Results simulation analysis
Traffic data collected in the morning rush hour during 3 days from 10 May 2016 to 12 May 2016 are divided into two parts. The first part of the data (10 May 2016 and 11 May 2016) is used to calibrate the proposed TSP optimization model, and the second part of the data (12 May 2016) is used to evaluate the performance of this model.
Experimental design
In this research, capacities for each approach of signalized intersections are assumed fixed and not affected by traffic operations. Uniform arrival rates are also assumed for passengers coming to these four bus stops during the morning rush hour. The TSP green durations (illustrated in Table 5) at these five signalized intersections are calculated based on the proposed TSP time optimization model, which is calibrated by the data collected in the morning rush hour during 10 May 2016 and 11 May 2016. Table 5 also presents the PD at these five control units with and without TSP optimization. The results of Table 5 show the significant PD reduction of over 3.5% at the test control units (expect CU-5). Figure 12 shows the TSP timing optimization plans.
Solutions of proposed TSP optimization model.

TSP: transit signal priority.

TSP optimization phase plans of these five signalized intersections.
The traffic flow characteristics (based on Table 2) of the two arterial corridors illustrate the significant disequilibrium. Figure 13 describes the proposed coordinated timing plan for the direction with higher volumes of these two arterials.

Time-Space diagram of the proposed coordinated timing plan.
For Zhanjiang Ave, morning peak hour direction is the southbound direction. The distance between I-1 and I-2 is 320 m, and the average speed of traffic flow of Zhanjiang Ave is 20 km/h. The optimal offset between I-1 and I-2 (Off2-1) is 58 s.
For Qingliangmen Blvd, morning peak hour direction is the eastbound direction. The distances between I-3 and I-4, I-4 and I-5 are 400 and 330 m, and the average speed of traffic flow of Qingliangmen Blvd is 25 km/h. The optimal offsets between I-3 and I-4 (Off4-3), I-4 and I-5 (Off5-4) are 58 and 48 s.
Results simulation analysis
VISSIM-based simulation platform is established for testing the performance of the proposed optimization model and method. Based on the data of 12 May, average vehicle delay at the intersections and bus stops are simulated by the VISSIM-based simulation platform under the initial and optimized signal phase plans. Then, PD at each control units is calculated using simulation-based average vehicle delay, observation-based traffic volume, and observation-based occupancy. TSP optimization model–based PD at each control units are also calculated for further evaluating the performance of this model.
Table 6 summarizes the PD (simulation platform based and optimization model based) of these control units with and without TSP optimization strategies based on the traffic data in the morning rush hour on 12 May 2016. The results of Table 6 show the significant reduction of PD for optimized signalized plan at bus stop and intersections using model-based and simulation-based methods. For passengers’ delay at intersections of CU-1 to CU-5, reduction rate of simulation-based PD is more than that of model-based PD. For passengers’ delay at bus stops of CU-1 to CU-4, reduction rate of model-based PD is more than that of simulation-based PD. Total passengers’ delay reduction of model-based PD is less than that of simulation-based PD for each control unit.
Total passenger delay comparison between model-based and simulation-based PD.

PD: passenger delay.
The results of Figure 14 demonstrate the significant PD reduction (under optimal signal phase plans) of over 3.5% at the experimental control units (with a bus stop). Model-based and simulation-based evaluation results of TSP optimization methods have similar performance in reducing PD at the test area. The performance of the TSP optimization model (proposed in this article) has advantages in decreasing total passenger delay at bus stops than in intersections with over 3.5% more reduction. Also, the TSP optimization model performs varied for segments under different saturation conditions. The traffic volume degree of saturation of Zhanjiang Ave is higher than that of Qingliangmen Blvd in rush hour during the test days, and the PD reduction rates for these two arterial segments are different. The proposed TSP optimization model performs better in reducing PD for Zhanjiang Ave (CU-1 and CU-2) than those of Qingliangmen Blvd (CU-3, CU-4, and CU-5). Therefore, the TSP optimization scenarios for reducing PD of the transit system will be weakened undersaturated and oversaturated traffic flow condition.

Passenger delay reduction rate comparison for the test area.
Conclusion
This article presents a TSP optimization framework for unsymmetrical traffic flow in urban networks during rush hours. The proposed method can significantly improve the efficiency and reliability of transit system and minimize the negative impact caused by arterial coordinated signal control strategy for urban traffic network. Two types of control units of traffic network are identified (intersection with and without downstream bus service stop) for TSP optimization. The TSP green duration optimization model is presented to calculate the duration of the allocated transit green time, the signal phasing allocation method is proposed to generate TSP phasing plans. The arterial coordinated signal optimization method is addressed for adjusting the TSP signal phasing plans, and the TSP control under urban network circumstance is optimized based on the analysis of transit Time-Space trajectory diagram. A numerical experiment is conducted by simulating transit operations with field volume and phasing data collected in Qingliangmen-Bridge community of Nanjing, China, and the experimental area including two commuting arterial corridors, five adjacent signalized intersections, and four bus service stops. The initial non-TSP and optimized TSP phasing plans of the test area are simulated and evaluated using the VISSIM simulation platform. The results of experiment validate the effectiveness of the proposed TSP method, and the performance of the optimized TSP phasing plans are analyzed and evaluated.
Future work includes more extensive numerical experiments and field tests to assess the effectiveness and reliability of the proposed TSP method under the complex traffic condition. Another potential extension is to expand more factors such as traffic flow patterns, the distance between bus stop and intersection, and geometric configurations of intersections and bus stops should be introduced for TSP optimization models development and calibration.
Footnotes
Academic Editor: Yongjun Shen
Declaration of conflicting interests
The author(s) declared no potential conflicts of interest with respect to the research, authorship, and/or publication of this article.
Funding
The author(s) disclosed receipt of the following financial support for the research, authorship, and/or publication of this article: This research was supported by the National Natural Science Foundation of China (grant no. 51508161), Natural Science Foundation of Jiangsu Province (grant no. BK20140851), and Fundamental Research Funds for the Central Universities of China (grant no. 2016B08314).