
Abstract
In place of pedestrians and bikes, crashes involving electric bikes have become a large portion of crashes in China in these years. Crash data from Beijing, China, from the year 2009 to 2015 are used to identify how the factors impact injury severity of vehicle to electric bike crashes. A total of 150 crash samples are collected in order to investigate the influence of human, vehicle, road, and environment characteristics on injury severity. For that reason, a binary logistic model is established to analyze the significance of main contributing factors of crashes. This article describes the sample data, which includes time of incident, road users’ age and gender, crash patterns, and characteristics of road and environment. The results of descriptive statistics reveal that older riders and younger drivers are more likely to be involved in fatal crashes; the crashes have much higher frequency in motor vehicle roads, in suburban area, and in roads with higher speed limitation. The logistic regression model shows that older riders (age > 25) and electric bike turning increased the injury severity. On the contrary, the off-peak hour and the older driver (age > 25) of vehicle reduced the likelihood of fatal crash. These findings are hopeful to react on related research for accident prevention and injury reduction.
Introduction
The safety of vulnerable road users (VRUs for short, for example, riders, pedestrians) is going to face challenges in the coming years. Another category of VRU is the electric bike rider. An electric bike (e-bike and EB for short) has a top speed of 20 km/h, a maximum weight of 40 kg, and a maximum power of 240 W and is classified as non-motorized vehicle by the traffic safety laws in China. These vehicles therefore can travel in bike lanes with no license, insurance, and helmet use required for e-bike riders.
As the capital and one of the largest cities in China, Beijing has a population of over 17 million and about 10 million bikes and over 0.7 million e-bikes in 2010. 1 In recent years, in China, the use of e-bike has grown tremendously as it can save money, energy, and ride people fast and conveniently. E-bikes were first introduced in 1984 and were estimated to exceed 120 million nationally in 2010. 1 This number is also expected to continue to grow. However, traffic safety for e-bike riders has become a big issue due to the increasing number of related crashes and injuries. Crashes involving e-bike have exceeded that with manual bike, pedestrian, and other VRUs. To date, the issues related to e-bikes in China also have been concerned by the international research circles.2,3 Many studies focus on the use characteristics and reasons for rapid growth of e-bike users in China. Consequently, it is of significance for Chinese researchers to carry out the studies on this crash type.
Some past papers focused on the severity of crash involving bikes. The results of a research on crashes involving bicyclist in the United States suggested that there were higher fatality risks for males, bicyclists over the age of 44 and bicyclists who ride after dark. 4 Based on police-reported crash data between 1997 and 2002 from North Carolina, USA, the bicyclist injury severities in bike-motor vehicle crashes are analyzed. The results show several factors which double the likelihood of a bicyclist suffering a fatal injury in a crash, for example, vehicle speeds above 48.3 km/h and bicyclist age 55 or over. 5
Since the issue of e-bikes became increasingly serious, the relevant studies have been increased in the past 10 years. Cherry and Cervero 3 surveyed e-bike usage in two large cities, Kunming and Shanghai. They found that e-bike users travel considerably more than bike users and most e-bike users would travel by bus if e-bikes were unavailable. Feng et al. 6 analyzed the data of e-bike-related injuries in Hangzhou from 2004 to 2008. The results show that there was a significant average annual increase in e-bike-related casualty rates of 2.7 per 100,000 populations. In 2013, Du et al. 7 collected data on road riding practices among e-bikers. This study demonstrated common road rule violations and low helmet use among e-bikers, for example, carrying passengers, riding in a motor-vehicle lane, running red lights, riding in opposite directions, and mobile phone use. Also, Du et al. 8 collected information for hospitalized users of e-bikes involved in road crashes from hospital records in another outstanding tourist city, Suzhou, China. They found that hospitalized e-bike users’ injuries accounted for 57.2% of road traffic hospitalization over the 6-month study period. And future injury prevention initiatives should include encouraging helmet use among e-bikers. In Hefei, the capital of Anhui province, the data from 205 cases were investigated to explore the related factors of injuries caused by e-bike and bicycle crashes, which showed that injury severity was the most commonly suffered within the vehicle type. 9
Not only in China but also in some European countries, e-bike crashes have been taken into account. In Netherlands, Schepers et al. 10 used logistic analysis to compare the risk of crashes with electric and classical bikes. The results suggested that e-bike users were more likely to be involved in a crash. In Switzerland, Weber et al. 11 analyzed police-recorded crashes involving e-bikers. They compared the figures of rural and urban environment and found that most e-bikers sustained single crashes and that helmet usage was higher in the rural environment than in the urban area. In Denmark, the data from a survey of 685 e-bike users is used to examine the factors related to e-bike safety. It was demonstrated that riding style and e-bike attitude played a crucial role in both perceived safety and involvement in safety critical incidents. 12
The above studies lack the in-depth analysis on the contributing factors and severity of e-bike related crashes. The main purpose of this article is to obtain the characteristics and contributing factors of passenger vehicle–e-bike crashes (“crash” or “crashes” for short in this article). Based on the survey and in-depth data analysis of traffic crashes, 150 serious crash cases involving collisions between passenger vehicle and e-bikes in Beijing from 2009 to 2015 are collected. Then, the descriptive statistics of the crash data are carried out, and the variables of human, vehicle, road, environment, and their correlations with injury severity are investigated. The conclusions may provide useful reference for the related research of traffic safety and crash prevention.
Methodology
Crash data
In China, a crash is defined as “serious” when it involves at least injured occupant. Only in these situations will an officer file a report. These crashes can be separated into fatal and non-fatal crashes. The use of safety equipment (e.g. helmets) is not mandatory in China either for bicyclists or e-bike riders. However, this can be problematic as studies show that the lack of safety gear is associated with an increased likelihood of a serious injury. 13
According to the data issued by Traffic Management Bureau of the Ministry of Public Security of China, in 2015, the number of serious crashes (causing casualties) involving pedestrian, bicyclist, and e-bike riders are 2075, 1369, and 11,233, respectively, which take up 1.11%, 0.73%, and 5.98% in total crashes of China. 14 Figure 1 represents the trend of crash frequency, fatalities, and non-fatal injuries caused by e-bike, bicycle, and pedestrian from 2004 to 2015, respectively. In recent years, the proportion of crashes involving pedestrians or bicycles keep in low level, but the crashes involving e-bike riders are gradually increasing into a large quantity.

Frequency of three crash types.
To examine the characteristics of total samples and the similarities and differences among the three crash types, an in-depth database of passenger vehicle to VRU crashes was developed and used. 15
The crash samples in this study are selected from the real-world crash cases analyzed by Tsinghua University for the Bureau of Public Traffic Security Administration in recent years. The 150 serious vehicle to e-bike crash samples in Beijing from 2009 to 2015, which involved passenger vehicles and caused casualties of e-bike riders, are surveyed and the related data are collected in detail. The samples can be regarded to be randomly selected from all the accidents occurred during this period. The main data are from the police on-site records on the crashes, and our observation and detection on the vehicles involved in crashes. Then, the database can provide basic data material for the following research.
Candidate variables
The data source is developed and various data from crashes will be integrated and applied to provide the valuable information for the in-depth crash analysis. To date, the in-depth data resource contains 150 crashes involving e-bikes and vehicle. The database consists of time, vehicle, driver, rider, road, and environment information, described by 15 variables with two typical categories for each crash (Table 1).
List of main variables related to crashes.

The main data were obtained from the police records on the crashes and our detections on the vehicles involved in crashes. Then, the database could provide basic data material for the following research.
Statistical methods
In this article, Excel and R software are the tools for storage and statistics on the data. The descriptive statistics and relativity analysis will be carried out. A binary logistic model will then be used with the corresponding driver, vehicle, VRU, and environmental factors observed from the crash data to identify factors that contribute to the likelihood of a crash severity from a 7-year perspective.
A binary logistic model is used to seek the relationship between dichotomous dependent variable and independent variables. In this study, the dependent variable, the injury severity of the VRU, is divided into two categories: non-fatal injured, which is coded as 0, and fatalities coded as 1. Therefore, each one of the 150 cases in the dataset is a record of the severity level sustained by each e-bike rider involved in the crash. And a single crash would correspond to various observations that are equal to the number of all injured persons involved in the crash.
Based on the data source and statistical method, the characteristics and differences of the crashes can be examined.
Results
Based on the 150 in-depth crash cases, the information of vehicle, driver, e-bike rider, road, and environment are investigated. According to the research objectives and the actual cases, a certain number of variables are chosen to be samples for the statistics and then the specialties of these crashes and the corresponding relation with injury severity can be analyzed.
Basic information of crashes
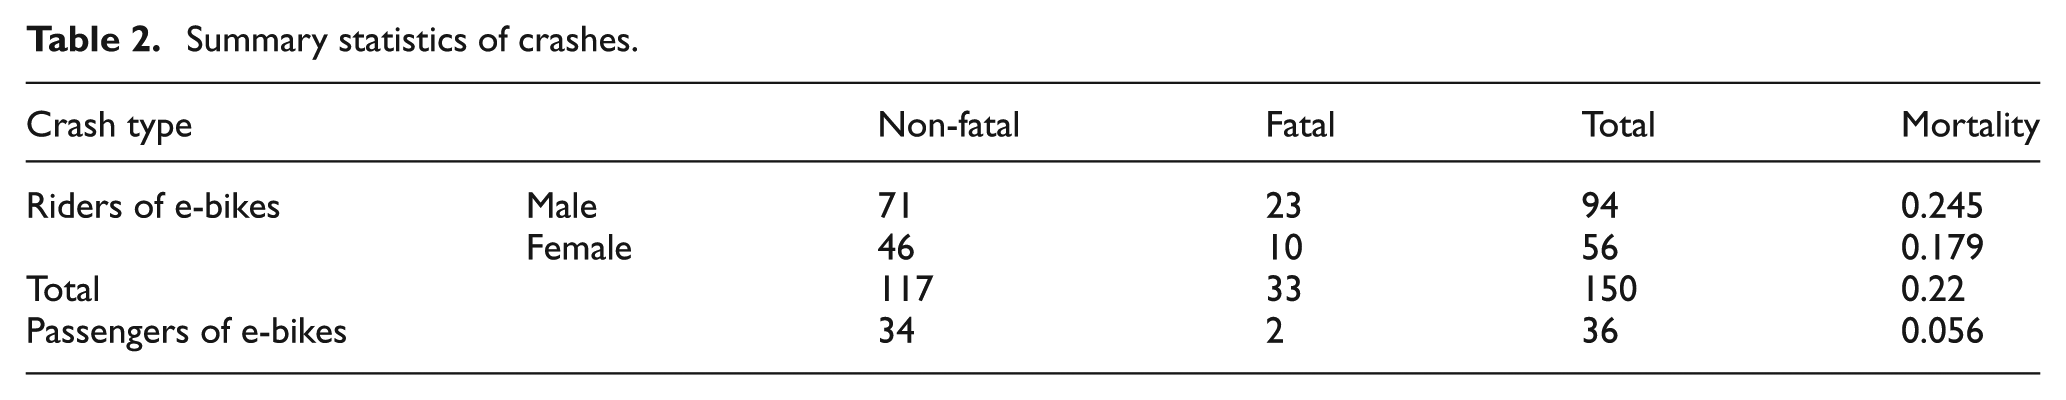
Table 2 shows that there are 33 fatal crash cases in the data source, which take up 22% of the total number. Male riders involved in crashes have 94 cases, which account for 63%. In 36 cases, the e-bikes carry passengers on the back seats. The mortality for the rider of e-bike is 0.22, while it is only 0.056 for the passengers of e-bikes. Comparing with the passengers of e-bike, the riders face higher fatalities.
Summary statistics of crashes.
Time and date of crash
The time of crash occurrence is accumulated by hour of day, as shown in Figure 2, which appears as peaks in different time periods. The highest peaks exist between 7:00 and 7:59, which represents the rush hour in the morning. 14:00–14:59 and 18:00–19:59 are the second highest peaks existing in the afternoon and evening. In total, most of the crashes occur from 6:00 to 24:00 (morning to midnight) and few crashes happen from 0:00 to 5:59 (midnight to morning). On the whole, we can see the mortality at night is higher than in the day time.

Time of crash (n = 150).
Figure 3 illustrates the incident count by different day of a week. As can be seen in the figure, Wednesday takes the largest number of incidents relatively. Maybe it has something to do with that it is the middle of weekdays, the busiest day for most people as well as for the traffic. The least value appears on Saturday, the first day of people’s weekend. For the rest days in a week, they basically share the similar count.
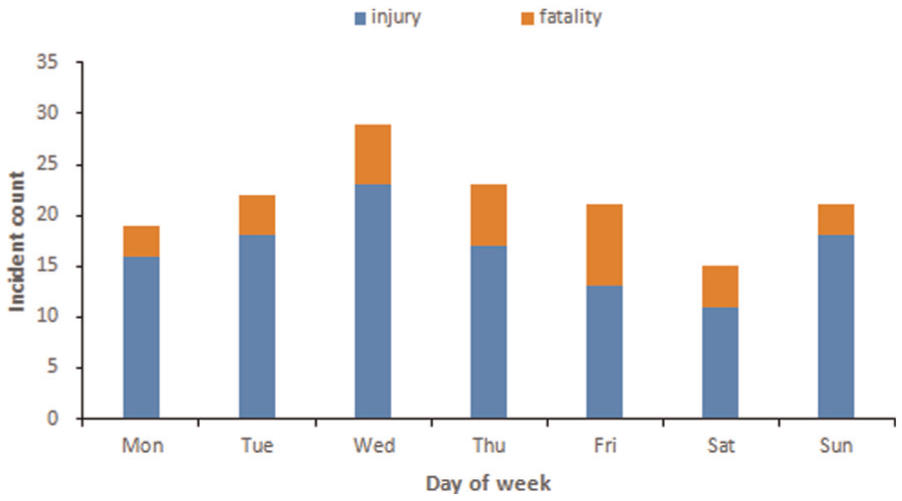
Incident count by day of week (n = 150).
Information of e-bike incidents in every month is indicated in Figure 4. The trend of the frequency changing with the month is apparent. The count increases with month from January to June and reaches a high level which will last for about 5 months to October, and then the count will decrease. The reason behind may lay in the factors related to weather. Compared with cold weather, e-bike owners more like using them in warm or hot days in summer because riding e-bikes in cold winter of Beijing usually means suffering from bitter cold, violent wind, and dirty air. That is not comfortable or convenient for riders. The mortality in different months has no significant characteristics.

Incident count by month (n = 150).
Vehicles
There are 39 kinds of brands appearing in the crash, such as Beijing Hyundai (15%), Chang An (7%), Volkswagen Santana (6%), and so on. Over 60 manufacturers made these cars in China. It was found that the vehicles made by joint venture take a large proportion and many local firms appear. Rush hours were also taken into consideration. On the basis of the regulations from Beijing Traffic Management Bureau, passenger vehicles from other provinces are not allowed to travel within the fifth ring road from 7:00 to 9:00 AM and 17:00 to 20:00 PM. This can be considered as rush hours in this study. The results showed that 22 (17%) crashes happened in rush hours which accounted for 21% of all 24 h. The models of cars include four types, such as passenger car (70%), minibus and light bus (26%), and the rest 4% (Table 3). Passenger car is the most common vehicle so that its frequency has larger percentage. It is worth mentioning that the minibus and light bus take a considerable proportion. In China, there are a great number of minibuses and the drivers of minibuses lack the awareness of safe driving, as it is observed that a number of them do not comply with the traffic rules.
Vehicle type and severity.

Figure 5 illustrates six impact scenarios between vehicles and demonstrates the traveling direction of vehicles before collision. Scenario A has the most frequency (67 cases, about 45%) which causes vertical side crash, followed by scenario D (35 cases, about 23%) which shows that e-bike is turning. Scenario F only has four cases, which represents that both vehicle and e-bike make turn at the same time.

Impact scenario between vehicles.
For the directions of causing-traffic-trouble vehicle, the largest proportion (122, 81%) is straight traveling on the road. However, turning of vehicle at intersection is only occupying 19%. It is obvious that vehicle’s straight traveling on the road has higher frequency and severity while encountering with e-bike.
Drivers of vehicles
In 150 crash cases, 142 vehicle drivers (95%) of the total are males, and only 8 drivers are females. No drivers have the records of alcohol impairment. The driver’s age range from 18 to 69 years, and their mean age is 36.8 years while the median is 35 years. In the 33 fatal cases, the drivers’ mean age is 32.1 years and the median is 31 years. Younger drivers are more likely to be involved in fatal crashes. Considering the drivers’ emergency braking response, through the detection of the tire trace on crash site, 102 drivers of vehicles have the braking behavior before crash.
E-bike and riders
For e-bikes, there are over 30 kinds of brands involved in crashes, which mainly include two basic types: with pedals and without pedals. As shown in Figure 6, the former type is similar to a common bicycle and the latter one seems like a motor cycle.

Main types of e-bikes.
In 150 crash cases, no riders wear helmets. A total of 111 e-bikes went straight while 39 e-bikes made a turn. In total, 75 of total e-bike riders reside in Beijing and 75 of total are from other provinces or municipalities, thus they are equal in quantity. Figure 7 illustrates fatal e-bike rider’s number by age. It can be seen that the largest age ranges of fatalities are 40–59 years old. 50–59 years old has the highest mortality, which is over 30%.

Age range versus fatalities of e-bike riders.
Table 4 gives the details of riders’ ages and compares ages for non-fatal and fatal crashes in the samples. The mean age of fatal riders is higher than the injured ones, with the difference of 5.5 years old.
Rider’s age versus severity by crash types.

SD: standard deviation.
Road and environment
Concerning the crash site, 59% of crashes occur at the intersection. The types of road lanes where crashes occurred include motor-vehicle lane, bike lane, and mixed lane. The largest proportion (85%) is at the motor-vehicle lanes.
In 150 crash cases, most of crashes occur in dry and flat road surface, only 2 crashes occurred in wet or water-gathered road surface. All the 150 cases take place on the asphalt road surface. As for the geographical position of crashes, 56 crashes occur in urban area (including 6 districts) and 94 occur in suburban area (including 10 districts).
In regard to the speed limitation for roads, limitation under 50 km/h takes up 33%, while speed limitation of 50–80 km/h has a portion of 77%, which illustrates that there is a much higher likelihood for the e-bike crashes to happen in roads with a high speed limitation.
In terms of the weather conditions, when the crashes occur, the proportion for sunny days is 81% (121 of 150), and it is 8% (12 of 150) for cloudy days and 11% (17 of 150) for rainy or snowy days.
Crash severity model
A binary logistic model is developed to predict the likelihood of a VRU crash being injurious or fatal. The resulting regression model is presented in Table 5. It shows that older rider (age > 25) increased the likelihood of an EB crash being fatal by 9.313-fold. And when EB turns, the likelihood for severe injury of the crash is also increased by 2.695-fold. But compared with rush hour and younger driver (age > 25), off-peak hour and older drivers (age > 25) reduced the likelihood for severe injury of EB crash. When the crash occurs at motor-vehicle lane, the severity of crash will increase by over threefold, but the likelihood is not very significant. No other explanatory variables are observed as remarkable.
Parameter estimates for likelihood of more severe crashes.

SE: standard error; OR: odds ratio; CI: confidence interval; /: not applicable; EB: e-bike.
Number of observations = 150; null deviance = 158.07; residual deviance = 132.40; Akaike information criterion = 164.4.
Discussion
The 150 crash cases involving passenger vehicle and e-bikes in Beijing are analyzed to examine the characteristics and severity of crashes. The details are summarized and discussed as follows.
Concerning the occurring date and time, most of crashes occurred from morning to midnight in a day. There is a noticeable peak appearing at the rush hour (7:00–7:59 AM). The high frequency of crashes in morning peak results from the exposure of more vehicles and e-bikes than other time. The mortality at night is higher than in the day time, which is similar to the result of a research on crashes involving bicyclist in the United States. 4 Wednesday has the largest number of crashes and the least frequency appears on Saturday. Mid-weekday is a busy day for lots of drivers and riders in this city. More crashes take place in the warm seasons in Beijing area (from May to October).
Due to the huge amount, passenger car is the most common vehicle type involving the crashes. Vehicle’s straight traveling on the road has higher frequency and severity. 95% vehicle drivers are males and younger drivers are more likely to be involved in fatal crashes. Considering the vehicles’ tire traces on the scenes, 102 drivers of vehicles took the braking measures before crash.
In total crash cases, 111 e-bikes go straight while 39 make turn. The largest age ranges of fatalities are 40–59 years old and 50–59 years old with over 30% proportion has the highest mortality. This result is quite similar to the results of existing researches on bicycles.4,5,9
Concerning the crash site, 59% crashes occur at the intersection. The largest proportion (85%) of the types of road lanes is at the motor-vehicle lanes, which represents most of the EB rider has illegal action, in accordance with some research findings by Chinese researchers. 8 A total of 94 crashes (63%) occur in suburban area (e.g. Shunyi district and Daxing district) and 56 (37%) occur in urban area (e.g. downtown of the city, like Chaoyang district and Haidian district). The concerned crashes have much higher frequency in roads with a higher speed limitation.
The binary logistic model shows that older rider (age > 25) increased the injury severity by more than ninefold. And EB turning also increased the likelihood for severe injury of EB riders. However, in comparison with rush hour and younger driver (age > 25), off-peak hour and older driver reduced the likelihood for severe injury of EB rider. Older e-bike riders are at higher risk of sustaining severe injuries than younger e-bikers, which accord with the finding of a recent research in Switzerland. 11 Other findings are characteristic and at present there are no similar research results.
Based on these real crash cases, some issues around the safety of e-bikes are pointed out. The most common scenario of the crashes between vehicles and e-bikes with the highest mortality is the vertical side impact at intersection, that is, vehicle’s front colliding an e-bike’s side. Both vehicle drivers and e-bike riders should pay extra attention to this location and watch out for each other.
The result reflects some common road rule violations among e-bike riders, for example, riding in motor-vehicle lane, riding in opposite direction, making turn at will, and carrying passengers. Actually, as a small and light electric vehicle, e-bike has low noise and accordingly it cannot be easily noticed and avoided by other drivers and road users. Without helmet but with higher speed, most e-bike riders tend to be injured seriously when involved in crashes. Therefore, e-bike riders are risky and dangerous in the road traffic system in this city.
From these results, some relevant safety countermeasures could be considered and executed to reduce the injury of EB rider. EB riders should obey the traffic law and pay attention safely while turning, especially for the older riders and in rush hour. Relevant policy and solution of traffic management should focus on the above situations. More instruction and suggestions on traffic safety should be presented in related education, training, and propaganda for both drivers and riders. In the mean time, effective road interventions (e.g. separation between motor vehicle and e-bike) and protective measures for riders (e.g. helmet) are needed to reduce injuries of e-bike riders. Injury reduction countermeasures should be highlighted to encourage and promote helmet use for vast e-bike riders in China.6,8,9
Due to the limited data, some important varieties, for example, the speed of vehicle and the in-depth injury data of riders, are not included in the statistics and analysis. To develop measures to maximize the health benefits and minimize the risk of EB use, more in-depth research is needed, which should include a larger sample size and additional medical information such as injury severity score, injured body part, and length of hospitalization. 10 In future, more samples will be investigated and more valuable information will be collected and added, and accordingly further useful findings will be obtained.
Conclusion
In conclusion, the results of this article demonstrate a statistics analysis to provide an overview of the data from 150 passenger vehicles to e-bike crashes in Beijing, China. The results reveal some characteristics in occurrence time, vehicle type, drivers’ behavior, rider’ s age, traveling direction of e-bike, and the corresponding relation with injury severity of rider. The important conclusions are summarized as follows.
Most of the crashes occur from morning to midnight in a day and there is a remarkable peak appearing at 7:00–7:59 AM. The mortality of riders at night is higher than in the day time. Vehicle’s straight traveling on the road has higher frequency and severity. Younger riders tend to suffer fatal crashes. Most of the vehicles have the braking traces on the scene before crash.
Suburban area, intersection, and motor-vehicle lanes are all the crash-prone locations for e-bikes. The crashes have much higher frequency in roads with a higher speed limitation. Therefore, road design should be improved to separate VRU from motor vehicles through adding guardrails between motorway and bicycle lanes. 9
The logistic regression model reveals that older age (25+) and e-bike turning increased the injury severity of e-bike riders. On the contrary, the off-peak hour and the older driver (25+) of vehicle reduced the likelihood of crash to be fatal. The issues regarding e-bike turning at will and older riders’ safety should be further considered and addressed. Some useful results are hopeful to react on the related research and developing work of traffic safety. And some effective methods of management and education for e-bike riders, for example, using helmet, obeying rules, training driving behavior, and enhancing safety consciousness, should be advanced in China.
Footnotes
Acknowledgements
The authors acknowledge the real-world crash cases provided by Beijing Traffic Management Bureau of China.
Academic Editor: Xiaobei Jiang
Declaration of conflicting interests
The author(s) declared no potential conflicts of interest with respect to the research, authorship, and/or publication of this article.
Funding
The author(s) disclosed receipt of the following financial support for the research, authorship, and/or publication of this article: This work was supported by the Opening Project of Key Laboratory of Road Safety Technologies, Ministry of Transport (2015RST02), P.R. China. Part of this work was supported by the Project of Student Research Training (SRT) in Tsinghua University.