
Abstract
Crash pulse is an acceleration curve measured in the car during a crash test. The shape, time duration, and maximum acceleration of crash pulse may influence the predicted motion of the occupants. The characteristics of crash pulse measured during crash tests can be further used to analyze the crashworthiness of a given vehicle design. Thus, the dummy installation steps can be skipped entirely. This study comprised two parts. First, frontal crash pulse data were analyzed to determine the relationship between crash pulse curves and occupant injuries and identify the types of pulse associated with minimal occupant injury. Second, crash pulses obtained from frontal crash simulations using different bumper and crossmember designs were correlated to original crash pulse curves to assess car crashworthiness and suggest design improvements. Dummy injuries were not directly considered. However, to verify the effectiveness of using crash pulse curves to evaluate design crashworthiness, crash simulations were conducted with dummies, and the severity of dummy head damage was recorded. According to comparison results, the evaluation results of car bumper and crossmember redesign using head injury criterion value with employing crash pulse on crashworthiness design result are identical. It reveals the feasibility of car crashworthiness design based on the crash pulse.
Introduction
Improving car safety means building more crashworthy vehicle structures and providing them with more effective restraint systems. Hence, car manufacturers now incorporate a wide range of safety devices and features into their vehicles, including airbags, energy-absorbing steering columns, and side-door beams. As effective as these measures have been, the industry also needs more efficient methodologies for assessing vehicle safety. Crash tests are commonly used to evaluate vehicles for occupant protection. Although full-scale crash tests can accurately replicate actual accidents, they are complex and expensive. In a crash test, sensing devices and crash test dummies are mounted in the car to measure the displacement, velocity, and acceleration at different points on the dummy or on the car structure. The data from such tests are widely used to assess vehicle crashworthiness and occupant safety.
The crash pulse is one of the useful types of data for describing what occurs to a vehicle’s structure in a crash. A crash pulse can be used in the sled testing of vehicles and in the design of airbag control unit. However, crash pulses can also be used as an input to a simulation model to determine how occupants react to a crash. The crash pulse measures energy variations during the impact and can be directly related to occupant injuries.
The correlation of pulse shapes to occupant experience has been the subject of several previous studies. Grimes and Lee 1 examined how the shape of the crash pulse correlates to predicted occupant reaction. They compared predicted occupant behaviors obtained using various approximations of crash pulses with predicted behaviors obtained using crash pulses from an actual crash test. Agaram et al. 2 compared acceleration pulses from vehicle-to-vehicle crash tests with those of single-vehicle crash tests. They also used shape and phase cross-correlation to compare acceleration pulses of single-vehicle crash tests with those of vehicle-to-vehicle crash tests. Linder et al. 3 surveyed a range of crash test results to calculate mean accelerations in different vehicles impacted in the same manner. This study also showed that real-world crashes involving the same vehicle model and producing similar delta-V can yield crash pulses that differ in both duration and shape. Varat and Husher 4 showed that a vehicle’s pulse shape can be modeled using readily available crash test data fitted with closed-form functions. The pulse shapes can then be used to run analytical simulations or tests at different crash speeds. Cao et al. 5 presented methodology for optimizing vehicle structural pulse and restraint system parameters in a frontal impact event to maximize star ratings (with appropriate constraints on the values for head injury criterion (HIC), chest acceleration, chest deflection, and femur loads) and effectively reduce occupant injuries. Gu et al. 6 proposed a response surface method for predicting crash pulses that has been used by some manufacturers to improve vehicle design.
Recent advances in numerical simulation technology have allowed engineers to solve previously intractable problems in the analysis of crash events. Having a dummy in the driver seat for an impact test or simulation is necessary. The injury severity analysis in the test can be determined from the dummy response. However, equipping a dummy in the finite element (FE) model of a crash or sled test is complex, involving as it does variables related to dummy position, contact surface setup, and other factors. Crash pulse is an acceleration curve measured in the car during a crash test. The shape, time duration, and maximum acceleration of crash pulse may influence the predicted motion of the occupants. The characteristics of crash pulse measured during crash tests can be further used to analyze the crashworthiness of a given vehicle design. Thus, the dummy installation steps can be skipped entirely.
This study comprised two parts. First, frontal crash pulse data were analyzed to determine the relationship between crash pulse curves and occupant injuries and identify the types of pulse associated with minimal occupant injury. Second, crash pulses obtained from frontal crash simulations using different bumper and crossmember designs were correlated to original crash pulse curves to assess car crashworthiness and suggest design improvements. Dummy injuries were not directly considered. However, to verify the effectiveness of using crash pulse curves to evaluate design crashworthiness, crash simulations were conducted with dummies, and the severity of dummy head damage was recorded. According to comparison results, the evaluation results of car bumper and crossmember redesign using HIC value with employing crash pulse on crashworthiness design result are identical. It reveals the feasibility of car crashworthiness design based on the crash pulse.
Analysis of frontal crash pulse
A frontal crash pulse is a deceleration-time curve measured during a crash test from a sensor point at the rear of the driver’s seat. It is widely used as a measure of vehicle safety. Frontal crash tests based on Federal Motor Vehicle Safety Standard (FMVSS) 208 involve a vehicle crashing into a stationary concrete barrier at 48 km/h. Crash pulses measured from crash tests, including HIC values, can be downloaded from the website of the American National Highway Traffic Safety Administration (NHTSA). 7 However, because the test cars used were all equipped with passive safety devices (e.g. airbags), the data are of limited use for determining the relationship between crash pulse curve and injury severity. In this study, we consider a FE model of sled test without airbag system to simulate a crash test. The relevant crash pulse curve was applied to the sled model during the simulation, and the severity of injury was determined using data from the dummy’s sensors. The direct relationship between crash pulse curve and occupant injury can then be obtained. The FE model of sled test consists of linear rail, seat, seatbelts, and Hybrid III 50% dummy. Figure 1 shows the FE model of sled test as developed and validated by Teng and Fung. 8 The HIC value is calculated based on the resultant acceleration of the head center of gravity during impact from instant T1 to instant T2. Given that T1 is less than T2, the HIC value is defined as follows

with condition

Finite element model of sled test.
Four types each of Sedan, MPV, and SUV were investigated. The Sedans were the 2004 Pontiac Grand Prix, 2002 Toyota Camry LE, 2001 Mitsubishi Galant DE, and 2001 Subaru Legacy. The sled test simulation was performed based on the various crash pulses. The measured values of the head acceleration are filtered in accordance with channel frequency class 1000. Table 1 shows the dummy HIC values of these cars to be 637.3, 615.4, 640.7, and 659.4, respectively. Figure 2 shows the relevant crash pulse curves. The unit of longitudinal coordinates of the crash pulse curves is G. Its value is 9.8 m/s2. From the curves with the highest and lowest HIC values—that is, for the Subaru Legacy and Toyota Camry LE, respectively—although the area and time duration of the pulses are similar, the Legacy can be seen to have the higher maximum acceleration. The four MPVs selected were the 2004 Chrysler Pacifica, 2002 Toyota Sienna, 2002 Honda Odyssey, and 2002 Ford Windstar LX. Table 2 shows the HIC values of these cars to be 642.3, 681.6, 611.1, and 627.0, respectively. In Figure 3, the highest and lowest HIC values are for the Toyota Sienna and Honda Odyssey, respectively, and the crash pulse curves show that although the area and time duration are similar, the Toyota has the higher maximum acceleration.
HIC value of Sedan crash tests.

HIC: head injury criterion; NHTSA: National Highway Traffic Safety Administration.

Comparison between Subaru Legacy crash pulse curve and Toyota Camry crash pulse curve.
HIC value of MPV crash tests.

HIC: head injury criterion; NHTSA: National Highway Traffic Safety Administration.
Comparison between Toyota Sienna crash pulse curve and Honda Odyssey crash pulse curve.
The four SUVs were the 2002 Nissan Xterra, 2002 Ford Escape XLS, 1999 Isuzu Rodeo, and 2000 Ford Expedition. From Table 3, the respective HIC values are 622.3, 643.3, 603.8, and 629.1. The Ford Escape XLS had the highest value and the Isuzu Rodeo the lowest. Figure 4 shows that although area and time duration of the crash pulses for these two cars are similar, the Ford has the higher maximum acceleration.
HIC value of SUV crash tests.

HIC: head injury criterion; NHTSA: National Highway Traffic Safety Administration.
Comparison between Ford Escape XLS crash pulse curve and Isuzu Rodeo crash pulse curve.
All of these curves resemble a semi-sine wave, with maximum acceleration being the key determinant of occupant head injuries.
Frontal crash test model
To confirm the feasibility of using crash pulse data to assess crashworthiness, the bumper and crossmember of the Ford Taurus were chosen for study. The vehicle FE model was developed by Federal Highway Administration (FHWA)/NHTSA National Crash Analysis Center, The George Washington University and based on the 1992 Ford Taurus model. The FE model of the Ford Taurus has 133 parts. A full-vehicle FE model, comprising 26,793 nodes and 5327 elements, was used for the frontal impact simulation. Based on FMVSS208, the car impacted a rigid wall in a 48.3 km/h (30 miles/h) frontal crash, as shown in Figure 5. In this study, the crash pulse was used to assess crashworthiness of a given vehicle design. Thus, a dummy model was not considered in this FE model of crash test. The crash pulse was measured and the curve shape was used to assess the crashworthiness of the vehicle based on section “Analysis of frontal crash pulse” conclusions. The curves of crash pulse are not smooth. According the guideline proposed in this study, we use average value of crash pulse curve to assess the crashworthiness of a given vehicle design.
Finite element model of frontal crash test.
Crashworthiness design based on crash pulse
Bumper design
Because bumpers absorb crash impact energy, their design and, especially, the materials from which they are made are important aspects of a vehicle’s crashworthiness. Accordingly, we focused on bumper material to test the value of crash pulse data in generating design recommendations.
The bumper used is shown in Figure 6. It is made of highly concentrated expanded polypropylene (EPP) and five steel alloys. The coefficients of these materials are shown in Table 4. A separate frontal crash simulation was conducted for each of the six materials. The crash pulses displayed in Figure 7 show that the average high acceleration value and the duration of high acceleration of Steel 1 are both greater than those of the original bumper, indicating that a bumper made entirely of this material would have a higher HIC value than the original bumper and, therefore, would be less crashworthy. However, the average values of high acceleration for Steel 2, Steel 3, Steel 4, and EPP are all lower than that of the original material, and the durations of high acceleration are also less. Thus, a bumper made entirely of any of these materials would have an HIC value lower than the original and be more crashworthy. The lowest HIC value was that for Steel 4, indicating that this material, which also had the greatest yield strength (986 MPa), has the greatest potential for maximizing the bumper’s contribution to overall vehicle crashworthiness and lowering the risk of occupant injury.

Finite element model of front bumper.
HIC values of various bumper materials.
HIC: head injury criterion; EPP: expanded polypropylene.

Comparison of the crash pulse curves of various bumper materials.
To verify these results, the simulations of frontal crash sled tests were conducted. The sled test model used herein is same as chapter 2. A dummy was equipped in the FE model of the sled test. The dummy HIC value is measured for assessing improvement effect on bumper. The resulting HIC values of the six types of bumper material are shown in Table 4. The HIC value of the original bumper material is 762.9, and that of Steel 1 is 1131.5. Those for Steel 2, Steel 3, Steel 4, and EPP are 641.2, 598.1, 568.0, and 667.0, respectively, all lower than that of the original and indicative of greater crashworthiness. That these results mirror those of the crash pulse simulations confirms the efficacy of the crash pulse–based method for assessing crashworthiness.
Crossmember design
A crossmember is a large metal beam, usually bent into an intricate channel shape, which transects the vehicle’s centerline to connect the two sides of the chassis and add strength to the body assembly. Crossmembers can also absorb crash impact forces and prevent foreign objects penetrating the body shell from below. We assessed two aspects of crossmember design: (1) to change crossmember thickness, and (2) to change number, location, and size of drilled holes on the crossmember.
Crossmember thickness
The FE model of the crossmember is shown in Figure 8. The thickness of the original material is 1.93 mm. The alternative thicknesses tested were 0.93 and 2.93 mm. The three crash pulse curves obtained from the test simulations (Figure 9) show the average acceleration of the thinnest crossmember to be higher than that of the original. Hence, a thinner crossmember is predicted to yield a higher HIC value. The average acceleration of the thickest crossmember is similar to that of the original, but the duration of acceleration is shorter, suggesting that a thicker crossmember would lower the HIC value and reduce the risk of occupant head injury. Increasing the metal thickness to 2.93 mm raises the overall car weight by 0.28%, but this value is not statistically significant.
Finite element model of the crossmember.

Comparison of the crash pulse curves of the crossmember with different thicknesses.
Similarly, the simulations of frontal crash sled tests were conducted to verify these results. The sled test model used herein is same as chapter 2. A dummy was equipped in the FE model of the sled test. The dummy HIC value is measured for assessing improvement effect on crossmember thickness. In the sled tests, the HIC value of the original crossmember was 762.9 and those for the 0.93 and 2.93 mm crossmembers were 1906.0 and 597.2, respectively, indicating that an increase in crossmember thickness effectively reduces HIC value. As described above, these results mirror those obtained from the crash pulse simulations, verifying the feasibility of using crash pulse curves to assess vehicle crashworthiness.
Holes in the crossmember
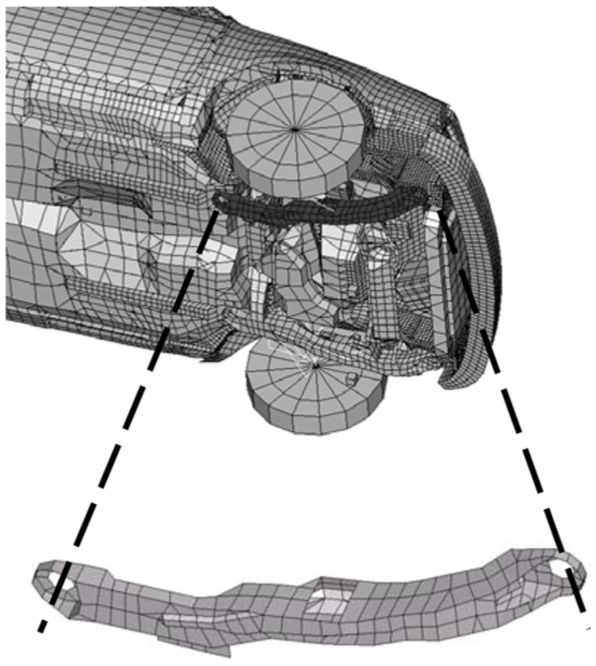
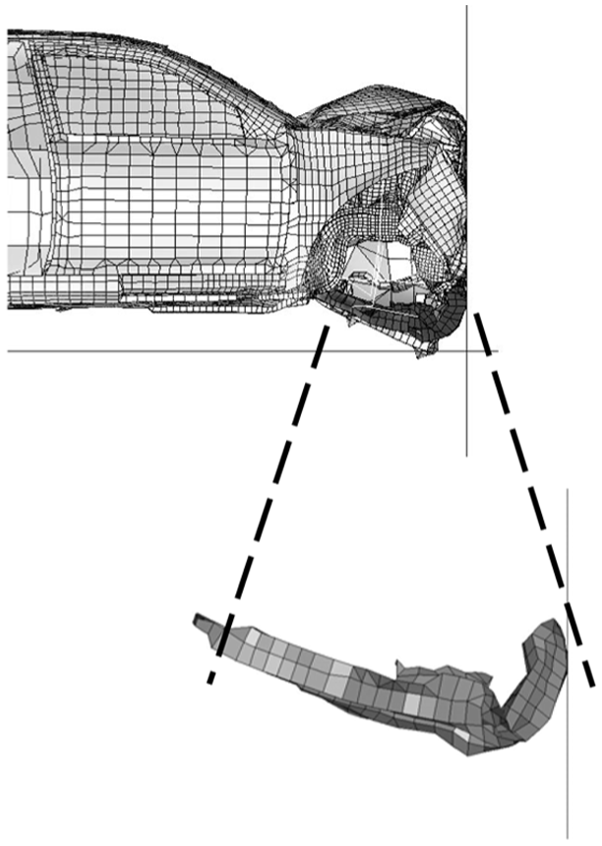
Figure 10 shows a crossmember taken from a crashed car. The sharp downward bend and relative lack of other deformation indicate that it did not absorb much energy during the incident. Strategically placed holes, however, induce greater deformation and, consequently, more energy absorption. Two patterns of holes were considered in this study. One, shown in Figure 11, has a hole in each of the four corners of the crossmember. The other has holes situated to be close to the ground surface, as shown in Figure 12. Frontal crash simulations were conducted for both patterns with an assumed metal thickness of 2.93 mm. The crash pulse curves displayed in Figure 13 show the average rate of acceleration of the corner-holed crossmember to be higher than that of the original. It would thus be predicted to yield a higher HIC value. The average rate of acceleration of the crossmember with holes near the ground surface is similar to that of the original, but the duration of acceleration is shorter, indicating a lower HIC value.
Crossmember after crash (lateral view).

First pattern: a hole in each of the four corners of the crossmember.
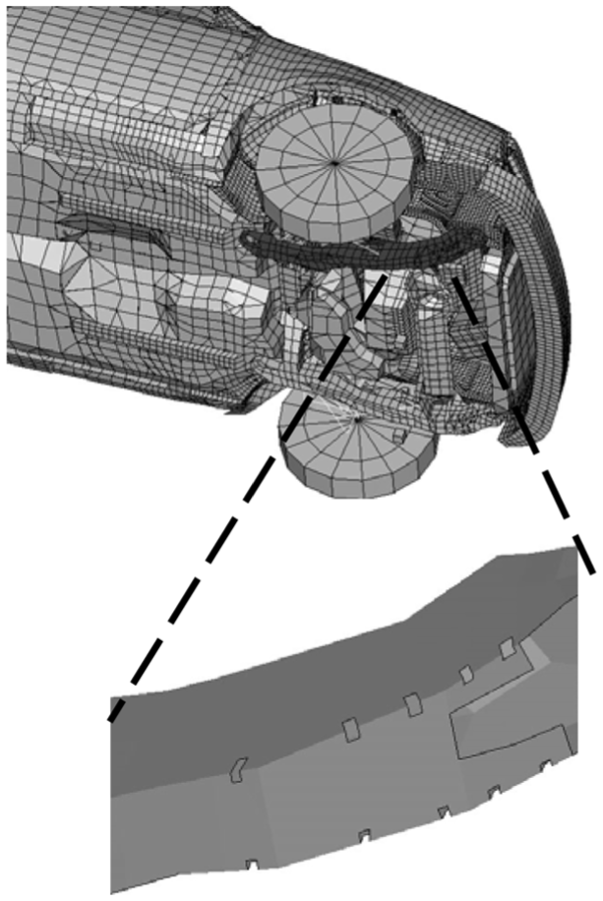
Second pattern: holes situated to be close to the ground surface.
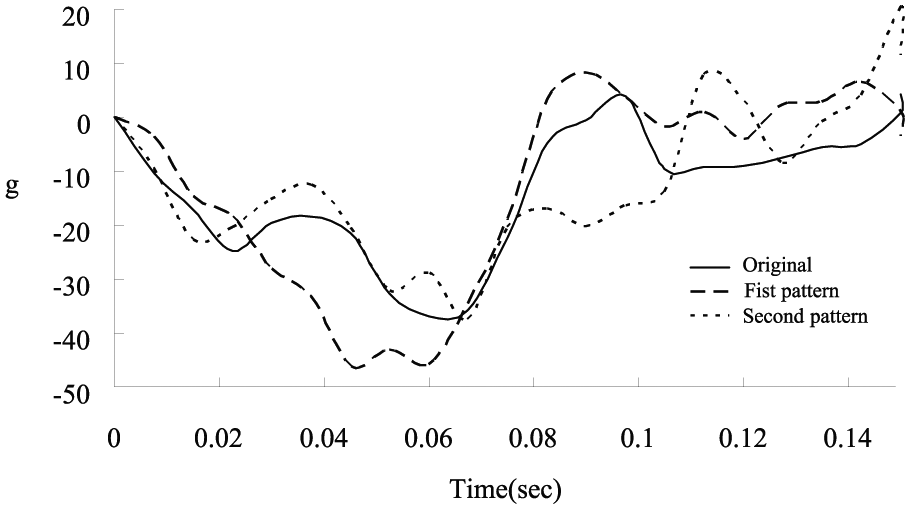
Comparison of the crash pulse curves in crossmember with holes.
Similarly, the simulations of frontal crash sled tests were conducted to verify these results. The sled test model used herein is same as chapter 2. A dummy was equipped in the FE model of the sled test. The dummy HIC value is measured for assessing improvement effect on crossmember with holes. In the sled tests, the HIC values of the three crossmembers were 762.9, 1989.0, and 547.1, respectively, making the crossmember with holes located near ground level the most crashworthy design. These results are in agreement with those obtained from the simulations, thus validating the use of crash pulse data to assess design safety.
Conclusion
The objective of this study is to demonstrate the feasibility of using crash pulse data to evaluate the crashworthiness of vehicle structures in frontal crash events. The dummy installation steps can be skipped entirely. It can quickly analyze the design improvement, especially in the early R&D stage. This study revealed a significant relationship between crash pulse curves and occupant injuries and demonstrated the feasibility of using crash pulse data to evaluate the crashworthiness of vehicle structures in frontal crash events. The results confirm the following findings:
If curve area and time duration are fixed, head damage is directly proportional to peak acceleration; if time duration and peak acceleration are fixed, head damage is directly proportional to curve area; if curve area and peak acceleration are fixed, overall duration is inversely proportional to both time of peak acceleration and head damage.
Crash pulse curves can be employed to assess the severity of occupant injury. Crash-pulse-based methods can effectively simplify the process of integrating crashworthiness into vehicle design.
Bumpers made of higher yield-strength materials prevent occupant head injuries more effectively.
Increasing crossmember metal thickness and placing holes in that part of the crossmember near the ground surface result in greater energy absorption during crash impacts and fewer occupant injuries.
Footnotes
Academic Editor: Crinela Pislaru
Declaration of conflicting interests
The author(s) declared no potential conflicts of interest with respect to the research, authorship, and/or publication of this article.
Funding
The author(s) received no financial support for the research, authorship, and/or publication of this article.