
Abstract
The popularity of big data from cell phone communication records makes cellular handoff probe system become an optimal choice for the collection of traffic speeds, especially for the large-scale freeway network. As a probe-based technique, the issues related to sample size are vital for the accuracy of cellular handoff probe system. Based on the current findings from simulation and field test, this study made an extensive discussion about the sample size problems using the field data. The subsequent investigation began with the correlation analysis between the sample size and the potentially influencing factors (the length of handoff link and traffic volume). Furthermore, a Weibull distribution model was set up to fit sample size for different handoff links. And then, the impact of sample size on the accuracy of cellular handoff probe system was following. Finally, based on the above explorations, several concluding remarks were presented as a reference for determining appropriate sample size to achieve high precision.
Introduction
The traffic state information is essential for the freeway traffic surveillance. In recent decades, the big data from the cellular wireless network provide an alternative for the collection of traffic state information. The studies1–4 investigated and validated the possibility of extracting the traffic state variables (i.e. travel time, speed, or volume) from the cell phone communication data. Compared with other types of data collection techniques, the cell phone–based probe technique has the advantage of large spatial and temporal coverage, low cost for the implementation and maintenance, and so on. For instance, the widely used fixed detectors are installed sparsely especially on the freeway of the developing countries, and thus, the spatial coverage of the spot measurements are really limited. Besides, the application of fixed detectors is costly. Other probe techniques (i.e. using global positioning system (GPS) 5 and Bluetooth 6 ) suffer from the low sampling rate on the freeway, which leads to the low accuracy and little coverage.
There are several kinds of cell phone probe–based techniques, that is, assisted global positioning system (A-GPS) method, angle of arrival (AOA) technique, time difference of arrival (TDOA) technique, handoff-based method, and cell phone activity data–based method.1,7–10 Among them, the cellular handoff probe system (CHPS) is extensively studied and tested for the collection of traffic speeds. A handoff event is one kind of cell phone communication records. It happens whenever an on-call phone moves from one cell tower’s area to the next.8,9 Travel time and average speed could be extracted directly using the handoff records and other geometric information. To evaluate the precision of CHPS, it is critical to explore three influential factors, which include the accuracy of handoff location, the consistency of handoffs, and the number of available handoff probes during a time interval at the handoff location. The former two factors are largely depending on the operation requirement of the wireless communication company, which are difficult to quantify in practice. Gundlegard and Karlsson 11 proved that the existing accuracy and consistency of handoffs are sufficient to estimate useful travel time. To some extent, these two factors will finally affect the generation of a valid probe, thereby influencing the third factor. Therefore, this study aims to take a further investigation into the third factor, that is, the sample size of the CHPS.
In the study of sample size issue, most works used the statistical sampling theory to figure out the minimum probes which are required to maintain the system accuracy.8,12–16 However, it is hard to determine the minimum sample size of CHPS in advance, because the procedure that CHPS generates valid samples is distinct from other probe-based methods such as GPS-based probe technique. In addition, the simulation tools and field tests are the alternative ways to test the appropriate sample size. For instance, different percentages of probe vehicles in the traffic flow were tested.1,16,17 Yang et al. 18 established a simulation platform to study the impact of the probe penetration on the accuracy of CHPS. Based on the simulation or field experiment, more investigation was conducted to study the factors affecting the sample size of CHPS, such as the length of handoff links and traffic volume. 10 However, numerical field test was conducted to explain the influence of traffic flow, the call duration, and the length of handoff link on sample size. 19 However, either the simulation or field experiments could not repeat the complexity of CHPS in the real world. So it is highly desirable to use field data to explore the sample size issues of CHPS more precisely and comprehensively.
The initial purpose of this study is to identify the impact of sample size on the accuracy of CHPS. And then several problems are analyzed step by step. First, what is the exact relation between the influential factors and sample size? Second, how to identify the distribution of the sample size under the influence of different factors? Third, what is the relation between sample size and the accuracy of CHPS? Finally, based on the previous investigation of problems, a summary to determine the appropriate sample size for CHPS will be presented. It is emphasized that all analysis relies on the field cellular signal data.
The remainder of this article follows the organization as section “The rationale of CHPS generating a valid sample” makes a brief explanation on how a valid sample is extracted using cellular signal data and shows the potential factors affecting the sample size. Section “Test bed” describes the test bed where the field data are from. Section “Analysis on the issues of sample size” presents the detailed analysis and assessment of the sample size problems. Finally, the principal conclusions are summarized, and future work is outlined in section “Conclusion.”
The rationale of CHPS generating a valid sample
Figure 1 shows a simple example that the CHPS tracks an in-vehicle and on-call phone. The shape of signal coverage for a cell tower (i.e. a base transceiver station (BTS)) is approximated by a hexagon as shown in Figure 1. Although the shape is irregular in reality, the hexagon is usually used for simplicity in the engineering. When a vehicle with an on-board and on-call phone (a mobile equipment (ME)) moves from a cell’s area to the adjacent cell’s area, a handoff event will happen to maintain the call continuity, and this event is recorded by the base station controller (BSC) as a record of wireless communication. To calibrate the location of handoffs on the roadway, several field tests are requested. 8 The roadway section between two adjacent handoff spots is nominated as the handoff link in this study. The space mean speed of a handoff link as shown in Figure 1 can be obtained by the following equation 10
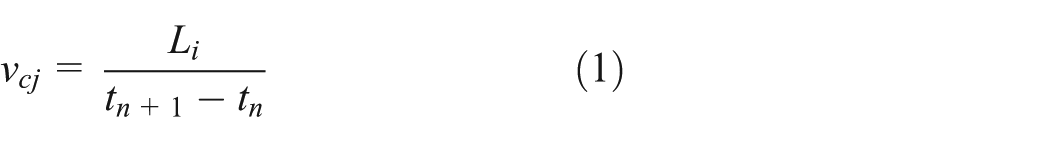
where

Use handoff probe system to track a vehicle. 10
In reality, the shape of a cell’s coverage varies in size depending upon the location, terrain, and signal capacity. And thus, the length of handoff link
Test bed
This section elaborates where, when, and how the field data are collected from Xi-Cheng Freeway. The collected data include three parts: first, the raw wireless communication data; second, the data from microwave sensors which are used as the ground truth in this study; and third, the geometric information of the freeway and the location of sensors and handoffs.
Freeway stretch and sensor and handoff location
The test bed is a 25-km freeway stretch of Xi-Cheng Freeway in Wuxi, Jiangsu, China, with three lanes in each direction as shown in Figure 2. In this study, only the northbound direction is studied. The locations of the handoffs on the freeway are measured by several field tests. Based on the handoff locations, the studied freeway is subdivided into 30 links, which are named as link1, link2, …, link30 opposite to the traveling direction. The length of each link is shown in Table 1. Two microwave sensor stations named as M1 and M2 are located at link6 and link21, respectively, as shown in Figure 2.
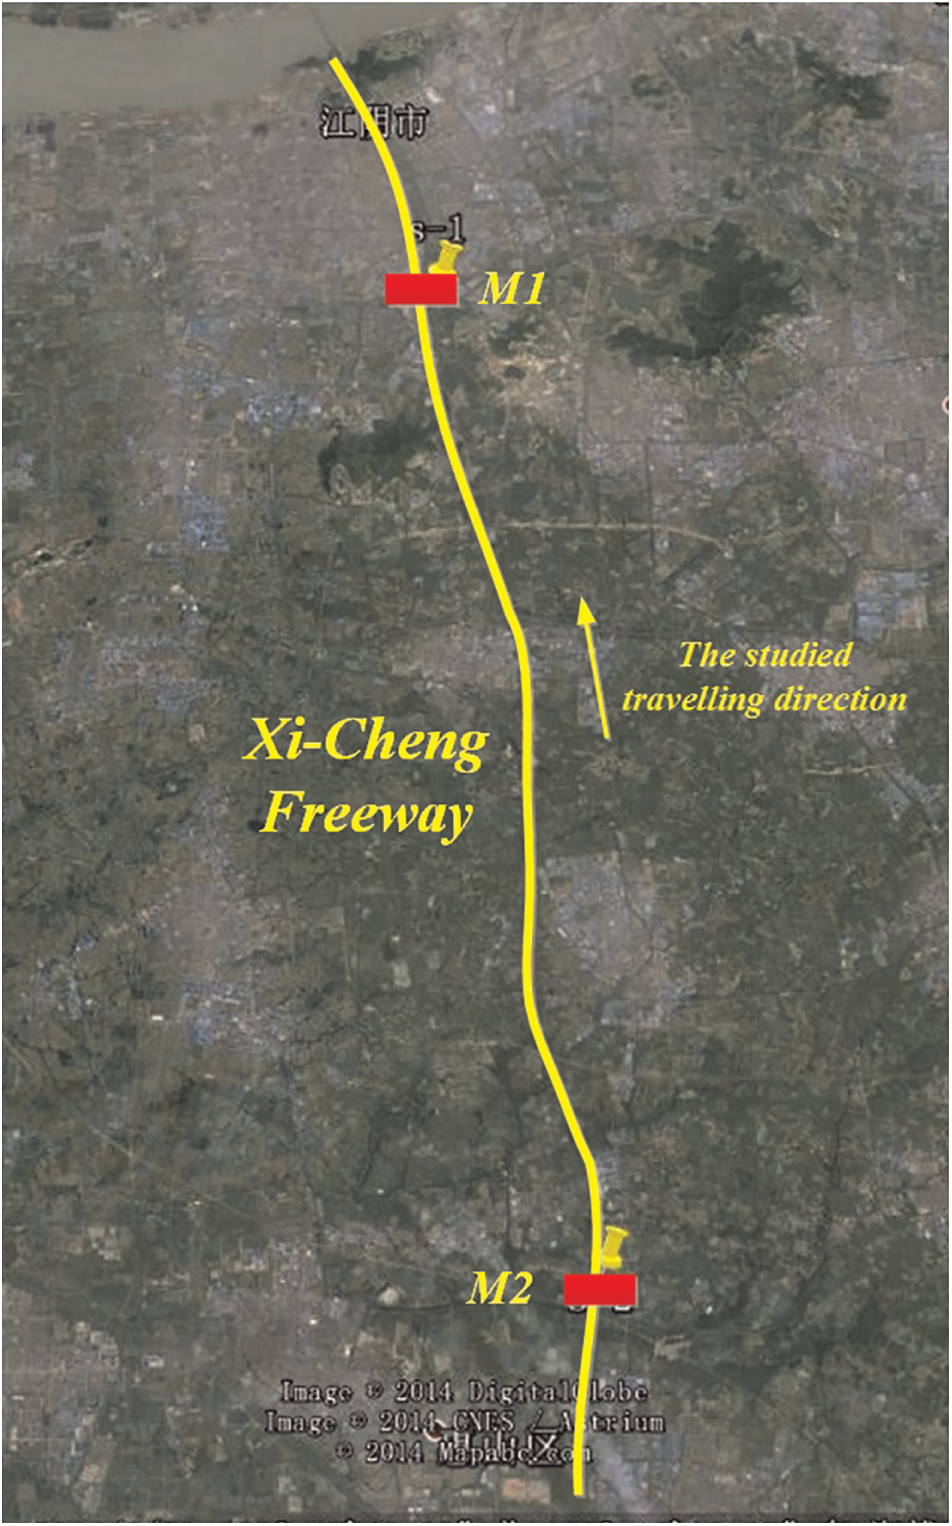
The geometry of studied freeway stretch and sensor locations.
The length of each handoff link.

Measurements
The data were collected from 8:00 to 10:00 and from 13:00 to 15:00 on 14 May 2014. The raw wireless communication data, mainly the handoff records include the encrypted ID of cell phone number (i.e. the unique ID of ME), the timestamp of handoff, and the corresponding ID of BSC and BTS. With the ID of BSC and BTS, the handoff location could be matched to determine the handoff link. And then, the timestamps and the length of handoff link were applied to calculate traffic speed of each sample using equation (1). The microwave sensor stations collected spot speeds and traffic volumes. All measurements were integrated and averaged in a time interval of 5 min. For instance, the speed measurements from CHPS and the microwave sensors were averaged every 5 min, while the handoff samples from CHPS and traffics from the microwave sensors were integrated by 5 min.
Analysis on the issues of sample size
The relation between the influential factors and sample size
The intuitive analysis indicated that the length of handoff link, traffic volume, and call duration have an influence on the sample size. 19 This study aims to take a further investigation into the correlation between these influential factors and sample size. Since the call duration belongs to the personal behavior and it also could not be extracted directly from the handoff records, it is absent in this study to avoid invasion of privacy. And the correlation analysis focuses on the length of handoff link, traffic volume, and sample size.
Measure of correlation
In order to measure the relation between different factors and sample size, the Pearson product-moment correlation coefficient (PPMCC) is utilized in this study. More specifically, the PPMCC between handoff link length and sample size, and PPMCC of traffic volume and sample size are used to indicate their correlations, respectively. The PPMCC can be calculated using equation (2), which divides the covariance of two variables by the product of their standard deviations

where r denotes the PPMCC, n is the total number of compared variables,
Generally, the stronger the linear association between the influential factor and sample size, the closer the PPMCC and will be either +1 (if the relation is positive) or −1 (if the relation is negative).
Impact of handoff link length on sample size
Based on an initial data process and analysis, it is found that only 16 links from the whole freeway stretch (30 links) steadily generated valid handoff samples, which are link5, link6, link7, link9, link10, link11, link12, link13, link14, link18, link19, link20, link22, link23, link24, and link27. The data collected from these links were applied in the correlation analysis between sample size and the length of handoff link. In a time interval, if there are valid handoff samples on a handoff link, then there will be a count of samples, that is, a sample size. In this study, the sample sizes from different time intervals on a link were integrated into two indexes. One is the average sample size (ASS), which denotes the average number of sample size generated by this link in a time interval. Another index is the total sample size (TSS), which is the total count of samples during the studied 4-h period. Figure 3 illustrates the distribution of ASS and TSS under different handoff links of different lengths. It could be inferred directly from Figure 3 that both ASS and TSS have a negative linear relation with the length of handoff link.

The distribution of sample size under handoff links of different lengths: (a) ASS versus handoff link length and (b) TSS versus handoff link length.
Furthermore, the results of PPMCCs (i.e. between ASS and handoff link length and between TSS and handoff link length) are −0.4388 and −0.5316, respectively. It is ensured that the increase in the length of handoff link has a negative impact on the sample size. According to the value of PPMCCs, the strength of this negative relationship is approximately strong. This finding is consistent with some existing research works.10,18,19 The PPMCC of TSS is larger than that of ASS, which indicates that the negative correlation becomes stronger with the growth of statistical time.
Impact of traffic volume on sample size
The analysis requests the “ground-truth” traffic volume and sample size, while only link6 and link21 could collect both the information. Therefore, this investigation was based on the data from these two links. It should be noted that link21 is not able to collect the handoff samples stably, and the absence of measurements frequently happened on link21. Figure 4(a) and (c) presents the sample size and traffic volume on link6 and link21, respectively. These figures do not show a close relation between the fluctuation of traffic volume and sample size over time. Figure 4(b) and (d) are the ratio of sample size to traffic volume on link6 and link21, respectively. It indicates that the ratio is mostly under 4% and its change is quite unstable. In other words, it will be difficult to establish a fixed relation model between sample size and traffic volume.

The distribution of handoff probe penetration: (a) the sample size from CHPS and traffic volume on link6, (b) the percentage of sample size to traffic volume on link6, (c) the sample size from CHPS and traffic volume on link21, and (d) the percentage of sample size to traffic volume on link21.
However, the results of PPMCCs between traffic volume and sample size are 0.0995 and 0.0137 on link6 and link21, respectively. It indicates that the correlation between traffic volume and sample size is positive but its strength is quite weak. Generally, the higher the traffic volume, the larger the sample size will be generated. 19 However, this study finds out that in a cell phone handoff probe system, the sample size is a random value. It means that the increase in traffic volume would not certainly result in the increase in sample size.
The distribution of sample size under different handoff links
Based on the previous analysis on the relation between the influential factors and sample size, it is evident that the length of handoff link has a more substantial impact on sample size than the traffic volume does. Therefore, we further explore the distribution of sample size under different handoff links in various lengths. As shown in Figure 5, the histogram in each subfigure presents the probability density of a certain sample size. Obviously, the sample size of four has a high probability, besides, the sample size of five, three, and six also frequently appear. Based on the shape of histogram, it is assumed that the sample size of each link follows a Weibull distribution. And then, the maximum likelihood was used to fit a Weibull distribution to the sample size of each link. The fitting line is shown in each subfigure of Figure 5. And the applied Weibull probability density function (PDF) is as follows

where x is the sample size, y is the probability density of sample size x, a is the scale parameter, and b is the shape parameter known as the Weibull slope.

The distribution of handoff probe sample size and the Weibull curve fitting.
The calibration results of parameters a and b for different handoff links are shown in Table 2. The variation of the parameter b is small, which indicates that the slope of Weibull distribution shape does not change much under different handoff link lengths. The scale parameter a indicates the change in the abscissa scale of the distribution. It means that if a is increased, while b remain the same value, the Weibull distribution get stretched out to the right and its height decreases. By comparing a under the different length of handoff links, it can be seen that the shorter handoff link has larger a. It also proves that shorter handoff link has a larger sample size.
The parameters of the Weibull distribution for different handoff links.

The relation between sample size and the accuracy of CHPS
Measures of the accuracy
The absolute difference (AD) shows the direct and physical differences between the speed measurements and the ground truth, while the relative difference (RD) could give an indication of how good a measurement is. Therefore, this study used both AD and RD to measure the accuracy of speeds from CHPS, and the speed measurements from microwave sensors were used as the ground truth. The AD and RD can be obtained from the following equations

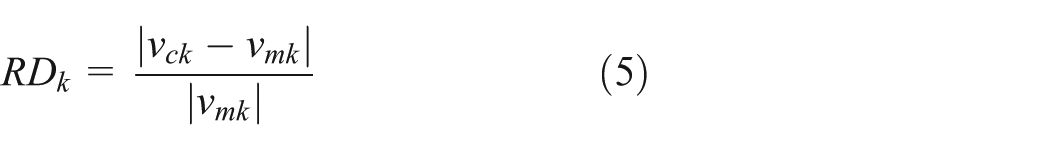
where
Correlation between sample size and speed accuracy
Figure 6 exhibits the results of AD and RD. As mentioned before, samples could not be generated stably on link21. It could also be seen from Figure 6 that the sample size per interval on link21 is smaller than that on link6. Besides, AD and RD of a sample size on link21 changed in a large range, which also indicated the instability of sampling on link21. Therefore, the following analysis on the relationship between sample size and the speed accuracy is based on the data from link6. Apparently, the sample size of zero shots the highest error. With the increasing of sample size, the average AD or RD are relatively stable. As shown in Figure 6(a), the average AD is below 20 km/h when there is one or more valid sample on link6. Meanwhile, the average RD is under 0.2. When the sample size is over six, it can be guaranteed that AD keeps below 20 km/h and RD is mostly under 0.2.

The speed accuracy: (a) absolute difference on link6, (b) relative difference on link6, (c) absolute difference on link21, and (d) relative difference on link21.
To further explore the relation between sample size and the speed accuracy, the PPMCCs of AD and sample size, and RD and sample size were calculated as shown in Table 3. It can be seen that both AD and RD have a negative correlation with sample size. Since the absolute value of PPMCC is below 0.5, the correlation strength between accuracy and sample size is moderate. It reflects that the increasing of sample size will improve the accuracy of CHPS in general.
PPMCCs of accuracy measurements and sample size.

PPMCC: Pearson product-moment correlation coefficient; AD: absolute difference; RD: relative difference.
Summary for determining a good sample size for CHPS
Based on the previous analysis and investigation, several experiential rules could be summarized in order to find out what kind of sample size could guarantee the accuracy of CHPS. The first rule is a general expertise that CHPS generates more samples on shorter handoff links. According to Figure 3, the handoff links in length below 1000 km are more likely to produce bigger sample size. Second, the sample size in different time intervals follows the Weibull distribution. In this study, three, four, five, and six samples per time interval appear most frequently. Third, the increase in sample size has a moderate and negative impact on the error of CHPS. And so, in this case study, sample size over six can keep the relative error below 20%. Fourth, the sample size with the high frequency of occurrence also makes small average errors.
Conclusion
Although the issues related to sample size of CHPS have been discussed in other works, this study made an effort to further explore some related problems using the field data and tried to make some contributions in the following aspects. First, previous studies were mostly based on the data from simulation or field test. Considering the complexity of the real-world application of CHPS, this study was based on the field data from a 25-km freeway stretch of Xi-Cheng Freeway, Wuxi, Jiangsu, China. Second, although two potential factors were supposed to have an impact on the sample size by other studies, this study found that the length of handoff link is a critical factor influencing the sample size, while traffic volume has a minor impact on sample size. Third, the findings of this study indicated that sample size in different time intervals followed a Weibull distribution. In this case study, the sample size of three, four, five, and six had a relatively high rate of occurrence. Moreover, the calibration of the Weibull distribution model for different handoff links shows that the scale parameter a had an interaction with the length of handoff link. With sufficient data, it is desirable to establish the general Weibull distribution model for different kind of handoff links (handoff links are grouped by length). And thus, these models represent the probability distribution of sample size under different handoff links. Fourth, the growth of sample size had a moderate and positive effect on the precision of CHPS. Larger samples size would keep the error under a low level, while the sample size with high occurrence also has a small average error. Finally, this study summarized the experiential rules from the data-driven analysis and investigation to determine the appropriate sample size for accurate CHPS.
Footnotes
Academic Editor: M Affan Badar
Declaration of conflicting interests
The author(s) declared no potential conflicts of interest with respect to the research, authorship, and/or publication of this article.
Funding
The author(s) disclosed receipt of the following financial support for the research, authorship, and/or publication of this article: This study was partially supported by the National Key Basic Research Development Program of China (no. 2012CB725405).