
Abstract
Ventricular assist device has been increasingly used in the treatment of end-stage heart failure, with a high incidence of hemolysis in clinical use, which is a serious problem to be solved. In this study, a complete set of continuous-flow ventricular assist device in vitro test platform for hydraulic performance and hemolysis was established. A self-developed continuous-flow ventricular assist device was employed, with the impeller being chamfered or unchamfered, respectively, to undergo the hydraulic performance and in vitro hemolysis tests, using computational fluid dynamics and a rheometer to investigate the influences of the shear stress on hemolysis. Computational fluid dynamics results showed that the shear stress of continuous-flow ventricular assist device with chamfered impeller was significantly decreased; as a result, the normalized index of hemolysis of the chamfered was reduced, demonstrating that lowering the shear stress of the impeller could significantly reduce hemolysis. Moreover, it was further confirmed by a fixed shear stress test. When the shear stress was greater than 100 Pa, the hemolytic effects were increased significantly. In standard operating conditions, lowering the impeller’s shear stress to less than 100 Pa could effectively reduce the hemolytic effects of ventricular assist device.
Keywords
Introduction
Congestive heart failure (CHF) is a common clinical manifestation of the vast majority of heart diseases and myocardial dysfunctions. Its incidence has drastically grown in the past 30 years, and 5.7 million new patients are diagnosed around the world each year, with a 5-year mortality rate of 52.6%.1,2 Although drugs, electrophysiology, and conventional surgical treatments show poor efficacy for the end-stage heart failure, heart transplantation is currently recognized as the most effective treatment for the end-stage heart failure. 3 However, due to the shortage of donated hearts, the implementation of heart transplantation is severely limited, and the world’s annual number of heart transplants remains at around 4000. 4 In this case, a large number of patients died of refractory heart failure because they failed to receive timely heart transplant. As a result, this greatly contributes to the development of ventricular assist device (VAD), which replaces heart transplantation in the treatment of intractable heart failure, as a transitional support during the waiting period for transplant, or a long-term or even lifelong support.
In the application of continuous-flow ventricular assist device (CF-VAD) for short-term and long-term clinical circulatory support, the incidence of hemolysis is still as high as 0.54%–18%, remaining a serious problem to be solved.5–12 In the circulatory assist, CF-VAD outputs blood flow in the non-physiological state. When the red blood cells (RBCs) pass through the blood pump, they may be damaged and hemolysis may occur, due to a series of mechanical factors, such as the mechanical shear stress and constant contact and collision with exogenous surfaces.13,14 In addition, RBC hemolysis is also related to the duration of exposure to a high shear stress. 15 Those studies are drawn on the basis of computational fluid dynamics (CFD) simulation, general in vitro hemolysis test with VAD, and with the well-defined shear stress created by concentric cylinder viscometers or capillary rheometers. Those studies highlighted the effect of shear stress on the hemolysis and determined the empirical equations to describe the effect quatitatively.16–19
In order to investigate the hemolytic effects of the shear stress on blood in a self-designed pump, a complete set of research platform for the in vitro hydraulic performance and blood physiology of CF-VAD was designed and built according to the ASTM F1841 standard practice from American Society for Testing and Materials (ASTM). Moreover, through VAD hydraulic performance test and in vitro hemolysis study, the relationship between the shear stress and hemolysis was discussed by combining CFD simulation and the use of rheometer.
Materials and methods
In vitro test platform of CF-VAD
The test platform for CF-VAD hydraulic performance and in vitro blood physiology test was designed and built strictly in accordance with ASTM F1841. 20 As shown in Figure 1, aluminum extrusions were employed to build the skeleton of the platform, and transparent plexiglass was used to separate the test platform into an experimental operation area and a measuring equipment area. A 60 cm × 30 cm optical plate was placed in the operation area, and the testing blood pump was mounted on a special bracket, which was fixed on the optimal plate, in order to prevent movement and vibration of the blood pump during operation, hence increasing its operational stability. Thermostatic water bath was placed at the rear of the test platform, to maintain the liquid temperature in the test loop. A scale column was put between the optimal plate and the thermostatic water bath, and the attached pendant thereon was used for hanging the reservoir sac during the test of hydraulic performance, or for maintaining a straight pipe or a constant height difference during the in vitro hemolysis and blood physiology experiments.

Hydraulic performance and in vitro blood physiology test platform. (a) Overall structure of the platform: the experimental operation area was on the left, for operations such as connecting test loop, placing thermostatic water bath, and sampling; the testing equipment area was on the right, for layering the experimental equipment, making it easy to observe and record; the two areas were separated by transparent plexiglass, preventing the liquid and steam in the water bath from affecting the accuracy of the device, while facilitating observations of the degree of the device. (b) Dash 4000 (GE) monitor. (c) Transonic TS410 ultrasonic flowmeter. (d) Computer blood pump speeding control interface. (e) Thermostatic water bath and test loop. (f) Experimental test loop. (g) OMEGA temperature sensor.
A monitor (Dash 4000, GE Healthcare, Chicago, IL, USA) and two sterile pressure sensors (disposable pressure transducer, SCW MEDICATH LTD, Shenzhen, China) were employed to measure the inlet and outlet pressures of the VAD. An ultrasonic flowmeter (Transonic TS410, Transonic Systems, Ithaca, NY, USA) equipped with a pipe clamp probe (Transonic ME-9PXL, Transonic Systems, Ithaca, NY, USA) was used for flow monitoring and was clamped on the outside of the pipe wall during the measurement, not in contact with the blood, to avoid affecting the hemolysis test results. A thermistor temperature sensor (DP25-TH-230, OMEGA Engineering Inc., Stamford, CT, USA) was employed to connect the thermal probe attached on the surface, sticking closely to the pipe wall at the blood pump’s outlet, so as to measure the fluid temperature inside the pipe, also avoiding additional hemolysis due to contact with blood.
VAD prototype pump
In this study, a self-designed and self-developed prototype left ventricular assist device (LVAD) system was used, consisting of a centrifugal blood pump, a motor, a control device, and a power supply system (Figure 2). The centrifugal blood pump was composed of the front cover, the impeller, and the rear cover, all of which were made of titanium alloy through fine processing. The clearance between the vanes and housing is 0.2 mm. The impeller comprised five vanes and was fixed to the rear cover by bearings. A flushing hole ran through the impeller near the guide cone between every two vanes to prevent the formation of slow flow area between the impeller and the rear cover, so as to avoid thrombosis. The impeller contained a permanent magnet, mutually attracting to the permanent magnet in the driving wheel to form a magnetic coupling structure. The impellers were processed chamfered and unchamfered to provide different shear stress environments.

Structure and assembly of the centrifugal LVAD pump for test: (a) the impeller structure with unchamfered vanes, (b) the impeller structure with chamfered vanes, (c) permanent magnet inside the impeller, (d) assembly of centrifugal pump and structure of fixed bracket, (e) centrifugal pump’s front cover, the impeller’s structure, and the rear cover, and (f) internal structure of the front cover and the side assembly structure of the rear cover.
CF-VAD hydraulic performance test loop and experiment methods
In the VAD hydraulic performance test loop, polyvinyl chloride (PVC) circulation pipe of 2 m in total length and of 3/8 in in diameter was used to connect a 400-mL reservoir sac and a VAD system into a closed loop, keeping the VAD’s inlet and outlet ends about 1 m of pipe from the reservoir sac (Figure 3). The measuring probes of the two pressure sensors were located 10 cm from the blood pump’s inlet and outlet, respectively. The probe of the ultrasonic flowmeter was located 30 cm from the outlet of the blood pump. The reservoir sac was hung 50 cm above the blood pump, and the pressure sensor and the flow probe were maintained on the same horizontal plane with the blood pump’s inlet and outlet. The screw clamp was placed between the flow probe and the reservoir sac, for adjusting the afterload of the blood pump. The fluid in normal circulation is blood. However, in the hydraulic performance test, some extreme performances of the blood pump should be determined, which might significantly affect the blood cells, leading to changes in properties inside the blood and thus failure to maintain the accuracy of the test. For this reason, an alternative solution was needed for the hydraulic performance test. At a room temperature of 24°C, glycerol solution with a volume ratio of 37% showed similar density and viscosity with the blood and was used as a test solution in the VAD hydraulic performance test.21–23
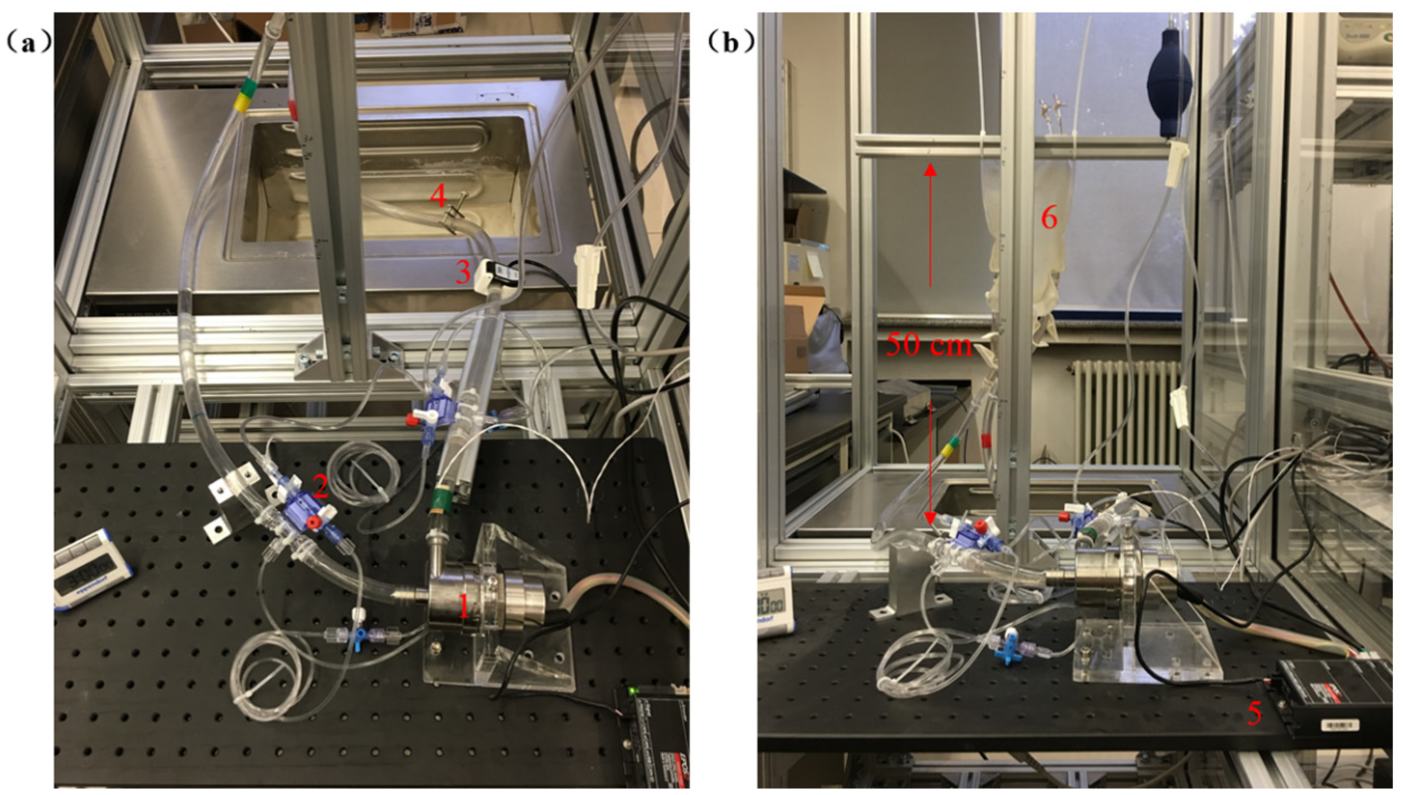
(a) VAD hydraulic performance test loop (blood pump side): 1: testing blood pump, 2: pressure sensor and probe, 3: ultrasonic flowmeter probe, and 4: screw clamp and (b) VAD hydraulic performance test loop: 5: controller and 6: reservoir sac.
A 500 mL of 37% glycerol solution was injected into the test loop for VAD pump hydraulic performance, and the air remaining in the loop was drained. When the blood pump, the pressure sensor at the blood pump’s inlet and outlet, and the corresponding pressure probe were in the same plane, the blood pump’s outlet pressure was equal to the inlet pressure, and the head was recorded as 0 mmHg. The speed of the blood pump was adjusted and fixed at 1000 r/min, the screw clamp was fully opened, and the output flow of the blood pump was the maximum under the current speed. The flow and the corresponding blood pump’s inlet and outlet pressures were recorded, and the head was calculated and denoted as the first measurement point under the current speed. Then, the screw clamp was gradually tightened, the blood pump’s flow gradually decreased, and the afterload gradually increased. A measurement point was set each time the flow dropped by 0.5 L/min, until the screw clamp was fully closed and the flow dropped to 0 L/min. After the test was finished at one speed, with 500 r/min as the gradient, the VAD’s speed was set and maintained at 1500, 2000, 2500, 3000, 3500, 4000, 4500 and 5000 r/min, respectively, while repeating the above procedures. The hydraulic performance data of the unchamfered and chamfered pumps were measured, and the hydraulic performance curve was plotted for comparison.
CF-VAD in vitro hemolysis test loop and hemolysis performance test
The in vitro hemolysis test platform was designed and built in accordance with ASTM F1841 standard test procedures. In the test loop, PVC pipe of 2 m in total length and of 3/8 in in diameter was used to connect a 400-mL reservoir sac and a LVAD system into a closed loop, keeping both the VAD’s inlet and outlet ends about 1 m of pipe from the reservoir sac (Figure 4). The blood pump’s bracket was fixed on the test plate to prevent influences of vibration on the blood pump’s operational stability. The measuring probes of the two pressure sensors were connected to the 3/8 in in vitro circulation joints with side holes, and to the loop in series, keeping the two probes 10 cm from the blood pump’s inlet and outlet. The probe of the ultrasonic flowmeter was located 30 cm from the blood pump’s outlet. Thermostatic water bath maintained the temperature at 37°C, and the reservoir sac was immersed in the thermostatic water bath, as well as the one in the control group. Moreover, the reservoir sac was prevented from clinging to the inner surface of the water bath, preventing hemolysis caused by local overheating. The pipeline alignment of the blood pump’s inlet and outlet were adjusted, in order to eliminate the impacts of turning on the flow state of blood within the pipe. The pressure sensor and the flow probe were maintained in the same plane with the blood pump’s inlet and outlet. The screw clamp was placed between the flow probe and the reservoir sac, for adjusting the afterload of the blood pump.

VAD in vitro hemolysis test loop. (a) In vitro hemolysis test loop (blood pump side): 1: testing blood pump, 2: pressure sensor and probe, 3: ultrasonic flowmeter probe, 4: thermostatic water bath, 5: screw clamps, and 6: controller and (b) in vitro hemolysis test loop (blood storage bag side): 7: blood storage bag in the test group, 8: blood storage bag in the control group, and 9 and 10: hanging bracket.
Sheep blood used for test was collected, transported, and stored strictly in accordance with ASTM F1830 24 requirements. Disposable 500-mL sterile PVC reservoir sac, which was pre-filled with 50 mL of citrate phosphate dextrose adenine (CPDA-1) as blood preservation solution, was used for blood collection. Healthy adult male sheep were selected for the test, aged around 4 years, weighing about 80 kg, and fasted for 12 h before blood sampling. All operations in the blood collection process strictly complied with sterile standard practice. The sheep for blood sampling was fixed in left lateral position on the operating table and immobilized. The right jugular vein was fully revealed by removing the hair covering thereon. Povidone-iodine was used to carry out adequate disinfection, inside out from the blood collection point, with a disinfection radius of about 5 cm, and the disinfection was repeated three times, with each time not exceeding the previous range. The large aperture sterile needle (16G) coming with the blood bag was penetrated into the disinfected area at the sheep’s jugular vein, allowing the blood to naturally flow into the reservoir sac and avoiding hemolysis caused by negative pressure. A total of 500 mL of blood and CPDA-1 mixture was collected and thoroughly mixed at a ratio of 1:9. During the collection process, the blood bag should be gently shaken to ensure that the fresh sheep blood was well mixed with the blood preservation solution. Meanwhile, it should be noted that vigorous shaking should be avoided to prevent hemolysis caused by blood damage. The collected fresh sheep blood was stored and transported at 2°C–8°C, and the time interval from blood sampling to the experiment should be controlled within 12 h.
Before the experiment, the VAD hemolysis test loop was filled with sterile phosphate-buffered saline (PBS) buffer. Then, the blood pump was running at 2000 r/min for 10 min. After the surface in contact with the blood was sufficiently wetted, the PBS buffer was drained from the loop. A 500 mL of CPDA-1 and the freshly collected sheep blood mixture was placed in the thermostatic water bath at 37°C for rewarming. Transfusion with microfilter plug was used to slowly infuse the test blood into the test loop, while the air in the loop was fully drained, to prevent hemolysis from being exacerbated by the residual bubbles, which could affect the accuracy in measuring the pressure and flow. Before the start of the experiment, RBC hematocrit (HCT) was measured in both the test and control groups. According to the results of hydraulic performance test, the blood pump was initiated and the blood pump’s speed was set at 4400 r/min. The screw clamp was adjusted to keep the blood pump’s flow at 5 L/min and head at 100 mmHg. The experiment lasted for 6 h; before the blood pump running and 1, 2, 3, 4, 5, and 6 h after the blood pump running, blood samples were drawn from the reservoir sac in both test and control groups. After centrifugation, the supernatant was taken for measuring the concentration of plasma free hemoglobin (FHB). Each group of hemolysis experiments was repeated three times, and normalized index of hemolysis (NIH) of chamfered and unchamfered pump were calculated.
Damages of shear stress to RBCs
To further investigate the relationship between the shear stress and hemolysis, a rheometer (MCR310, Physica, Austria) and the supporting coaxial cylinder detection mold CC27/E were employed to observe the damages of different shear stresses to RBCs. Through methods similar to that of the in vitro hemolysis test, the fresh sheep blood samples were pretreated. Before the experiment, a 37°C thermostatic water bath was used to rewarm and bath the sheep blood. After calibration of the instrument, the gap between the rotor and the cylinder was set as 0.5 mm, at test temperature of 37°C. The testing shear stresses were set to 0, 25, 50, 75, 100, 125, and 140 Pa, and 6 mL of blood samples were placed in the experimental equipment, which was operating under corresponding shear stress for 10 min. Each shear stress of hemolysis experiments were repeated three times. Centrifuged supernatant plasma was taken for measuring the concentration of plasma FHB, and the curve of shear stress and FHB concentration was plotted.
Results
Platform detection and hydraulic performance test
The measured value at each measurement point was plotted into the curve of hydraulic performance, which showed that the chamfered and unchamfered pumps shared similar hydraulic performance (Figure 5). The operating conditions for the hemolysis performance test were simulated, and the rotational speeds of both chamfered and unchamfered pumps were 4400 r/min, with a flow of 5 L/min. The head of the chamfered pump was 98 mmHg, while that of the unchamfered pump was 100 mmHg. Compared to the unchamfered pump, the H-Q of chamfered pump was some performance degradation with 2 mmHg declining. In in vitro hemolysis tests, according to the ASTM F1841, we controlled the rotation speed and output flow rate strictly, the head of both chamfered and unchamfered pumps fluctuate in a small range at 100 ± 3 mmHg, and the H-Q difference induced by chamfering processing was in the fluctuation range. Therefore, the hydraulic performance of the two pumps was similar in vitro hemolysis tests.

Hydraulic performance curves of chamfered and unchamfered pumps.
Hemolysis performance test and influences of changes in shear stress on hemolysis
Results of hydraulic performance test proved that there was similarity in hydraulic performance between the chamfered and unchamfered pumps. Therefore, in the in vitro hemolysis test, by measuring the FHB value of T0-T6 and drawing the curve of FHB concentration changes over time, the impeller’s shear stress differences were calculated through CFD simulation, directly reflecting the damages of VAD pump to RBCs caused by different shear stresses. The curve of FHB values in the in vitro hemolysis test (Figure 6) indicated that the hemolytic effects of the unchamfered pump on RBCs were significantly higher than that of the chamfered pump. The value of HCT was ranging from 31% to 35%. NIH of chamfered pump was calculated as 0.0011 ± 0.0005 mg/100 L, and NIH of unchamfered pump as 0.0278 ± 0.0125 mg/100 L, indicating that the chamfered VAD impeller could reduce the hemolytic effects on RBCs. The VAD was modeled and simulated using a commercial software ANSYS CFX (ANSYS Inc., Canonsburg, PA, USA), with a mesh number of 3.1 million. Blood was assumed to be a Newtonian fluid with a density of 1050 kg/m3 and dynamic viscosity of 0.0036 Pa s. Standard k-epsilon turbulence model with standard wall function were used to simulate the turbulent flow inside the pump. Inflow rate was specified at the inlet of the pump, while “fully developed flow” was used as an outlet boundary condition, which specifies zero gradient of fluid velocity at the outlet. Compared with CFD (Figure 7), at rotational speed of 4400 r/min, head of 100 mmHg, and flow of 5 L/min, the shear stress on the edge wall of the unchamfered pump’s impeller was dramatically higher than that of the chamfered one. The simulated shear stress was greater than 100 Pa, with a maximum shear stress greater than 150 Pa. Meanwhile, the shear stress distribution in the flow field of the VAD pump was calculated by CFD (Figure 8), suggesting that the surface of chamfered pump was smooth with an uniform shear stress distribution, while the unchamfered pump had an obvious high stress region. The volume ratio of the unchamfered pump under high shear stress was significantly greater than that of the chamfered pump. Therefore, combining with the NIH values and CFD calculated results, it was found that lowering the shear stress of the impeller, especially the maximum shear stress, could effectively reduce the hemolytic effects of VAD on the RBCs.

Curve of changes in plasma free hemoglobin in VAD pump with 5 L/min flow and 100 mmHg head: (a) curve of hemolysis performance test of chamfered pump and (b) curve of hemolysis performance test of unchamfered pump.
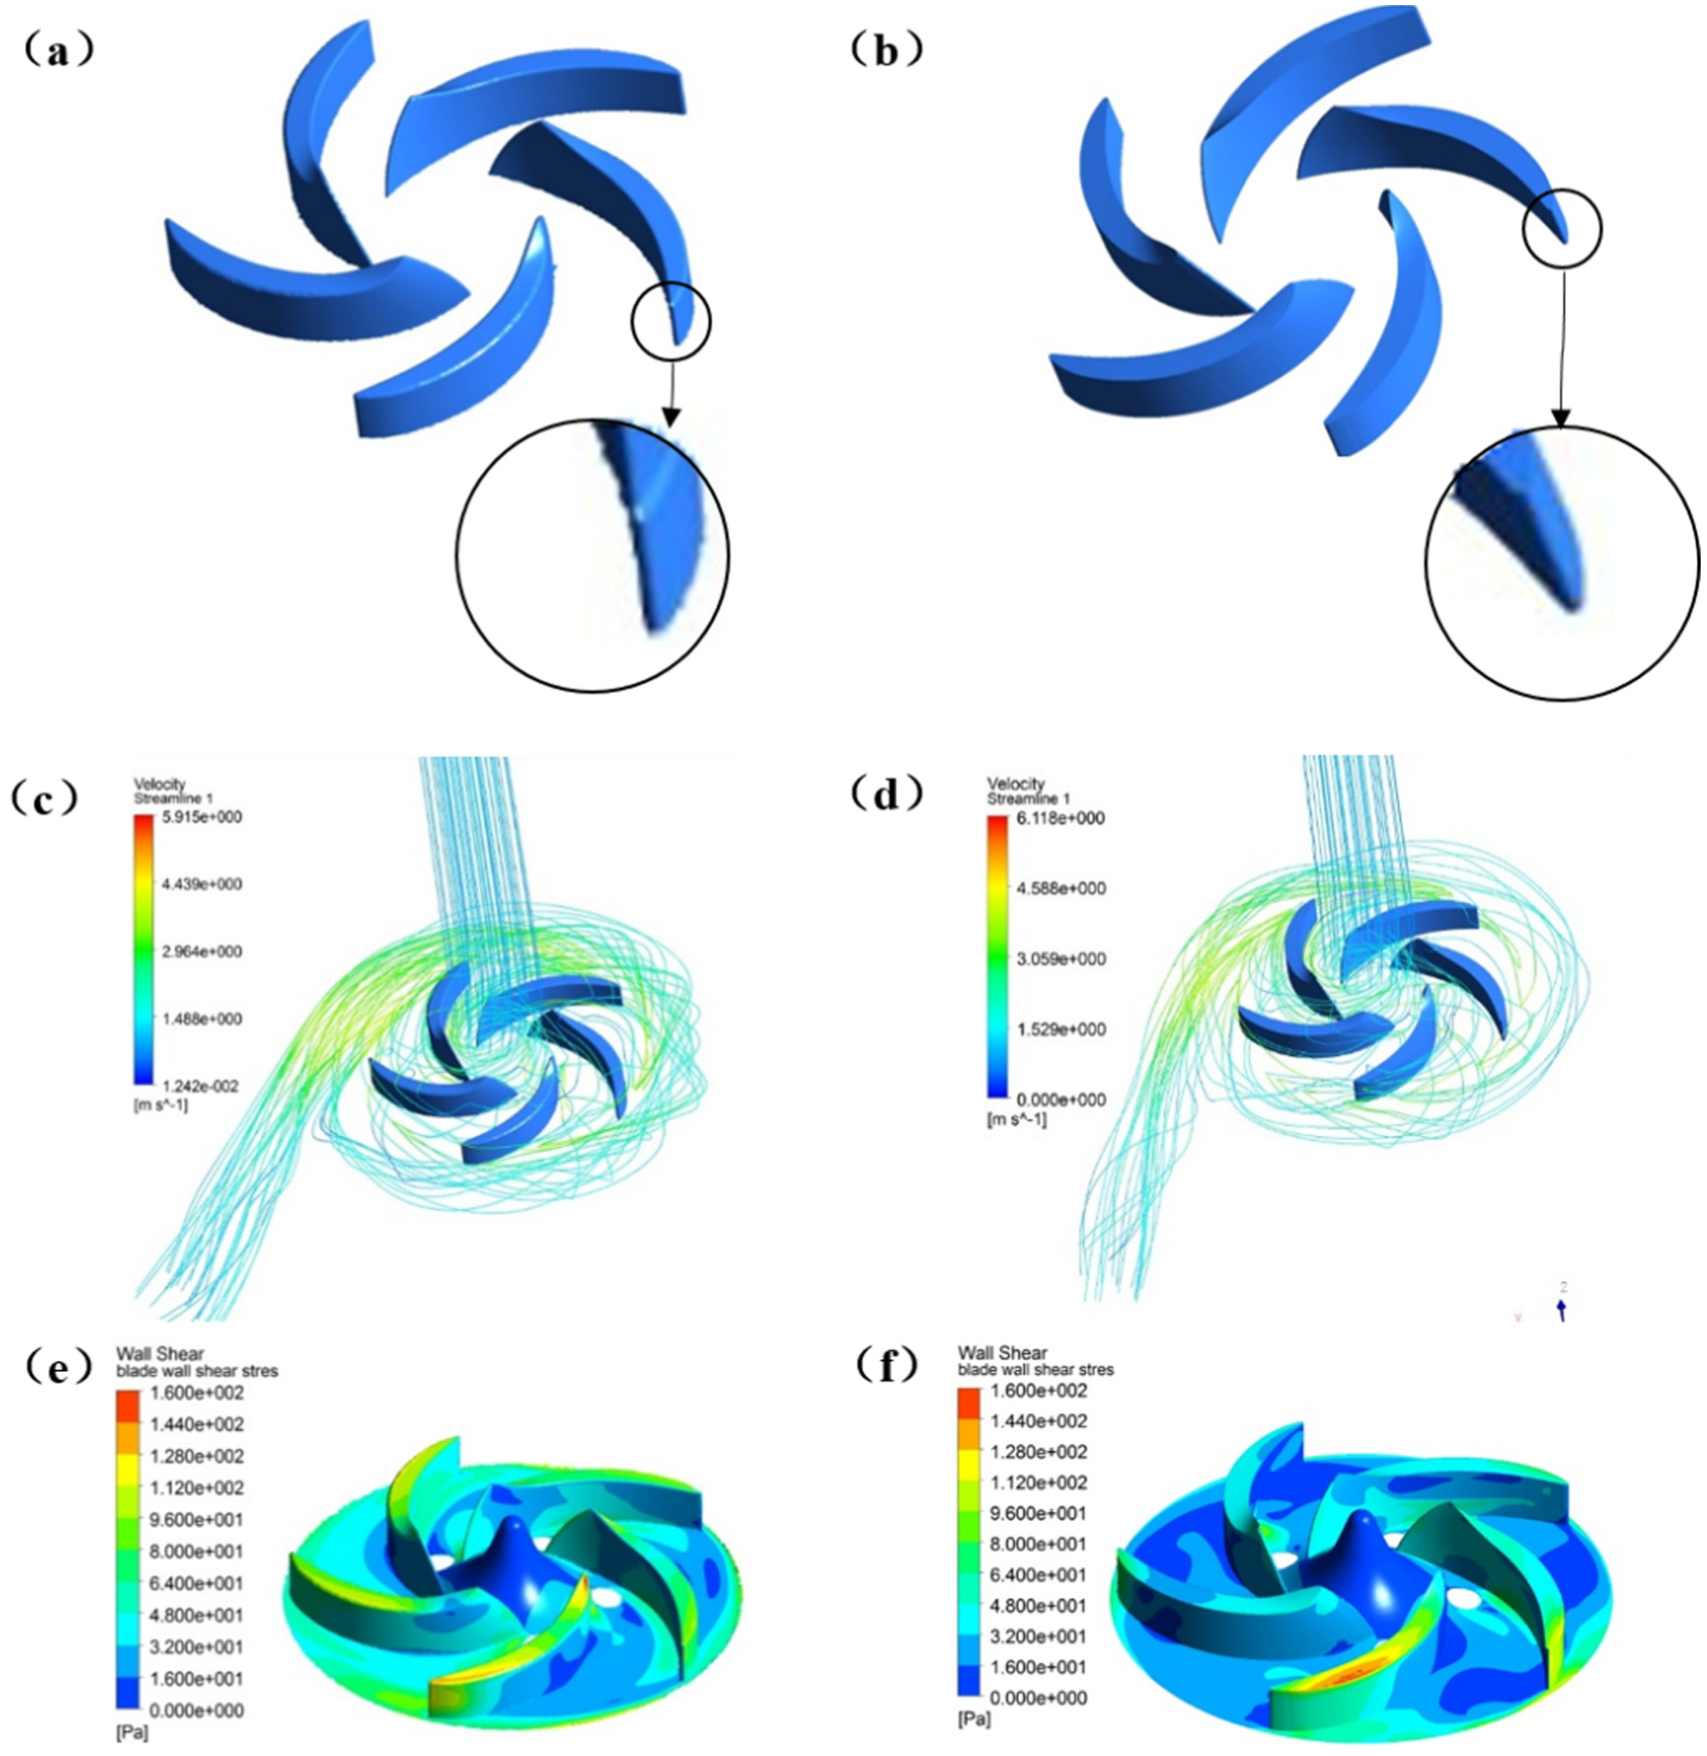
Flowcharts of chamfered and unchamfered pumps and shear stress on the impeller’s wall simulated by CFD: (a) modeling of chamfered pump’s vanes, (b) modeling of unchamfered pump’s vanes, (c) flowchart of chamfered pump, (d) flowchart of unchamfered pump, (e) shear stress on the wall of chamfered pump’s impeller, and (f) shear stress on the wall of unchamfered pump’s impeller.

Ratio of shear stress in the flow field simulated by CFD.
Shear stress and hemolysis
In the VAD in vitro hemolysis test, it was found that reduction of the impeller’s shear stress could effectively reduce the hemolytic effects caused by VAD. To further investigate the relationship between the shear stress and hemolysis, the rheometer was adopted to quantify the impact of the shear stress on hemolysis, under limited shear stress and exposure time, while excluding the other factors. The viscosity of the testing blood ranged from 0.0033 to 0.0038 Pa s. The concentration of FHB in the plasma samples under different shear stresses was detected (Figure 9), suggesting that with the increase in shear stress, the concentration of FHB gradually rose and that there was a positive correlation between the shear stress and damages to RBCs. At the same time, it was found that when the shear stress was less than 100 Pa, FHB increased mildly, indicating that the damages were not significant enough to injure a large number of RBCs; when the shear stress was greater than 100 Pa, FHB increased drastically, suggesting that the shear stress exceeded the tolerance threshold of the RBC membranes, thereby damaging a lot of RBCs and releasing the hemoglobin in the cytoplasm.

Curve of changes in shear stress and plasma free hemoglobin concentration.
Discussion
As a complementary and alternative means of the heart’s pumping function, VAD, especially the implantable type, should be put in the body for long-term assisted circulation, maintaining normal blood pressure and effective perfusion into the brain and other vital organs. Hence, it is highly demanded in effectiveness, security, and stability. Before clinical testing and the use, comprehensive and detailed evaluations, including blood pump hydraulic performance test, hemolysis performance test, durability test, and animal experiments, must be carried out on the blood pump, to detect and fix the potential problems. Except animal experiments, the remaining tests are required to be performed on the in vitro test platform, so the performance of the test platform directly determines the accuracy and reliability of the tested data of the blood pump. However, by comparing the in vitro test platforms among various institutions, we found that the VAD in vitro test device is simply established, lacking uniformity and standardization. In the absence of a standard VAD in vitro test platform, the accuracy and stability of the tested data could not be guaranteed, which is not conducive to horizontal contrast of the detection and research data. The in vitro test platform of CF-VAD designed and built in this study was divided into an experimental area and an equipment area, separated by transparent plexiglass. In particular, the test loop was placed in the experimental area, while the electrical and measuring equipments were placed in the equipment area, to avoid equipment damage, and the detection accuracy was affected by the operations or liquids during the experiment. Meanwhile, during the experimental operation, the measurements could be observed through the plexiglass in real time, facilitating the adjustment of the loop’s operating conditions and parameters. The test platform used industry-recognized detection equipment of gold standard, and the specifications and connection parameters of the consumable items were determined during the design and construction process. Furthermore, the connection method of the test loop, the formulation of the test liquid, the collection, storage, and transportation conditions of the blood, and the experimental procedures were standardized to ensure the accuracy and repeatability of the tests. Through hydraulic performance test and in vitro hemolysis study of VAD, we found that the test platform had good measuring stability, providing a standardized test environment for detecting and evaluating the hydraulic and hemolysis property of the CF-VAD.
During the circulatory assist by VAD, when the RBCs pass through the blood pump, they are subject to the shear stress in non-physiological state and thus injured, leading to morphological changes, cell dysfunction, and shortened life expectancy of RBCs due to damaged cell membrane. When the mechanical shear stress imposed on the RBC membranes exceed their elastic threshold, the RBC membranes will rupture and cause hemolysis or form holes in the cell membrane, thereby releasing the hemoglobin within RBCs into the plasma to increase the concentration of the plasma FHB. 25 Meanwhile, except the imposed mechanical shear stress, extending the time the RBCs are exposed to high shear stress will also result in hemolysis. 15
By comparing the CFD calculations of the two similarly designed VAD pumps with different shear stresses, it was found that the maximum shear stress of the chamfered impeller on the RBCs was significantly lower than that of the unchamfered impeller. In standard operating conditions, the shear stress of the chamfered pump on RBCs were primarily distributed below 80 Pa, while only the shear stress imposed close to the outlet on the impeller’s outer edge was relatively higher, of about 100 Pa; however, the shear stress at the central part of the unchamfered pump was similar to that of the chamfered one, but the shear stress imposed close to the outlet on the impeller’s outer edge was significant higher than that of the chamfered pump, as the shear stress was greater than 140 Pa, with a maximum value close to 160 Pa. FHB concentration and NIH values at each time point in the in vitro hemolysis test indicated that lowering the impeller’s shear stress could effectively reduce the hemolytic effects resulting from the damages of VAD to RBCs. However, the internal flow field of VAD was not evenly distributed, and it was difficult to quantify the hemolytic effect induced by shear stress. Therefore, the coaxial cylinder rheometer was applied to create well-defined flow fields. According to the findings of the relationship between the fixed shear stress and hemolysis, when the RBCs were subject to shear stress greater than 100 Pa, plasma FHB concentration was significantly increased, indicating that the shear stress on RBC membranes exceeded their tolerance threshold, leading to a large number of RBC hemolysis. Through CFD numerical simulation, laser Doppler velocimetry, particle image velocimetry, and VAD shear stress study, it was found that when the shear stress was greater than 150 Pa, hemolysis was significantly higher.26–29 In the rheometer hemolysis tests, we found that hemolysis significantly increased when the shear stress is more than 100 Pa, rather than a previous finding 150 Pa, which might be induced by a non-uniform shear stress field in the rheometer, created by Taylor vortices as reviewer proposed. Meanwhile, fresh sheep blood was used for the in vitro hemolysis test, as its RBC brittleness is lower than those of human blood, bovine blood, and pig blood. 30 Therefore, based on the experimental results, we found that at the impeller’s design stage, if the impeller’s shear stress was calculated by CFD simulation and the maximum shear stress was lowered to less than 100 Pa, within the same exposure time of the blood cells, the damage of the impeller to the RBCs could be effectively reduced, thereby enhancing the hemolysis performance of the VAD. As the flow condition in VAD was complicated, combined with the hemolysis tests of LVAD and rheometer, we considered that the maximum shear stress less should be less than 100 Pa in order to strictly avoid hemolysis in the VAD.
It should be noted that this study is focusing on the effect of the shear stress magnitude on the hemolysis. The detailed mechanism of the shear stress on the blood cell damage will be studied in the future. Shear stress can be induced by laminar flow and turbulent flow. Turbulence predominates the flow field in the blood pump, especially when the pump is running at a high spin speed. In turbulent flow, the vortex size distributes in a range; what size or frequency of the vortex induces the hemolysis the most is still a question. In the future, we will use large Eddy simulation or direct numerical simulation as a CFD method to simulate the blood flow, in order to investigate the effect of turbulence on hemolysis.
Conclusion
Within the same exposure time of the RBCs, with the increase in the shear stress, the damages of the VAD pump to the RBCs showed a growing trend. Controlling the impeller’s shear stress to less than 100 Pa could effectively reduce the hemolytic effects of the VAD.
Footnotes
Academic Editor: Nicolas Garcia-Aracil
Declaration of conflicting interests
The author(s) declared no potential conflicts of interest with respect to the research, authorship, and/or publication of this article.
Funding
The author(s) disclosed receipt of the following financial support for the research, authorship, and/or publication of this article: This research was supported by the independent research fund of Tsinghua University (no. 20141081265).