
Abstract
Recently, the development of displays requires large, thin glass substrates, and air film conveyors equipped with porous pads have been developed to transport the substrates in a noncontact state. In this study, a contactless air film system with aligned porous pads is proposed. Experiments and analysis of its basic characteristics are conducted. First, it is confirmed that the flow rate characteristics of the porous pads can be represented by a modified Forchheimer equation with the determined permeability and inertial coefficient. Then, a theoretical model based on the Reynolds equation is established to analyze the film pressure distribution. The results indicate a parabola-like shape distributed along the radial direction in the porous area and an approximately linear curve in the periphery area. Furthermore, the experimental results indicate that the bearing force and static stiffness increase if the clearance decreased with a given flow rate. Finally, a numerical calculation performed by solving the coupling equation of elasticity and the modified Reynolds equation shows an approximate quadratic shape in the deformation, and the experimental results supported this to a certain extent.
Introduction
In semiconductor manufacturing, fragile equipments, such as silicon wafers and glass substrates for liquid-crystal display (LCD), are conventionally conveyed; that is, they come into contact with the transportation device. Hence, surface scratching, static electricity, and particle contamination easily occur. To avoid these problems, several noncontact conveying approaches,1–5 which generally use magnetic, electrostatic, near-field, and pneumatic levitation, have been proposed and proven to be effective. Pneumatic levitation has a broad range of applications and advantages, such as clean, magnetic free, and minimal heat generation. A typical example is the use of a Bernoulli gripper to pick-and-place a workpiece. 6 Other than the use of vacuum grippers, one approach to achieve noncontact transport is to use air tracks to supply pressurized air beneath the workpiece.7,8
A few researchers used fluid mechanics to achieve wafer product positioning by actively controlling an air film flow. Paivanas and Hassan 9 developed an air film system to generate a supporting air film for levitating and transporting small-sized silicon wafers (diameter of 57–82 mm). Delettre and colleagues10,11 used a set of vertical jets to form a lateral airflow to move a floating object. J Van Rij et al. 12 used a number of square recesses to generate a horizontal airflow beneath the workpiece rather than an inclined flow. Biegelsen et al. 13 developed a paper mover and achieved stable levitation by creating an air cushion on both sides of the paper. The above systems are well-suited to light and small objects, such as silicon wafers, because the use of viscous traction will most likely achieve a completely contactless transport.
As integrated circuit (IC) manufacturing technology advances, manufacturers are developing larger-sized products to improve production efficiencies and reduce costs.14–16 For example, a 10th-generation thin flat panel (TFP) glass substrate is approximately 3 × 3 m2. It is necessary to inspect quality defects in thin-film transistor (TFT) arrays using high-speed charge-coupled device (CCD) cameras. Figure 1 depicts a conceptual sketch of a noncontact transportation system for the inspection process. However, high-speed CCD cameras with a shallow focus depth may be unable to implement inspection when the glass sheet exhibits a considerable deformation during transportation.

Noncontact transportation system for inspection process.
In contemporary air conveyor systems, installing an additional moving stage to supply an actuating force is a common approach, in which the air film is only used for support. Chandra et al. 17 found that the orifice restrictors cause a large pressure peak at the center, which results in a considerable deformation to the glass sheet. Therefore, a method using a porous medium instead of orifices as restrictors has been introduced and proven to be effective to avoid stress concentrations.18–20 Several companies have developed porous air conveyors for transporting glass substrates,21,22 but without relevant theories describing its characteristics. Lee and Lee 23 established a film flow model and constructed a few optimization principles. Amano et al. 24 developed a conveyor system using porous pads for the air supply and exhaust. Oiwa et al. 25 conducted research on the deformation characteristics and found that they are closely associated with the air film boundary conditions. The existing references stated above primarily focus on the deformation behavior of the glass sheet; however, a few other basic characteristics of the air film system need to be clarified, such as the flow properties, film pressure distribution, and bearing force, and the authors’ earlier research 26 did not include these characteristics.
In this study, we proposed a contactless air conveyor for transporting large glass sheets. The conveyor uses aligned porous media as restrictors instead of orifices. A theoretical model is established, and numerical simulations are conducted. Additionally, the experimental results on the flow rate characteristics, film pressure distribution, bearing force and stiffness, and glass deformation are reported.
Noncontact conveying system
Figure 2 illustrates the geometry and image of the noncontact air conveyor. Air is supplied beneath the glass sheet via the porous pads to form an air film for support. The conveyor is a 500-mm square and consists of 100 square units. Each unit has a circular recess where a porous pad is embedded. The porous pad is 20 mm in diameter and 3 mm in length. The porous surface is slightly lower than the conveyor surface. Grooves with a 5-mm width and a 1-mm depth are placed between the units to exhaust to the atmosphere. Moreover, holes with a diameter of 4 mm are set at the intersections of the grooves. The exhaust holes can be connected to either the atmosphere or the vacuum generators to drag the glass sheet closer to the conveyors. The outer units located on the edge of the conveyor are designed to be slightly wider than the inner ones to obtain a relatively uniform pressure distribution.
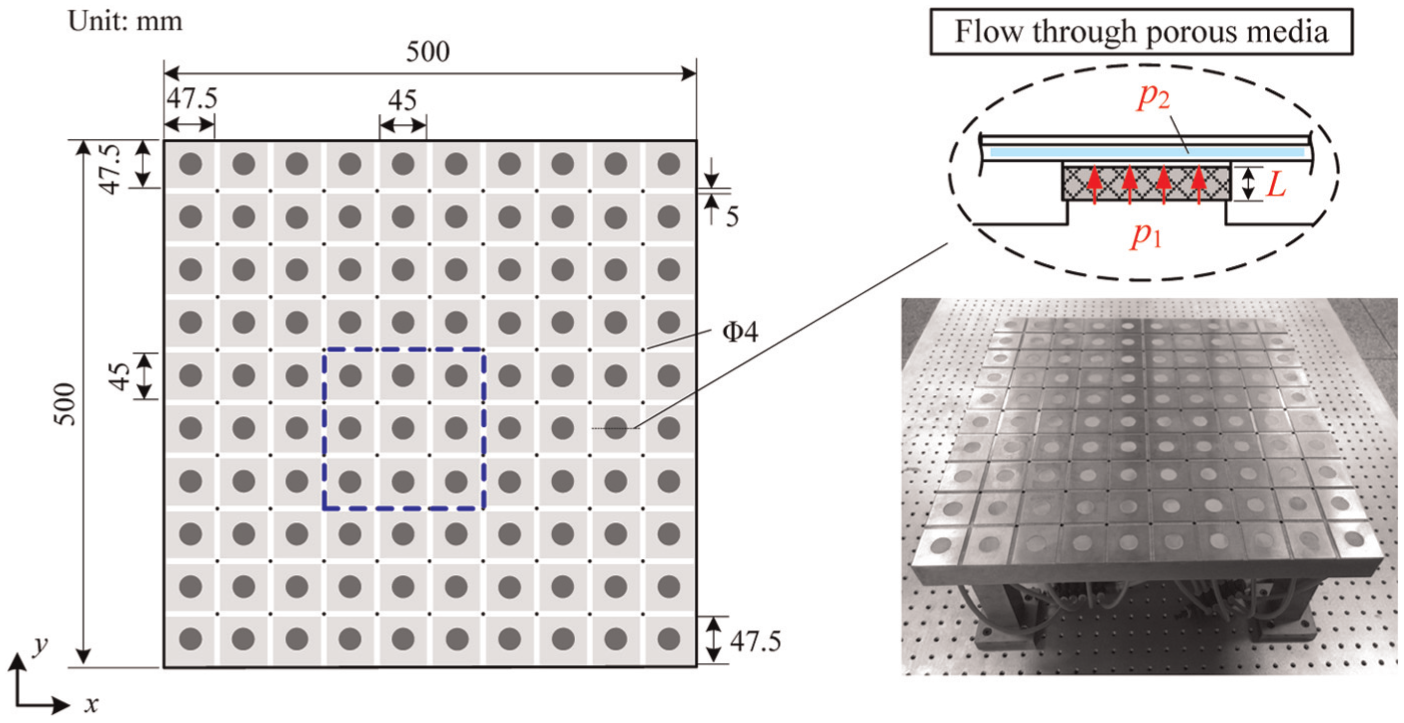
Dimensions and image of the proposed noncontact conveying system.
Theoretical and experimental methods
Flow rate characteristics
The relationship between the supply pressure and the flow rate is significant for evaluating the system performance and must therefore be investigated. The porous media are treated as isotropic and homogeneous; consequently, the mean flow velocity can be written as follows

where v is the flow velocity, q is the mass flow rate, ρ is the density, φ is the porosity, and A is the cross-sectional area.
By assuming that air is a perfect gas, ρ can then be expressed as follows

where p is the pressure, R is the gas constant, and T is the room temperature.
The Forchheimer regime,27,28 which adds a quadratic term based on the Darcy regime to include the inertial effects, can be used to describe the flow pattern as follows

where µ is the air viscosity, x is the displacement along the length, K is the permeability, and β is the inertial coefficient.
By substituting equations (1) and (2) into equation (3) and integrating the pressure with respect to length, using the boundary conditions p = p1 (x = 0 (m)) and p = p2 (x = L (m)) (cf. Figure 2), we can obtain the modified Forchheimer equation for representing the compressible flow as follows

To experimentally validate the flow equation, we select three porous pads with different properties from a large number of samples manufactured by sintering SUS316L powder over 1000°C and mark them as #1 to #3 (cf. Figure 3). The sintered powder particle for each sample differs in size; therefore, the pore size of the internal structure is different. The porosity φ, which is defined as the ratio of the void space to the total volume, can be easily calculated if the weight, volume, and density of the medium are known. For samples #1, #2, and #3, the porosity is obtained as 0.435, 0.452, and 0.432, respectively.

Schematic of the experimental setup for flow measurement.
The arrangement of the pneumatic circuit is illustrated in Figure 3. The porous pad is sealed in a metal sleeve using a cylindrical rubber to avoid leakage from the side face. The flow measurement is performed with the downstream of the pad open to the atmosphere. A calibrated pressure gauge is placed upstream of the porous pad, and a thermal flow meter (PFM711; SMC Co., Ltd, Japan) is connected to measure the flow rate. During the experiments, an adjustable valve is used to change the flow rate. To reduce uncertainty, the measurements are repeated thrice for each sample to obtain an average result.
Film pressure distribution
Numerical method
To calculate the pressure distribution in the gap, as indicated in Figure 2, a Cartesian coordinate (x–y) is built, and the bottom left point is considered as the origin. The theoretical modeling process relies on the following assumptions:
Viscous effects dominate the flow pattern; hence, the airflow is laminar.
Variation in the film pressure in the thickness direction is ignored.
Consequently, a modified Reynolds equation can be obtained as follows
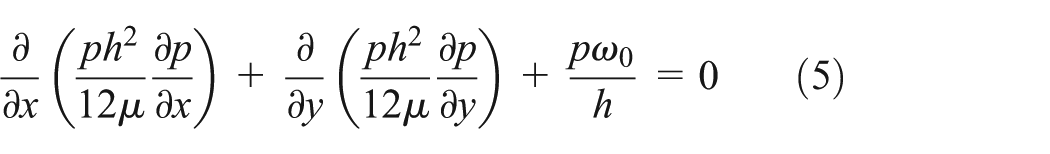
where p is the pressure, h is the gap thickness, and ω0 is the average flow velocity at the porous surface, which can be calculated using the previously mentioned Forchheimer equation.
Using a finite difference method, equation (5) can be solved to obtain the film pressure distribution. To reduce the computational load, a representative region including nine square units is selected, as marked by the dashed box. An equally distributed mesh grid with 290 × 290 nodes is used for the calculation region. Atmospheric pressure is considered as the initial value for each node. The Euler explicit method is preferred over the implicit method for solving the Reynolds equation coupled with the flow equation, even though it is a time-independent problem. The time step is 10−7 s. The pressure data are updated in the iteration routine until the calculation converges. The air consumption can be calculated based on the exit of the region by equation (6) as follows
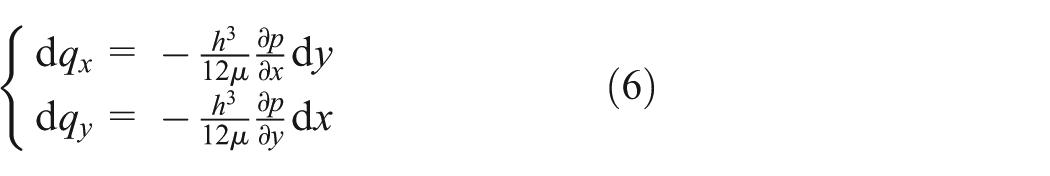
where qx is the flow rate in the x-direction and qy is the flow rate in the y-direction.
Pressure distribution measurement
Figure 4 schematically illustrates the apparatus used to measure the film pressure distribution. A sliding bar with a small hole (0.5 mm diameter) is inserted through the middle of the measuring table. A laser displacement sensor (LK-G500; Keyence Co., Ltd, Japan) is installed to record the location of the bar. A pressure sensor (KL17; Nagano Keiki Co., Japan) is connected to the hole through an internal perforation. The measuring table is inversely fixed to the bottom of an elevating table. Furthermore, the measuring table can be fixed in parallel with the conveyor surface as follows: (1) place the measuring table inversely on the conveyor surface, (2) set three pins to contact the measuring table, and (3) fasten the pins by turning the clamps and pull the elevating table upward by a spring so that the table can be equipped onto the support. The vertical position of the measuring table can be adjusted using the elevating table and detected by a laser displacement sensor (LK-G30; Keyence Co., Ltd). Consequently, the pressure distribution under a certain gap thickness can be obtained by recording the pressure and moving the sliding bar simultaneously.

Apparatus for pressure distribution measurement.
Bearing force measurement
Figure 5 schematically illustrates the apparatus used for measuring the bearing force. A plate is fixed on one end of the shaft which is supported by an air guide with a high linear precision (less than ±3 µm deviation from the sliding direction). Therefore, the plate and shaft can move up and down without friction. The test element is installed following the aforementioned method so it is parallel to the plate. On the other end of the shaft, a force sensor (LVS-500GA; Kyowa Electronic Instruments, Japan) is placed. The back-and-forth position of the slider can be adjusted using a micrometer. Consequently, the force sensor, shaft, and plate move to change the gap thickness, which can be detected by the laser sensor. The gravity of the plate and shaft applied to the force sensor is denoted by F0. The air film exerts a force F to the plate when it approaches the test element, and the force F can be calculated by subtracting F0 from the reading of the force sensor. Therefore, the curve of F versus h can be plotted.

Apparatus for bearing force measurement.
Deformation of the glass sheet
Calculation method
The glass sheet exhibits a deformation when subjected to an unevenly distributed film pressure. The deformation was calculated using ANSYS to solve the equation of elasticity by selecting a quadrilateral thick-shell element. A similar grid formation is used for calculating the glass sheet deformation and film pressure distribution. In the calculations, it is assumed that the glass sheet is simply supported at the four corners, and all the edges, except the corners, are free, which resembles an actual situation. The film pressure and gravity force imposed on the glass sheet surface are considered as the distributed loads.
The calculation procedure is given as follows: (1) assume an initial floating height for the glass sheet without deformation, (2) calculate the film pressure distribution using the modified Reynolds equation, (3) calculate the deformation of the glass sheet using ANSYS with the film pressure data, and (4) repeat steps 2 and 3 until the pressure distribution and the deformation converge.
Deformation measurement
Figure 6 depicts a schematic diagram and photograph of the apparatus used for measuring the flatness of the glass sheet which is supported by the air conveyor. The air conveyor is placed on a carefully leveled optical isolation platform. The glass substrate is supported at a certain distance from the conveyor surface at the four corners. As indicated in the figure, a small bolt is fixed on an L-type plate, which is installed on an elevating table, and another micrometer is equipped on the adjacent side of the plate to tightly clamp the glass sheet. A laser sensor (LK-G30; Keyence Co., Ltd) with a resolution of 0.1 µm is installed on an XY slide table. Figure 6 shows the sensor route for measuring the deformation of the glass sheet. In the x-direction, the glass flatness was measured continuously, and in the y-direction, the slide table was moved in 5 mm increments. The flatness measurements are performed twice to obtain the deformation of the glass sheet. First, the measured deformation without the air supply is used as the reference value. Then, the steps are repeated with the air supply, and the actual deformation of the glass sheet can be calculated by subtracting the reference value from the reading of the laser sensor.

Apparatus for measuring the deformation of the glass sheet.
Results and discussion
Flow rate characteristics
Equation (4) describes the flow rate versus pressure drop for a compressible flow, including effects from both viscosity and inertia. Permeability K and inertial coefficient β can be determined experimentally. Figure 7 plots the pressure difference against the flow rate for the test porous media. It may be assumed that when the inertial effect is negligibly small, the permeability can be directly determined by the experimental data considering only the viscous effects. As shown in Figure 7, the pressure difference is in close linearity to the supply flow rate under a pressure drop (0–1 kPa), thus implying that the flow pattern follows the Darcy regime for an incompressible flow. A pressure drop less than 1 kPa is considered negligibly small in comparison with the atmospheric pressure; therefore, air is treated as an incompressible fluid without a variation in density. Therefore, a least squares straight line is passed through the data points to obtain the permeability, which is inversely proportional to the slope of the line. The R2 value for the linear fitting line exceeds 0.98 for all the test media; hence, the errors are thought to be acceptable.

Flow rate characteristics.
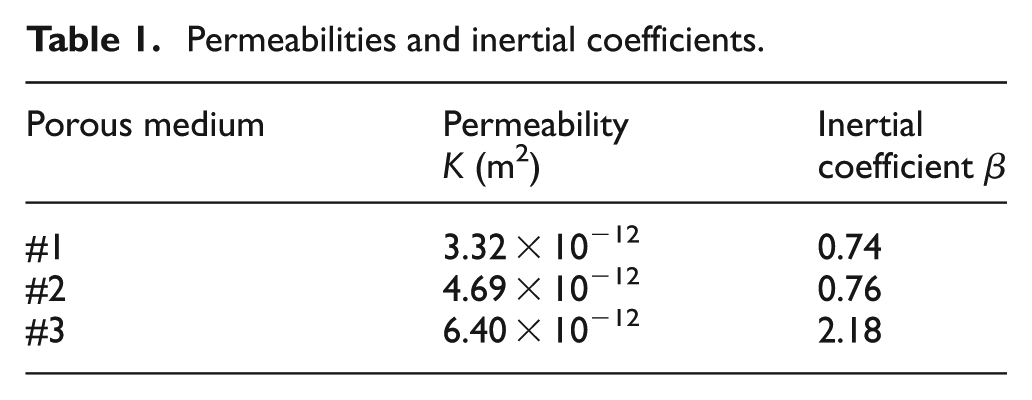
Based on the resulting permeability, all the data are used to fit the flow rate in terms of the modified Forchheimer equation to obtain the inertial coefficient. The determined permeabilities and inertial coefficients are presented in Table 1. Actually, the permeabilities and inertial coefficients are dependent not only on the porosity but also on the particle diameter. For the three samples, the obtained characteristic coefficients result in different values because the particle diameters are considerably different. Clearly, the calculated curves generally agree with the experimental points. This finding proves that to correlate the flow rate characteristics, applying the modified Forchheimer equation with the determined coefficients is viable, and the flow rate can be predicted once the upstream pressure is set. Because the porous media are assumed to be isotropic and homogeneous, it should be noted that the obtained permeability and inertial coefficient most likely do not indicate the true property of the porous pad but only that of the calculation. Moreover, in Figure 7, as the supply flow rate becomes adequately large, the data appear nonlinear due to the inertial and compressibility effects, both of which aggravate the pressure drop. To ensure consistency in the measurement, porous pads with a permeability of 3.32 × 10⁻¹² m2 and an inertial coefficient of 0.74 are used for the following investigations. Although the properties of the media are slightly influenced by the manufacturing process, the authors contend that if the samples are fabricated following the same procedure and using the metal powder with the same particle size, then the final media of the same batch should generally have similar characteristics.
Permeabilities and inertial coefficients.
Film pressure distribution
To clarify the influence of the exhaust grooves and holes on the pressure distribution, a numerical calculation is performed to compare three cases: (1) without grooves or holes, (2) with grooves but without holes, and (3) with grooves and holes. Figure 8 provides the results of the pressure distributions on the centerline of a 3 × 3 square unit region. It can be seen that case 1 exhibits a significantly larger film pressure than the other cases. However, the pressure distribution is non-uniform. The distribution shape on the outer porous area greatly differs from that of the center. Thus, it is apparent that the flow field is complicated due to the interaction effect. Although a two-dimensional iterative computation can obtain the pressure distribution, for a larger size case, the calculation is time-consuming and difficult to apply to the performance analysis. The result of case 2 indicates that the pressure decreases considerably after the exhaust grooves are set; however, the distribution on the outer porous area still appears to be non-symmetrical; that is, the variation in the pressure is steeper in the diverging portion of the air film than that in the converging portion. The result of case 3 shows that the film pressure at the grooves is close to the atmosphere pressure, and that a uniform pressure distribution is observed with reduplicate shapes. In this case, the analysis on the characteristics can be performed in a representative region.
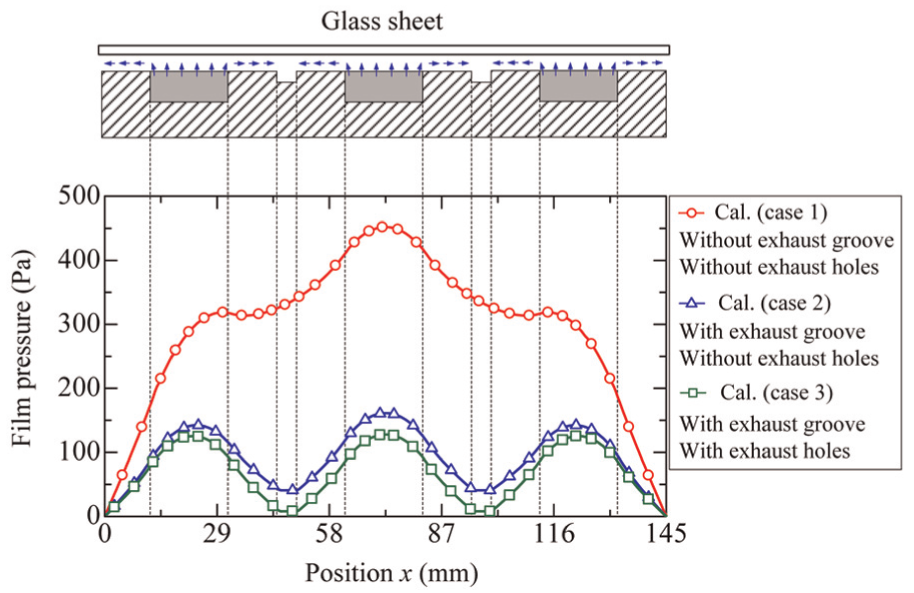
Film pressure distributions.
Figure 9 illustrates the pressure distribution on the centerline of a square unit, where the gap thickness is 200 µm and 250 µm, respectively, and the supply flow rate is 2 L/min per unit. Air flows through the porous medium into the gap and then accelerates in the radial direction. The pressure variation appears smooth in the central area because the airflow is nearly stagnated and then varies rapidly with the radius. In the porous area (r < 10 mm), a parabola-like pressure distribution is formed. In the periphery area (r > 10 mm), it is observed that the pressure is approximately linear along the radial direction because the pressure loss is mostly attributed by viscous friction rather than velocity variations. A comparison of the results at different gap thicknesses suggests that the pressure amplitude exhibits a decreasing trend with an increase in the clearance. Furthermore, we also noted that the curves obtained using the calculating model can reproduce all the features of the distribution shape and provide a satisfactory approximation in comparison with the experimental data.

Pressure distributions on the centerline of a representative square unit.
Traditional air conveyors commonly use arrayed orifices. A comparison of the pressure distribution between the porous pad and the orifice was conducted under the aforementioned experimental conditions. A constant supply flow rate was used during the experiments because it was difficult to accurately maintain a low pressure. The orifice pad has the same dimensions as the porous pad (ϕ20 mm in diameter and 3 mm in thickness), and the diameter of the orifice is ϕ2 mm. Figure 10 illustrates that a high-pressure peak is formed at the orifice center, thus indicating that the air is emitted at high speed, which would undoubtedly result in a large amount of concentrated stress acting on the workpiece. Simultaneously, it follows the Bernoulli principle; that is, a pressure drop occurs immediately after air enters the gap because the air is accelerated by the small radius. This result would aggravate the stress concentration, which is undesirable in the transportation of fragile glass substrates. An air conveyor equipped with a porous pad can ease this problem because it eliminates the sharp pressure peak.

Comparison of the pressure distribution between the porous and orifice pads.
Bearing force and stiffness
Figure 11 illustrates the experimental results of the bearing force versus gap thickness for a 3 × 3 square unit region when the supply flow rate is set to 1 and 2 L/min per unit. The bearing force increases as the gap thickness decreases, and under a given gap thickness, a larger supply flow rate can improve the bearing force. A smooth curve is used to fit the data using a cubic polynomial regression, resulting in an R2 value exceeding 0.99; thus, the static stiffness dF/dh can be calculated by differentiating the F–h curve. It should be noted that the static stiffness with a larger supply flow rate exhibits a larger value at the same clearance. In actual applications, a 3 × 3 unit region typically provides a force of several tens of grams. By assuming that both supply flow rates are used to levitate the same workpiece, for example, with a load gravity of 0.8 N, the bearing force and gravity curves intersect at two points. The workpiece is levitated at an equilibrium position where the supporting force is automatically balanced by the weight. It is clear that the workpiece is supported at a narrower clearance for the small supply flow, but the corresponding stiffness is larger than that of the large supply flow. This result indicates that an appropriate reduction in the supply flow rate may improve the film stiffness. However, a decrease in the floatation height would raise the risk of contact, and the supply flow rate should be carefully set based on the floating object in practice. Additionally, it should be noted that the theoretical model–based calculation can provide the bearing force and stiffness characteristics. However, the simulation results are likely to be too idealistic and difficult to be accurately reproduced by experiments due to strict requirements for the theoretical modeling as well as the experimental apparatus. In this respect, the authors would prefer the experimental results and believe that it can better reflect actual situations.

Bearing force and stiffness.
The authors previously proposed an air conveyor. As indicated in Figure 12(b), each unit contains four porous regions, a peripheral region and a 5-mm-wide surrounding groove. Figure 12(a) provides a diagram of the current air conveyor, which uses grooves to separate each porous pad so that each unit only has one porous region. Figure 13(a) compares the bearing force versus gap thickness for the two air conveyors with a supply flow rate of 1 L/min per unit. The previous air conveyor provides a force two to three times larger than that of the current one at the same floatation height. Assuming that a glass sheet with a thickness of 0.7 mm is supported by both conveyors, the equilibrium height can be obtained by plotting a horizontal line at 0.7 N, which corresponds to the weight for a size of 195 × 195 mm, to intersect with the force–thickness curves. For the current air conveyor, the glass sheet floats at a height of approximately 200 µm, which is appropriate for actual applications. Floatation at an excessively low height would raise the risk of contact between the glass sheet and the conveyor surface, whereas a significantly large height would deteriorate the film stiffness. For example, in the case of the previous air conveyor, a floating height above 300 µm is typically undesirable. Conversely, as indicated in Figure 13(b), a comparison of the pressure distribution between the current and previous air conveyors is performed at a floatation height of 200 µm. Clearly, the distribution shape for the current design is advantageous because it is uniform. Furthermore, each unit only contains one porous area and can be treated individually, thus resulting in a simple theoretical model.

Schematic diagrams of the air conveyors: (a) current air conveyor and (b) previous air conveyor.

Comparisons of performance between the previous and current air conveyors: (a) comparison of bearing force between previous and current air conveyors and (b) comparison of pressure distribution between previous and current air conveyors.
Deformation of the glass sheet
To reduce the computational load, a numerical analysis is performed on the deformation of the glass sheet in a 3 × 3 square unit region. Figure 14(a) schematically depicts that the glass sheet is supported at the four corners. A 145-mm square, 0.5-mm thick glass sheet is used for the calculation. The glass sheet is deformed under the interaction of gravity and film pressure. The physical properties of the glass sheet are listed in Table 2. Figure 14(b) and (c) provides the numerical results of the deformation for the case where the supply flow rate is 2 and 1 L/min per unit, respectively. The glass sheet is initially assumed to be completely flat, and a gap thickness of 200 µm is set as the zero coordinate in the z-direction. The four corners have no deformation because they are fixed. The glass deformation is symmetrical about the centerline, and it does not necessarily exhibit a wavy shape despite a wavy pressure distribution when the glass sheet is of a small size.

Calculated results of two-dimensional deformation of the glass sheet: (a) glass sheet supported on a 3 × 3 square unit region, (b) deformation of the glass sheet with a supply flow rate of 2 L/min per unit, and (c) deformation of the glass sheet with a supply flow rate of 1 L/min per unit.
Properties of the glass sheet.

Additional observations are focused on the centerline due to the symmetrical distribution of the deformation. Figure 15 depicts the calculated deformation to compare the final results with the initial calculation. It is observed that the maximum final deformation reaches approximately 140 µm at a supply flow rate of 2 L/min per unit and decreases to 97 µm at 1 L/min per unit, compared to the initial deformation calculations of 425 and 204 µm, respectively. These initial values are two to three times the converged value; thus, reflecting that the film pressure is susceptible to the thickness variation resulting from the glass deformation. Furthermore, it should be noted that an appropriate supporting height relative to the conveyor surface is important because it influences the glass deformation.

Calculated deformation of the glass sheet on the centerline.
Several experiments are conducted to verify the glass deformation. A glass sheet, with a size of 546 × 395 mm and a thickness of 0.7 mm, is supported at four corners at an initial height of 150 µm, as schematically shown in Figure 16(a). The deformation of the glass sheet without an air supply is recorded as a reference value, and the actual deformation can be obtained by subtracting it from the measured value. Figure 16(b) presents the contour plot, and Figure 16(c) depicts the distribution on line OO′ for the case of a supply flow rate of 1 L/min per square unit. The experimental results indicate nearly the same trend as the calculated results but with a considerably larger deformation due to the increased size. Figure 17(a) illustrates the case where the air conveyor is equipped with partial orifice pads, and the results provided in Figure 17(b) imply that the glass sheet exhibits a larger deformation under the same experimental conditions, thus indicating that the porous pad is superior to the traditional orifice in this aspect. Further observations in Figures 16(c) and 17(c) indicate that a least square quadratic curve fits the experimental data well, and this may be used for the rapid prediction of glass deformation based on the pressure distribution.

Experimental results of the deformation of the glass sheet: (a) a glass sheet is supported on the air conveyor with porous pads, (b) contour plot of the deformation of the glass sheet, and (c) deformation of the glass sheet on the centerline OO′.

Experimental results of the deformation of the glass sheet: (a) a glass sheet is supported on the air conveyor with porous pads and partial orifice pads, (b) contour plot of the deformation of the glass sheet, and (c) deformation of the glass sheet on the centerline OO′.
Conclusion and perspectives
In this study, a contactless air conveyor for glass substrates is introduced, and its basic characteristics are experimentally and theoretically studied. The results of the flow rate characteristics demonstrate that a modified Forchheimer equation can be used to characterize porous media including effects from both viscosity and inertia. The permeability and inertial coefficient can be determined experimentally, thus allowing the supply flow rate to be rapidly predicted in practice based on the supply pressure. The pressure distribution in a representative square unit appears as a parabola-like shape distributed along the radial direction in the porous area and approximately linear in the periphery area. It is confirmed that the theoretical pressure distribution derived from the modified Reynolds equation provides an approximation to the experimental data. The use of porous media can eliminate the pressure peak and thus reduce the partial stress concentration acting on the workpiece. The experimental results indicate that the bearing force and static stiffness increase if the clearance decreases with a given flow rate. Additionally, the deformation of a glass sheet supported at its four corners is numerically and experimentally studied. The numerical calculation is performed by solving the coupling equation of elasticity and the modified Reynolds equation. The measured deformation indicates an approximate quadratic distribution shape, which agrees with the trend of the calculation.
To promote practical applications of the air conveyor, further efforts are needed to investigate the following issues in the near future:
Develop theoretical or semi-empirical principles to optimize the air film conveyor;
Develop an indirect prediction method for glass deformation based on the measured film pressure.
Footnotes
Academic Editor: Jiin-Yuh Jang
Declaration of conflicting interests
The author(s) declared no potential conflicts of interest with respect to the research, authorship, and/or publication of this article.
Funding
The author(s) disclosed receipt of the following financial support for the research, authorship, and/or publication of this article: This study was supported by the National Natural Science Foundation of China (grant no. 51675247).