
Abstract
Good thermal comfort of vehicle can make the passenger comfortable and the driver attention concentration, so as to enhance the competitiveness of the products. The purpose of this article is to study the comfort performance of a car’s indoor environment. First, the integral method is used to calculate the coupled heat transfer of gas and solid, and the effects of solar radiation and wall heat radiation on the field of velocity and temperature are considered. The three-dimensional flow field and thermal environment of vehicle are simulated, and the distribution of airflow, velocity field, temperature field, and predicted mean vote and predicted percentage of dissatisfied are obtained. The results are compared with the experimental data, and the difference is less than 5%. Second, the occupant’s thermal comfort is analyzed, and the average air age is used to evaluate the air freshness. The results show that the front passengers feel medium heat, the rear passengers feel mild heat, and the air is fresh in the cabin under setting environmental conditions. Finally, the air-conditioning system is improved according to the existing problems, and the new simulation results show that the thermal comfort of the cabin has been further improved.
Keywords
Introduction
With the development of economy and society, as a traffic tool, the automobiles have gradually become an important part of people’s daily life. People hope that the car is safer, more comfortable, and more convenient for driving. When we are in cars, whether the air is fresh and the temperature is suitable are undoubtedly important factors for people to determine the comfort. With vehicle interior space being limited, the environment is complicated and constantly changing, so indoor environment comfort has become an increasingly prominent problem in high-quality automotive design.
Previous researchers have studied the comfort of passenger compartment inside with test, using the method laying dummies in the car interior, and using the thermometer and anemometer to measure the temperature and air velocity at different locations. This method requires a long test period and is inconvenient and limited by sampling points. It cannot draw detailed data of indoor environment of cars in turn. In recent years, with the rapid development of computer technology, researchers can already use simulation software to simulate the flow field changes in more complex environment, as compared with traditional test methods, while ensuring the accuracy; the numerical simulation method is more convenient and able to provide more detailed data, which greatly enhance the efficiency of the research.
Presently, researchers have done related work of numerical simulation of the vehicle’s thermal environment; Kelong et al. 1 made the airflow numerical simulation of the air-conditioning system of a heavy-goods car and passenger compartment through computational fluid software, using equivalent temperature as the evaluation of the thermal comfort of the passenger compartment for analysis; Vivek et al. 2 discussed the effect of the solar radiation, the air-conditioning vent position, and the angle on the vehicle’s interior temperature field; Han et al. 3 studied the influence of the external environment and the automotive air-conditioning system in changing heat of indoor environment, analyzing the relationship between the thermal environment and the crew cabin occupant’s thermal comfort using human thermal comfort numerical model; and Wencan et al. 4 discussed the effects of different characteristics of the car’s window glass on the temperature field. However, these studies are mainly carried out purely for the airflow and temperature field, neither considered the results of the combined effects of various factors, such as humans and the environment, nor used a scientific standard for vehicle’s thermal comfort and indoor air quality evaluation.
In this study, a three-dimensional (3D) model of a car is used, adding the driver’s and passenger’s 3D body models to make the numerical analysis of the car’s interior flow field. In the calculation, we take into account the solar radiation, the impact of convective heat transfer, body heat radiation, heat and humidity on the human body occupant’s compartment flow field, the combined effects of human factors and environmental factors on the thermal comfort, use predicted mean vote (PMV) and predicted percentage of dissatisfied (PPD) value for occupant’s thermal comfort evaluation and analysis, and an average age of air for the passenger compartment’s air quality evaluation.
Evaluation index
Thermal comfort and PMV-PPD index
The association of American Heating Air-Conditioning Engineers has clearly defined that the thermal comfort is the expressed satisfaction with the thermal environment of the state of consciousness. The factors on human thermal comfort include environmental factors and human factors: environmental factors include air temperature, mean radiant temperature, air velocity, and air relative humidity, and human factors include metabolic of people and thermal resistance of clothes.
Many scholars have studied the thermal comfort evaluation methods and have proposed a series of evaluation according to different evaluation methods. Effective temperature (ET), new effective temperature (ET*), standard effective temperature (SET), and the thermal stress index (HSI) have provided an important basis for the design and evaluation methods of indoor thermal environment.
Among them, the most representative research was by Fanger et al. at the Technical University of Denmark. Fanger et al. not only established a human heat balance equation and draw a comfortable figure but also developed a seven-point-type PMV value scale to determine the quantitative relationship between the PMV equation and the human thermal comfort. After years of practical tests, now have been recognized by most experts in the world; among them, PMV and PPD indicators have been entered into the international standard ISO7730 and laid the theoretical foundation of human development in the field of comfort, as a milestone in the development. The index takes six factors into account, including human activity level, thermal clothing, air temperature, mean radiant temperature, air velocity, and relative humidity, in order to meet the conditions of the body’s heat balance equation, determined by the subjective feeling of the vast majority of people’s testing feeling of well-being level, and to develop a thermal sensation scale PMV, as listed in Table 1; if the value obtained by calculating the body PMV is 1.5, it indicates that the person’s thermal sensation is between a little warm and warm.
Thermal sensation scale of PMV.

PMV: predicted mean vote.
PPD is the expected percentage of unsatisfactory people for thermal comfort, which can give quantitative for the expected number unsatisfied with the value and can be used to expect percentage of the group feeling too warm or cold. PMV and PPD can make comprehensive evaluation of the thermal environment for cabin crew to get a member of the crew cabin’s thermal comfort levels.
Therefore, PMV-PPD index could be used for car’s interior occupant thermal comfort for scientific evaluation.
PMV-PPD index range
Since PMV equation is obtained through a combination of experimental statistical investigation and heat transfer theory, the impact on human comfort parameters is more comprehensive and the evaluation of thermal comfort is also reliable, within a certain range through calculated heat load on human body can indeed evaluate the quality of thermal comfort. However, being used to evaluate the vehicle’s interior occupant thermal comfort is still in the exploratory stage, the main obstacle is that there is some scope for the PMV-PPD evaluation; if beyond the scope, PMV-PPD index will lose its accuracy. When using the PMV-PPD index, the following conditions must be met. 5
The body must be in a relatively stable state of thermal equilibrium for a long time
PMV thermal comfort equation is built on the basis of steady-state heat transfer between the human body and the surrounding environment, and the applicable exposure under steady-state thermal environment, with constant metabolism of the human body. It is not appropriate to evaluate the thermal comfort in a short time using relative indicators such as relative warmth index (RWI), the rate of heat loss (heat deficit rate), and some other indicators.
Skin surface has a temperature which is near to comfort
The skin surface temperature is calculated based on the normal skin surface temperature in the premise, but if the temperature changes of the skin are caused by its own temperature regulation system, the formula is no longer accurate, and thus affects the accuracy of the final evaluation of the PMV index. Therefore, it is not suitable for using PMV index to evaluate thermal comfort in ultra-high temperature or extreme cold conditions.
People body has perspiration rate close to most comfort
The formula to calculate the heat of sweat evaporation is the same in premise that normal skin perspiration is the best. For their sweat rates vary due to changes in the system, this formula is also not accurate, which affects the accuracy of the PMV index evaluation.
Therefore, when using the PMV-PPD index, the following condition must be met: the skin temperature of the body heat and sweat evaporation amount are defined within the scope of the state of thermal comfort.
Considering the scope of the equation of PMV thermal comfort, when evaluating the passenger compartment’s thermal comfort, limited the environmental conditions and physical conditions of the occupant. The environmental conditions are set as follows: sunny days, the environment temperature is 33°C, and moderate humidity. Physical condition of the crew is set as follows: crew have no big exercise, body surface temperature is normal, and normal perspiration rate.
Numerical calculation of PMV-PPD
Take PMV for the numerical calculation. The calculation expression is given as 6

where M is the human energy metabolic rate, depending on the amount of human activity, and the unit is W/m2; W is the mechanical work done by human body, and the unit is W/m2; H is the heat loss of body surface convection and radiation, and the unit is W/m2; Ec is the cooling and heat dissipation of perspiration on the skin, and the unit is W/m2; Cres is the respiratory sensible heat loss, and the unit is W/m2; and Eres is the respiratory loss in the amount of latent heat, and the unit is W/m2.
Convection and radiation heat loss
The convective human body radiation heat loss is calculated using the following equation

where fc1 is the actual ratio of the naked surface and the dressed body surface; tcl is the surface temperature of the clothing, and the unit is °C; tr is the mean radiant temperature, and the unit is °C; hc is the coefficient of convective heat transfer, and the unit is W/(m2*K); and ta is the air temperature around the human body, and the unit is °C.
Among them, the clothing area factor can be calculated using equations (3) and (4)


where Ic1 is the clothing thermal resistance.
Clothes’ surface temperature tc1 can be calculated using the following equation

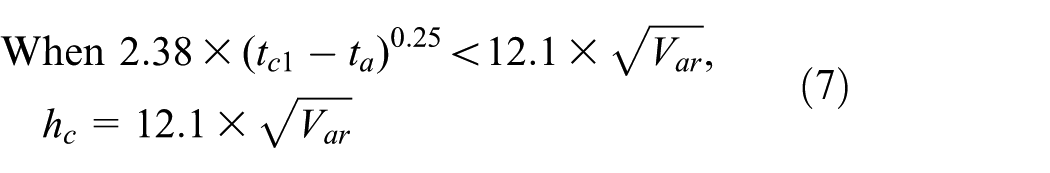
Convective heat transfer coefficient hc can be calculated using equations (6) and (7)

The amount of heat and sweating heat on the skin
The following equation is used to calculate the heat dissipation Ec of the sweating and on the skin

where Pa is the air water vapor pressure surrounding the body, and the unit is Pa.
Respiratory sensible heat loss
The sensible heat loss of breath, namely, heat loss caused by temperature changes by breathing air, which is a calculation expression of formula (9)

Respiratory latent heat loss
Respiratory latent heat loss, which is the process of breathing air temperature, does not cause the heat loss, and the calculation expression is as follows

It can be derived from the above formula that there are nine variables when calculating PMV value, which is determined by fc1 and clothing insulation tc1 and Icl. hc is the function of the indoor wind speed v, and W is assumed to be 0. Therefore, the impact on human thermal comfort has six indexes, namely, air temperature, mean radiant temperature, air velocity, air water vapor partial pressure, clothing, and body metabolism rate. When clothing, labor intensity, and water vapor’s partial pressure are determined, according to the thermal comfort equation, wind speed, mean radiant temperature, and air temperature are the main factors that affect the human thermal comfort.
PPD
When the value of PMV is determined, PPD values are obtained by the following equation

In the simulation, PMV and PPD values cannot be directly obtained by the simulation software, it is necessary to put PMV and PPD numerical calculation programmatically into the simulation software; the simulation software value and other conditions calculated PMV and PPD values through each point temperature, velocity and humidity values, and then averaged to obtain the final results.
Air quality and age of air
When traveling by car, good air quality makes people feel refreshed and good; during summer and winter, due to the closed compartment, leading to a poor indoor airflow, the crew will feel the air is not fresh and even smell the odor, thus seriously reducing the ride comfort. Thus, a closed cabin air quality assessment and analysis is very important and meaningful.
In order to quantitatively evaluate the merits of indoor air, scholars from various countries presented a variety of indicators, such as macro-air exchange rate, ventilation efficiency, and clean airflow. These indicators are most relevant with parameters of the air age. The age of air is first raised by the scholar Sandberg in 1980s, which is the time that the air enters the room from the inlet; it reflects not only the freshness of the indoor air but also the ability to remove contaminants.
Generally, the smaller the air age, the more fresh and better the air. From the perspective of statistical analysis, air of a point is composed by a large number of different air micelles; the age of air at a point is the average of all air micelles’ age. So, you can get the mean age of air to assess the freshness of the air through numerical calculation. 7
Construction of the numerical simulation model
Physical modeling
After mapping the real vehicle, using 3D modeling software CATIA to model the passenger compartment, the physical model includes bodywork, interior trim, seats, and air duct. Due to the computing need, the air flows through the cabin crew surface; therefore, the 3D geometric data of CATIA are put into hypermesh, Then, import a dummy model, extract the surface, generate surface mesh, and import to STAR-CCM+. The model is shown in Figure 1 after treatment.
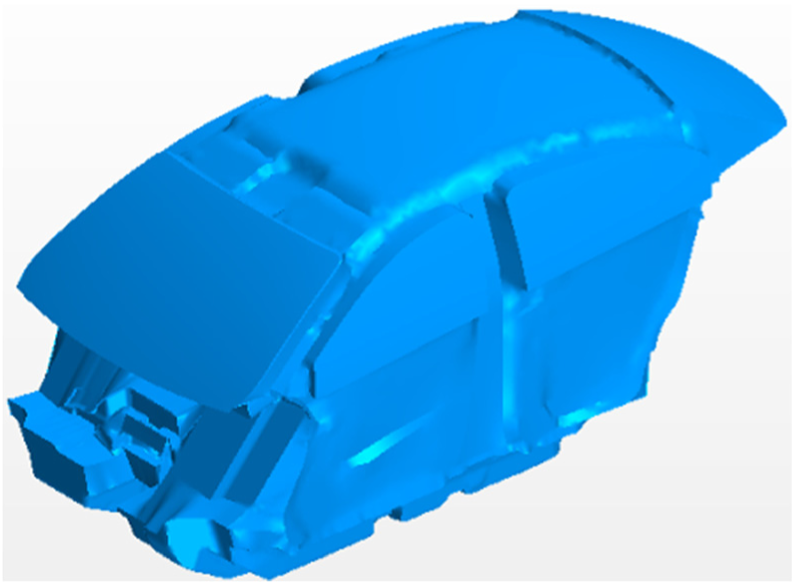
Schematic diagram after extracting the inner surface of the passenger compartment model.
After the doors, windows, and roof are hidden, car compartment’s internal structure is shown in Figure 2; the front and rear were arranged in four dummies to simulate the driver and passengers. Cold air flows into the car through 10 inlets, the passenger compartment in the front row had 2 central air inlets, left sides had 2 inlets, 4 feet inlets, the passenger compartment’s rear center had 2 outlets, and finally, the air gets out from the outlet in the rear of the car.
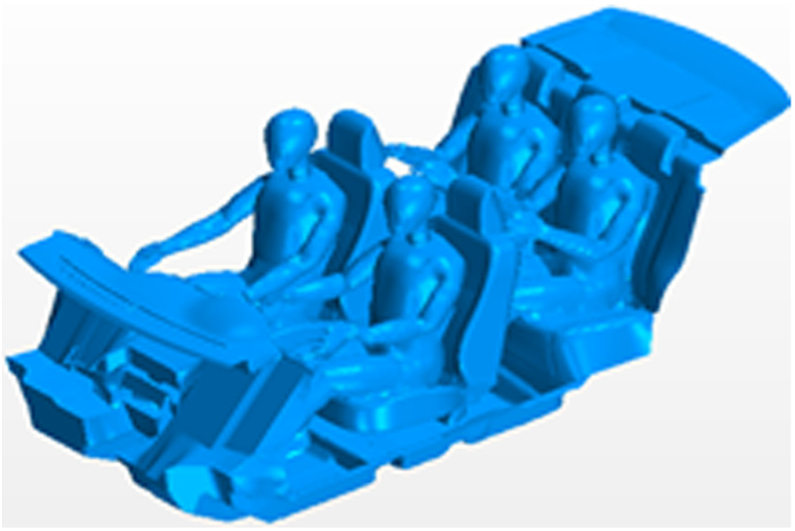
Schematic model of the internal structure.
Meshing
Entire calculation model uses tetrahedral mesh in STAR-CCM+and many local encrypts in order to ensure the accuracy of the results; the number of volume mesh solution domain is 5306522. The body mesh model after the division is shown in Figure 3.

Schematic diagram of solving area’s volume mesh.
Numerical simulation methods and boundary conditions
Calculation methods for solving the discrete domain and flow field
In order to improve the accuracy of the calculation, spatial discrete method uses second-order upwind scheme and flow calculation method uses SIMPLE algorithm, which is a form of pressure correction method and can ensure the accuracy of the results. 8
Turbulence simulation
These simulation models used in the article are very complex: fluid flow is low and some parts of the border region of curvature are great, in order to ensure the accuracy of the turbulence simulations, use Realizable K-epsilon turbulence model. 8
Treatments of solar radiation and radiation between walls
The energy of solar radiation was distributed by wavelength, which accounted for 50% of visible light, 43% infrared region, and 7% ultraviolet (UV) region. Due to the small share of UV light, the energy will be calculated proportionally and converted to visible light and infrared; therefore, the distribution of solar radiation in the car uses the ray tracing method; the impact of sunlight for interior environments can be more accurately simulated.
Radiation between solid walls use surface-to-surface model, which is calculated according to the angle of radiation heat transfer coefficient between the solid walls and the Boltzmann principle. 8
Human thermal boundary conditions
Body heat loss is with a variety of factors such as gender, age, clothing, labor intensity, environmental conditions, and other factors. In the heat emitted by the human body, the convection component accounted for 20%, the radiation component accounted for 40%, and the remaining 40% is the latent heat. Because of adapting to the environment of the human body, linking the various parts of the human body is more complex; the amount of body heat can be properly simulated and simplified. In this article, surface source of human manikin is adopted, and information proves that men and women nearly have little difference in heat dissipation, the heat capacity of adult men with spring dress is 116 W, and the driver due to the high amount of heat is 176 W; 9 in this simulation, the thermal boundary conditions of the human body is set to body surface heat evenly, heat dissipation of the driver is set to 176 W, and the remaining members’ heat loss is 116 W.
Remaining boundary conditions
Inlet conditions of the computational domain are obtained using the actual vehicle flow meter detector test; condition of outlet uses default pressure outlet port; air humidity and solar radiation are typical summer weather conditions; and as it is the steady-state condition, in order to make calculations converge as soon as possible, the initial conditions are set at ambient temperature of the real vehicle test temperature. The calculation boundary conditions are listed in Table 2.
Remaining boundary condition.

Numerical simulation results
Analysis of airflow in crew cabin
Figure 4 is a flow diagram of the airflow in the passenger compartment. In the figure, the air is blown out from the airflow direction along the guide grid, whose directionality is to the face and the feet. Most of the front inflow discharge air flows back; the back and foot outlet airflow convergences, forming a vortex between the passengers at the back and front seats; air flows back to the occupant’s leg and foot; the crew of the lower body is cooled; and the rear occupant can be cooled.

Flow chart of interior crew cabin.
As it can be seen from the flow diagram, most of the front air flowed to face flows back, so that front passengers’ trunk and thigh have less airflow that affects its thermal comfort of the occupant.
Inlets’ positions also have a great impact on comfort; we should try to avoid blowing straightly to us, because it will make people feel uncomfortable. As can be seen from the flow chart, the front sides of the central air vent blow directly at the head of the pilot and co-pilot, although its head can cool down as quickly as possible, but blowing straight to face easily makes discomfort.
Analysis of the velocity field
Velocity and direction of the air have a great influence on human comfort. In summer, air velocity is slightly larger and conducive to human thermal cooling; but too much wind blowing directly on the body will make people feel uncomfortable. The comfortable airflow speed is around 0.25 m/s. When the flow velocity reaches 0.15 m/s, you can feel that the air is fresh. Conversely, even if the room temperature is appropriate, while the flow rate is very slow, people will get bored. 10
Occupant’s body surface velocity distribution is shown in Figure 5. As can be seen, the front and rear body of the occupant is more uniform, the velocity is mostly about 0.3–0.5 m/s. Mainly due to rapid cooling in summer, wind velocity is slightly larger than the optimum comfort, which is acceptable. But the pilot and co-pilot head wind is too large; it is caused by the position of front and center outlets, although you can manually adjust the angle of the grid so that the wind deviates slightly from the head, but still produces discomfort.

Wind speed of occupant’s body surface.
From the analysis of the velocity flow field, the wind speed of rear passengers ranges better, wind near the head of the pilot and co-pilot is too large, and comfort is poor. By adjusting the front discharge outlet and the angle direction of the grid, a more uniform airflow distribution can be obtained and comfort can be improved.
Temperature field analysis
Under customary, to meet the human health conditions, generally 28°C is the cut-off point whether we are comfortable. The average temperature of air-condition inside the car in summer is 25°C–28°C, which is recommended. 10
As shown in Figure 6, temperature in most passenger cabin sections is comfortable, the surface temperature is less than 30°C, and some parts are of the higher temperature; the main parts of the body surface temperature in the occupant cabin are counted, as listed in Table 3.
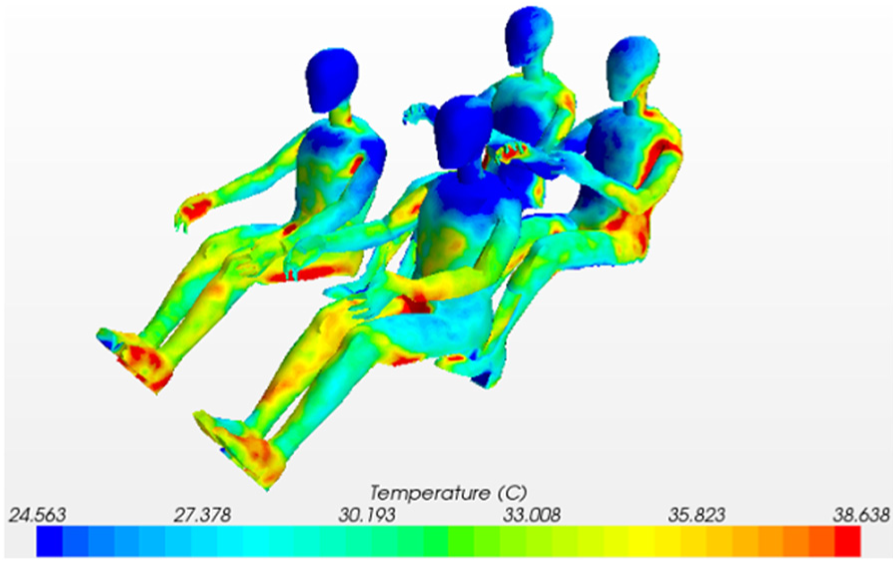
Occupant’s body surface temperature.
Main parts of the average temperature.

As can be seen from Table 3, the higher temperature positions are located in the surface: the driver’s legs and feet, co-pilot’s legs and feet, and occupant 1’s torso.
Combining with a comprehensive analysis of the velocity field earlier results in local high temperature for two reasons: first, the airflow velocity of the blowing front foot is small, with improper design of the export position, leading to high temperature of the driver’s and front passenger’s feet and legs; Second, most of the front exhaust stream flows directly to the rear, and the front passenger’s lower body failed to effectively cool; and third, there was little airflow through both sides of the rear passenger area, so the temperature on both sides of the torso is higher.
Thermal comfort
PMV-PPD evaluation
According to the PMV-PPD index in the ISO7730 recommended values, when the PMV is in the range of −0.5 to 0.5, PPD is less than 10%, and the human body is in a comfortable state; when PMV is equal to 0, PPD is equal to 5%, and the body is in the best state of comfort. 11
The mathematical equation of PMV and PPD is programmed by STAR-CCM+, and the PMV and PPD values of the distribution of the body surface can be derived. PMV and PPD distribution are shown in Figures 7 and 8, respectively.

PMV value distribution.

PPD value distribution.
As it can be seen from Figure 7, locally, values of front passenger’s feet and rear passenger’s waist are higher, which are lower in all passengers’ shoulders, so the comfort of shoulders and heads are better than other places, but on the whole, the passenger compartment PMV value is mostly concentrated on 0.8–0.9 and the PMV value is higher in the surface; temperature obtained by the temperature field is also largely high, and the values are shown in Table 4.
Passenger PMV.

PMV thermal sensation scale comparison shows that at this time, the rear cabin occupants feel little hot and the front driver and front passenger feel hotter, which is broadly consistent with the above analysis of the velocity field and temperature field results. Figure 8 shows that cabin crew PPD value is about 20%–25%, which means that in this condition, in the car occupant compartment, 20%–25% of occupants will feel hotter, it is far more than 10%, discomfort ratio, which is too high, so this is not a comfortable circumstance, and it does not meet the International Organization for Standardization’s ISO7730 −0.5 < PMV < 0.5, PPD < 10% of the thermal comfort requirements.
Air quality analysis
Writing functions in STAR-CCM+and calculating to obtain the passenger compartment air age distribution. Select Y = −400 mm section to describe the fresh air of the passenger compartment in the vertical direction. Generally, the air is fresh enough when its age is less than 30 s. As shown in Figure 9, the vertical direction of the driver’s location and the air age of the head position is approximately 20 s, and the air is fresh. This result is largely consistent with the surrounding wind speed above the driver’s head. Age of air around the body is about 30–40 s near the lower edge of the front windshield, because the airflow is difficult to reach and the air age is above 60 s.

Y = −400 mm section of the air age distribution.
Select Z = 950 mm horizontal cross-section to describe the overall cabin’s air freshness. As shown in Figure 10, the pilot’s and co-pilot’s head position air age is about 20 s, rear passengers head air age is approximately 30 s, and the freshness is better.

Z = 950 mm section of the air age distribution.
Overall, the cabin’s air age is short, especially the air of crew head is at the age of about 25 s, the air dwell time is short, and the air is better. Combination of speed distribution and air age distribution indicates that airflow is a direct impact on indoor air age, airflow is worse, the age of air is greater, and the air quality is worse.
Improvement scheme
In order to improve the thermal comfort of the passenger compartment, a more reasonable distribution of the flow field is made, and it is necessary to improve the structure of the air-conditioning system.
Inlet position of front left and right sides
Inlet’s position of the front left and right sides can be changed, as to make, respectively, both sides to release the air and not to blow directly to occupants’ head, so that the front passengers feel more comfortable; rear cooling airflow is increased to enhance the thermal comfort of rear passengers.
Front left and right feet blow outlet position
By changing the front left and right feet blow outlet position, the outlet will be exported to the passengers’ feet to enhance the cooling of the front passenger’s legs and feet.
Rear central blowing duct
Changing the rear central air ducts’ blowing surface makes it overall downward that airflow blows rear passenger’s torso better to resolve the problem of rear passengers’‘trunk’ temperature is too high and improve their thermal comfort.
Improved result analysis
Improved surface temperature of the human body
The model is recalculated when three proposed improvement programs are considered. The body surface temperature distribution after the wind tunnel improved is shown in Figure 11.

Improved surface temperature of the human body.
As can be seen in Figure 11, the high-temperature parts of the body surface improved, such as the legs and feet of pilot and co-pilot and torso of occupant 1, and the temperature decreased. Specific values are shown in Table 5.
Occupant’s body surface temperature.

Improved PMV-PPD values
Improved body surface PMV values are shown in Figure 12.

Occupant’s body surface PMV values after improvements.
As it can be seen in Figure 12, the cabin crew PMV values are from 0.8 to 0.85, and the values are shown in Table 6.
PMV value of improved occupant.

PMV thermal sensation scale comparison shows that at this time, the cabin’s front and rear occupants feel comfortable, compared with the model to be improved before, and its comfort has been improved. By calculation, this time, the cabin crew’s PPD value is 8%–13%, although the requirement that the PPD < 10% is not yet fully met, but it has been greatly improved than before.
Experimental verification
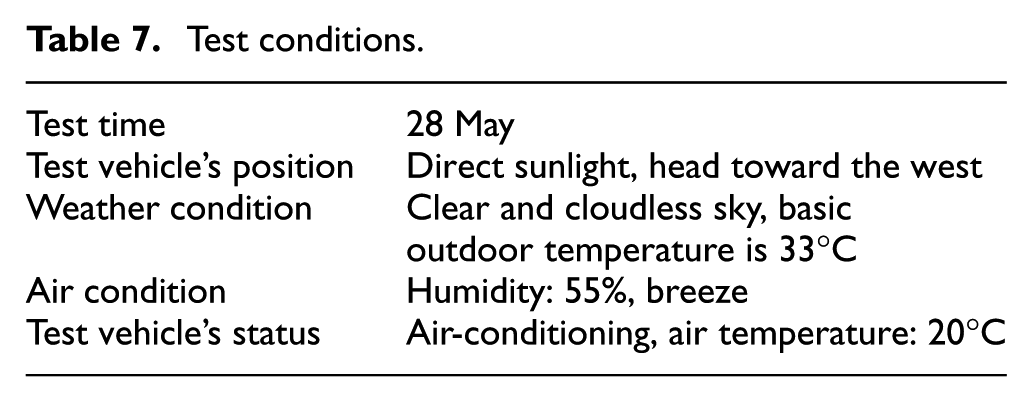
The environmental conditions and test conditions are used to verify the simulation accuracy by measuring the surface temperature of passenger behind the driver in the original car, as shown in Table 7. A handheld infrared temperature measuring instrument is used to collect point temperature, respectively, after the start of the experiment and the when vehicle’s interior temperature is stable; the temperature of the occupant’s head, arms, legs, and trunk is measured.
Test conditions.
Average of multiple measurements for each measurement point as the final measurement result, the experimental data, the simulation portion’s initial data, and the final measured data are shown in Table 8 for comparison; it can be seen that the experiment is in good agreement with the calculation, and the error is less than 5%, indicating the validity of the simulation results.
Average temperature of the human body surface.

Conclusion
It was more in line with the actual situation to analyse the occupant’s thermal comfort considering the specific circumstances of solar radiation, solid wall heat radiation, and humidity. The distribution of velocity field, temperature field, PMV, and PPD was obtained using STAR-CCM+to simulate occupant’s cabin environment. It was more scientific and intuitive that the crew cabin’s thermal environment was predicted and evaluated based on visual data graphics of PMV-PPD and air age.
The simulation results and the experimental results of body surface temperature were compared and the error was less than 5%, verifying the feasibility of using computational fluid dynamics (CFD) numerical simulation.
PMV-PPD and air age could make a comprehensive evaluation of the relationship between airflow organization, air quality, and thermal comfort, which could provide a reference for the crew cabin’s thermal environment research, air-conditioning system design, and operation control.
Air inlet location and grille angle have a great influence on the car’s interior airflow field. If the layout is unreasonable, it will lead to local hot or cold. In this model, it failed to effectively cool the front passenger due to most of the former exhaust air flows into the back row. The unreasonable design of the foot outlet easily showed that the front passenger’s local temperature was too high and the thermal comfort was poor. Occupant’s thermal comfort has been improved by improving local air-conditioning duct and exit structure from the simulation results
Footnotes
Academic Editor: Lin-Shu Wang
Declaration of conflicting interests
The author(s) declared no potential conflicts of interest with respect to the research, authorship, and/or publication of this article.
Funding
The author(s) disclosed receipt of the following financial support for the research, authorship, and/or publication of this article: This project is supported by Department of Science and Technology of Anhui Province, because of Major Science and Technology Project of Anhui Province (15czz02039).