
Abstract
In this article, bolt group looseness monitoring in a clamping support structure model, which is under environmental random excitation, is experimentally investigated. The bolt group has 12 bolts, providing an essential clamping force to fix cargo during transportation. Seven kinds of bolt group looseness degree developed gradually are simulated in experiment. From an economic point of view, vibration transducer of accelerometer is used for monitoring. Time series analysis of Auto-Regressive with eXogenous model with input known and Auto-Regressive–Auto-Regressive with eXogenous model with input unknown are constructed, and the statistical indices of the model residual error are defined as the damage characteristic parameter indicating the bolt group looseness degree. The experimental analysis shows the effectiveness of the proposed method in monitoring the bolt group looseness at early stage, while the variation of structural resonance frequency can only be used to monitor large bolt group looseness degree. The experimental analysis also shows that under a stationary, broadband random excitation, the Auto-Regressive–Auto-Regressive with eXogenous model has the same bolt group looseness monitoring capability with the Auto-Regressive with eXogenous model.
Keywords
Introduction
Bolted joint is widely used in mechanical and architectural structures, such as machine tools, industrial robots, transport machines, power plants, aviation stiffened plate, bridges, and steel towers. A significant advantage of a bolted joint over other joint types, such as welded and riveted joints, is that they are capable of being disassembled. This feature, however, can cause joint failure leading to a disastrous accident if vibrational loosening occurs, which is induced by flight/road loads or other environment factors. 1 Hence, loosening detection of bolted joints is critical for structure safety.
Till now, for the bolt loosening detection, there are some conventional nondestructive inspection techniques, which use the ultrasonic measurement and electromagnetic resonance.2,3 However, these methods are costly, labor intensive, and time-consuming to perform for a large structure/machine and can only be performed when a certain function of the structure/machine is out of service. Accordingly, structural health monitoring (SHM) has been being continually focused for about 10 years by many researchers with aim to achieve a real-time online monitoring. 4
There are a number of significant works in the SHM area concerning bolt loosening monitoring. The principle in these techniques is to seek out the changes in the dynamic properties as indicators of damage in the structure. Caccese et al. 5 study the transmittance function for bolt load loss detection in hybrid composite/metal bolted connections. Brown and Adams 6 examine the equilibrium point damage prognosis method across the joint. Todd et al. 7 assess the effectiveness of structural frequencies and mode shapes for bolt loosening monitoring. Nichols et al. 8 use state–space models to detect joint preload loss in a frame structure. Moniz et al. 9 use a multivariate, attractor-based approach to detect the bolt loosening with fiber Bragg grating strain sensors to collect structural response data. Using the same strain sensors, Milanese et al. 10 study the statistical properties in time domain and signal powers in different frequency bands to detect bolted joint loosening under stationary Gaussian excitation. The use of a piezoelectric (PZT) actuator–sensor and the impedance-based monitoring technique are presented in Ritdumrongkul and Fujino 11 and Rutherford et al. 12 for looseness assessment of bolted joint structures. Razi et al. 13 use the vibration signals excited by an electric impact hammer and apply the empirical mode decomposition to establish an energy-based damage index for bolts’ loosening degree in pipelines. Oregui et al. 14 assess the health condition of insulated rail joints in railway tracks by examining their dynamic response to impact excitation. Liang and Yuan 15 develop a decision fusion system integrated with Lamb wave actuator–sensor to monitor bolt looseness.
Unlike the SHM methods mentioned above for bolted structures, vibration-based SHM using accelerometers is appealing for its economy and convenience for measurement. One important aspect for the vibration-based SHM is feature extraction. Feature extraction is the process of identifying damage-sensitive properties, derived from the measured dynamic response, which allows one to distinguish between the undamaged and damaged structures. 16 The basic premise of vibration-based damage detection is that damage will significantly alter the stiffness, mass, or energy dissipation properties of a system, which, in turn, alter the measured dynamic response of that system. Thus, the modal parameters are used extensively for damage features. However, the most fundamental challenge is the fact that damage is typically a local phenomenon and may not significantly influence the lower-frequency global response of structures that is normally measured during vibration tests.
Vibration-based SHM for bolted structures is difficult because the local damage of bolt looseness can hardly be detected by the changes of modal parameters. However, time series methods using vibration signals provide an alternative way for vibration signal feature extraction in SHM. Sohn and collegues17,18 employ the standard deviation ratio of the residual errors from the Auto-Regressive (AR) and Auto-Regressive with eXogenous (ARX) inputs models as the damage sensitive feature, by which the structural health state of an 8-degree-of-freedom mass–spring system and a three-story building model can be monitored. Fassois and Sakellariou 19 present an overview of the principles and techniques of time series methods for fault detection, identification, and estimation in vibrating structures. Kopsaftopoulos and Fassois 20 assess several statistical time series methods experimentally via their application to bolt loosening detection at different locations of a lightweight aluminum truss structure 20 and a scale aircraft skeleton laboratory structure. 21 Lautour and Omenzetter use the coefficients of the AR models as damage sensitive features and use the features as input into an artificial neural network (ANN). The combination of AR models and ANNs is verified through damage classification and estimation of a three-story bookshelf structure and the ASCE Phase II Experimental SHM Benchmark Structure. 22
In this article, bolt group looseness monitoring in a clamping support structure model is experimentally investigated. Unlike the commonly used bolt looseness monitoring using actuators,5–15 this article provides a passive and economic way by vibration-based SHM. To avoid the insensitivity of modal parameters to local damage, time series analysis of ARX model with input known and AR-ARX model with input unknown are constructed, and the statistical indices of the model residual error are defined as the damage characteristic parameter indicating the bolt group looseness degree of the clamping support structure model. The experimental analysis shows the effectiveness of the proposed method in monitoring the bolt group looseness at early stage.
The structure and the experimental set-up
Description of the clamping support structure model
The clamping support structure model has eight components as shown in Figure 1. In Figure 1, the cross-sectional diagram is shown, and the three-dimensional diagram of the structure model is shown in Figure 2. In the bottom of the structure model, the vertical brace (component 3) is fixed on the base (component 1) by the bottom bolt group (component 2 with 12 bolts, each side 6). The vertical brace (component 3) is also connected with two half cylindrical clamps (component 4, 5) by the bolt group (component 6 with 12 bolts, each side 6). When the bolt group (component 6) is tightened, the simulated cargo (component 7, 8, two half steel tubes) will be fixed by clamping force. The position of the bolt group (component 6) is shown in Figure 2.

Cross-sectional diagram of the clamping support structure model.

Position of the bolt group (component 6) to be monitored in the structure model.
The status of the bolt group (component 6) is our monitoring object. In the experiment, the bolt group (component 6) was tightened and loosened to collect structural responses, while the bottom bolt group (component 2) was always tightened. In the rest of this article, the bolt group (component 6) will be stated as the bolt group for convenience.
Broadband random vibration experiment on the structure model
Many real vibration environments are stochastic; for example, the uneven road surface causes the road vehicle vibration; the turbulent flow causes the flight vehicle vibration. During experiment, the clamping support structure model was mounted on a vibration test bed, where broadband random excitations were acted on the structure model to simulate environmental vibrations of the support structure during cargo transportation.
The random vibration experiment system includes two parts: vibration controlling subsystem and data acquisition subsystem. The former controls the vibration of the vibration bed and is composed of sensors, charge amplifier, low-pass filter (LPF), DP550 vibration controller, and power amplifier. The latter acquires data for analyzing from test piece, which is connected with vibration bed platform through a connector. The data acquisition subsystem is composed of sensors, charge amplifiers, LPF, and data acquirer. The sketch map of random vibration experiment system is shown in Figure 3. The photo of the support model on the vibration bed is shown in Figure 4. There are four accelerometers in the experiment; of these, three are placed at test points 1, 2, and 3, as shown in Figure 5, and another sensor, as shown in Figure 3, is placed on the connector for measuring input signal of the vibration bed.

Sketch map of random vibration experiment system.

The support model on the vibration bed.

Placement of accelerometers on the structure model.
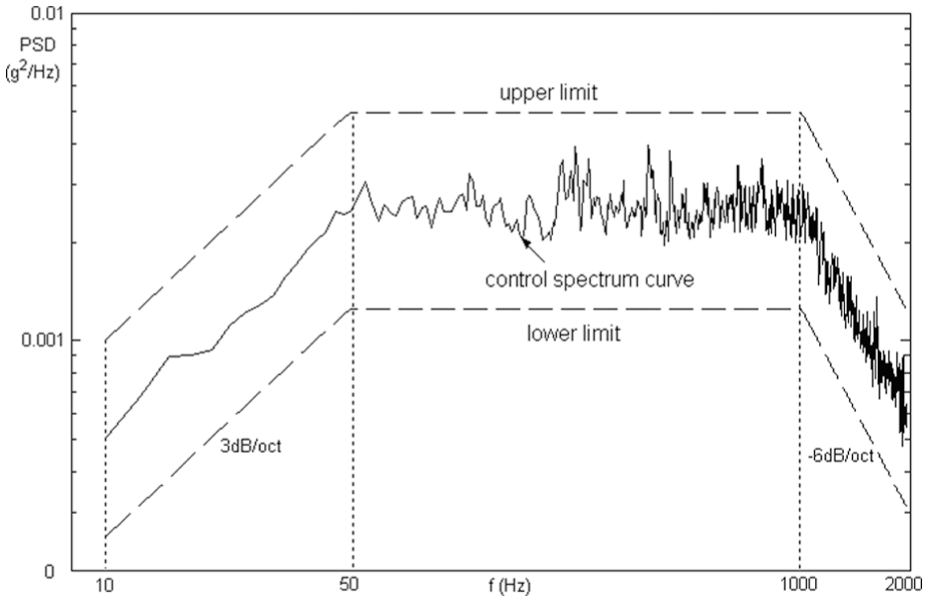
The random vibration experiment condition generally requires the power spectral density versus frequency curve (the PSD graph). The solid line in Figure 6 shows the PSD reference spectrum curve which requests the vibration bed produce a straight spectrum in the 50–1000 Hz frequency range. The solid line in Figure 7 shows the actual PSD control spectrum curve. The dashed line in Figure 6 and Figure 7 shows the spectrum tolerance for upper and lower limits which are set as 3 and −3 dB relative to the amplitude of the reference spectrum. During experiment, the vibration bed was run in the pre-experimental magnitude −6 and −3 dB for 20 s, then 20 s in the experimental magnitude 0 dB, the sampling frequency is 7680 Hz.

Reference PSD graph.
Actual control PSD graph.
Bolt group looseness simulation and frequency response
The bolt group (Figure 2) has 12 bolts, evenly spaced along the plane connecting boundary. Under stochastic base vibration excitation, the early stage of the bolt group looseness is loosening of one or two bolts, which increases dynamic loads on adjacent bolts, leading to increased likelihood of bolt loosening. When more bolts become loose, the previous loose bolts may become tight again due to the elasticity of the connecting boundary. However, the pretightening force of all the bolts in the bolt group will decrease due to the decreased clamping force of the support structure.
Thus, seven kinds of damage cases of the bolt group looseness are simulated in experiment: (1) 2 bolts closest to test point 3 are loosened; (2) 2 bolts diagonal to test point 3 are loosened; (3) 4 bolts at the four corners are loosened; (4) 4 bolts at corners are tightened, the left 8 bolts are loosened; (5) the pretightening force of all the 12 bolts is decreased with a slight degree; (6) the pretightening force of all the 12 bolts is decreased with a medium degree; and (7) the pretightening force of all the 12 bolts is decreased with a serious degree.
Illustration for damage cases 1, 2, and 3 is shown in Figure 8, where the loosened bolts are shown with arrows. In damage case 4, the tightened and loosened bolts are just opposite to those in damage case 3. To completely tighten the bolt, eight cycles are needed by rotating the nut. In severe damage cases 5–7, damage extents are simulated by decreasing the nut rotation cycles to seven, six, and five, respectively.

Illustration for damage cases 1, 2, and 3.
PSDs of test point 1 for the normal state and the above seven looseness cases of the bolt group are calculated; Figures 9–12 show the PSD graphs of the normal state and cases 5, 6, and 7. It can be seen from these figures that the PSD graph will change greatly in severe looseness state of case 7; otherwise, the structures of the PSD graph change little except that the resonance frequencies decrease with the increased looseness extent. The first resonance frequencies of the PSD for the normal state and seven looseness cases of the bolt group are shown in Table 1. It can be seen from Table 1 that the first resonance frequency decreases little for the early stage of bolt group looseness of cases 1–4. Even all the 12 bolts are loosened of case 5, the first resonance frequency decreases less than 10% compared with that of the normal state. Thus, the modal parameters are not suitable for detection bolt group looseness at early stage.
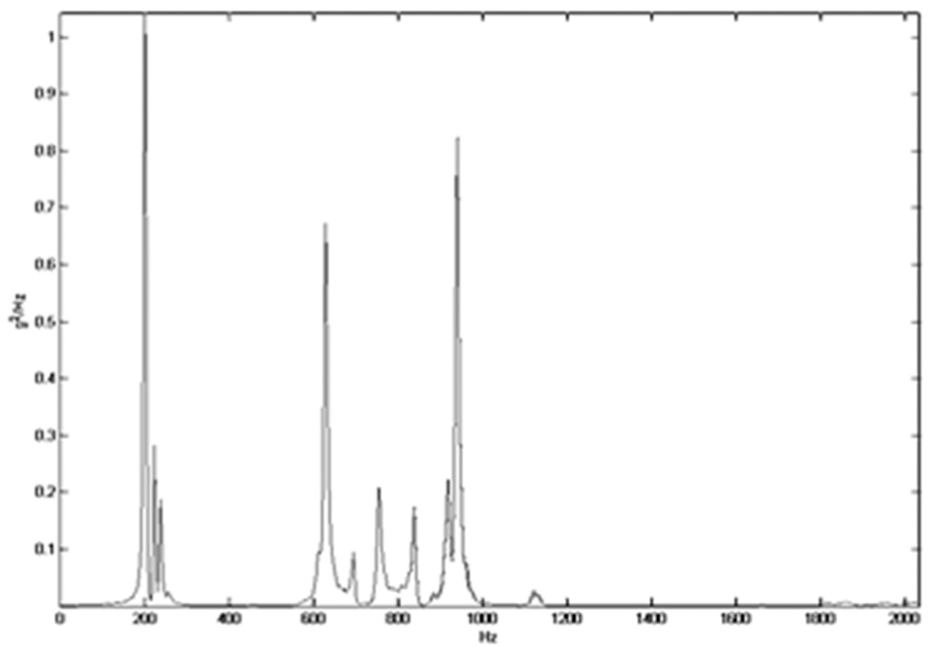
PSD graph of test point 1 when the bolt group is fastened (normal state).

PSD graph of test point 1 when all the 12 bolts in the bolt group are decreased with a slight degree (case 5).

PSD graph of test point 1 when all the 12 bolts in the bolt group are decreased with a medium degree (case 6).

PSD graph of test point 1 when all the 12 bolts in the bolt group are decreased with a serious degree (case 7).
The first resonance frequency of the PSD for the normal state and seven looseness cases of the bolt group.

Time series analysis for monitoring bolt group looseness at early stage
Theoretical description
ARX model
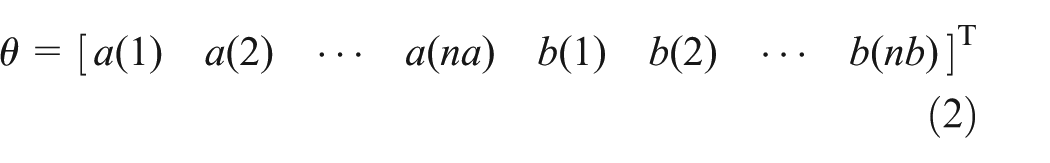
The relation between system input

where
Let

Then

If output and input time series are measured for
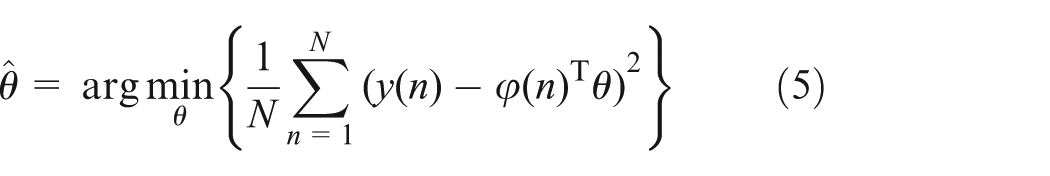
The estimated model parameter can be calculated theoretically as follows

ARX model has the same formulation with Auto-Regressive with Moving Average (ARMA) model, except that the input time series are known. The solution of equation (6) for the ARX model is a linear operation, which is faster and more reliable than the non-linear solution for the ARMA model because of the unknown input of
Derivation of damage characteristic parameter based on ARX model
First, divide the measured structure input and output signals evenly into M sections and suppose the length of each data section is N. Selection of M and N is determined by the actual length of measured data and the interested frequency band. Generally speaking, a proper frequency resolution should be assured.
Then, the data normalization process is carried out for each section
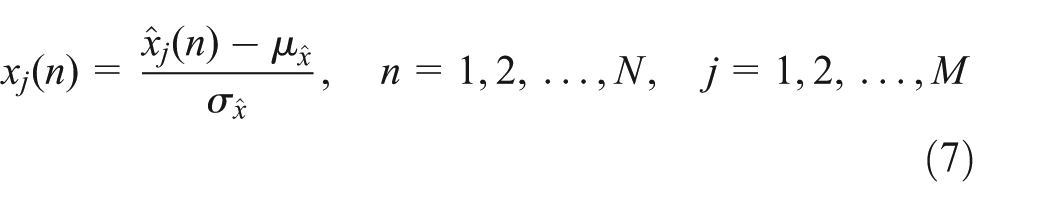
where
Second, let

where
Third, the same principle as above, obtain the input and output signals corresponding to the identical position of the structure with unknown condition (we do not know whether damage occurs). Let
Because the residual error represents the part that the ARX model cannot construct in the system output, we may believe that if
Finally, structure damage characteristic parameter can be defined as follows

where
Statistical pattern recognition of damage extent
Take the input–output signal from the structure of known normal state as the reference, through the damage characteristic parameter computation for each data section from the structure of unknown condition, damage characteristic parameter sequence
First, the confidence interval of the mean value of damage characteristic parameter sequence should be determined. For the given confidence degree


Thus, the mean value of damage characteristic parameters
Second, the probability of structural abnormality can be represented by the damage characteristic parameter sequence as
Let

where
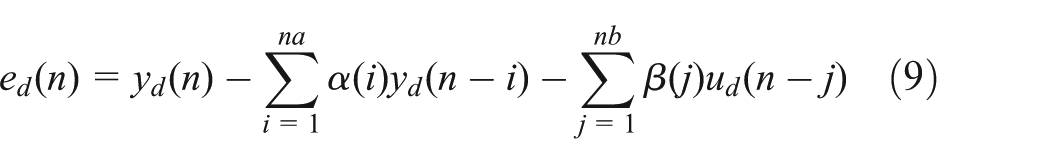
Derivation of damage characteristic parameter based on AR-ARX model
In many engineering applications, the input signal
From the theory of Wold’s decomposition, any ARMA model can be approximated by an AR model with a higher enough order.
23
Thus, high-order

When the residual sequence
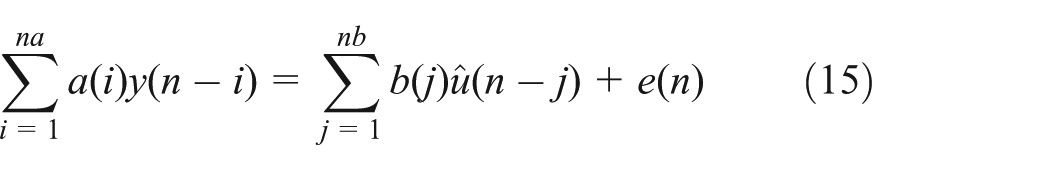
Equations (14) and (15) are called as AR-ARX modeling, which can be realized using robust linear least square method compared with the non-linear solution for the ARMA modeling.
Experimental data analysis: ARX model–based bolt group looseness monitoring
Recognition of bolts’ looseness degree
In the experimental data analysis of this article, the structural response measured from the test point 1 in Figure 5 is used as the output; signal measured from the accelerometer placed on the vibration bed in Figure 3 is used as the input. The analyzed signal is taken from 2 to 18 s of experimental magnitude 0 dB, and there are 29 data sections with length of each section 4096 points. After the model order selection process, ARX(60,60) model is used to express the input and the output relations of the normal state structure in equation (8).
Six bolt group looseness cases are analyzed, which are 2 bolts loosening in case 1; 4 bolts loosening in case 3; 8 bolts loosening in case 4; and all the 12 bolts loosening with different degrees in cases 5, 6, and 7. Table 2 shows the computation results.
Mean and standard difference value of {DF} and base frequency.

It can be clearly seen from Table 2 that as the looseness degree of the bolt group increases, the mean value of sequence {DF} presents an increasing tendency, and therefore, the mean value of {DF} can be taken as the characteristic parameter indicating the extent of bolt group looseness. The standard difference of {DF} can be seen as an indicator of the credible degree of the sequence data and as a basis for comparing two groups of sequences.
As compared in Table 1 that for bolt group looseness case 1, case 3, and case 4, the first resonance frequency changes does not exceed 5%, especially for the damage case 1, when there are only two bolts loosening, the first resonance frequency of the structure is same with that at normal state.
Because the error terms are generally assumed to be independent identically distributed random variables in the time series modeling, the damage characteristic parameter sequences Dfu and Dfd defined in equation (10) are assumed to be independent and normally distributed. The assumptions may be weakened for large damage, but it is a reasonable assumption for undamaged and small damage case. Normal distribution test of the damage characteristic parameters from the undamaged structure is illustrated in Figure 13, which confirms the normal distribution assumption.
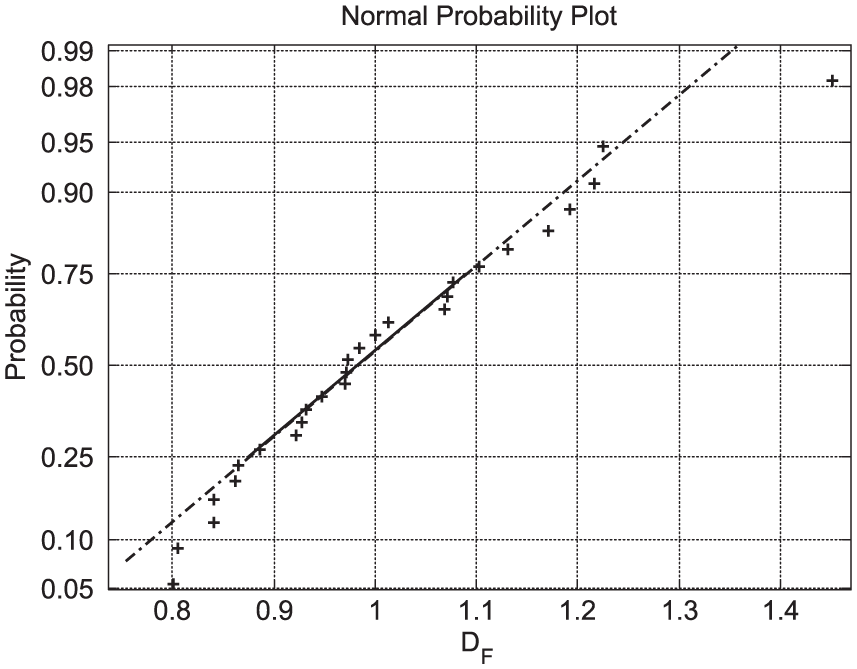
Normal distribution test of the damage characteristic parameters from the undamaged structure.
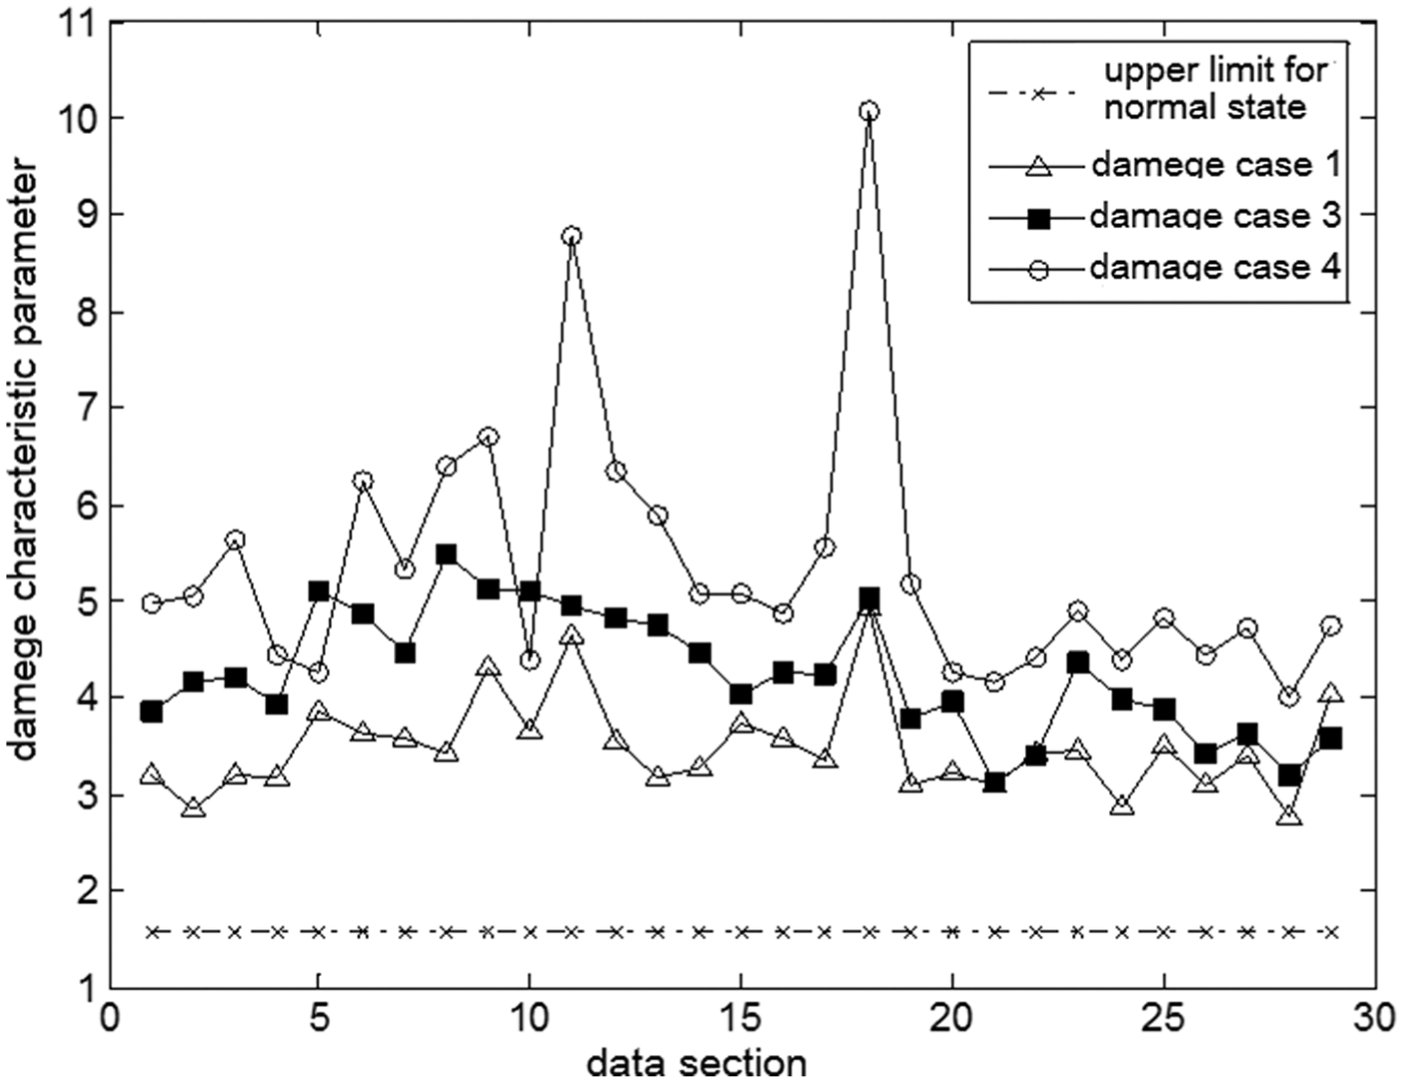
Detail of the {DF} sequences corresponding to the bolt group looseness case 1, 3, and 4 is shown in Figure 14, from which we can see that even the sequence value for case 1 is obviously higher than the upper limit for the normal state. The upper limit for the normal state is determined using equation (12), where the samples are from the DF sequence in undamaged state, and the confidence degree 95%.

Detail of the {DF} sequences corresponding to the bolt group looseness case 1, 3, and 4.
Suppose that the sequence obeys the normal distribution, then we can calculate that the probability of
Recognition of bolts’ looseness position
In order to carry out the work of bolts’ looseness position recognition, the response signals obtained from the test point 1 and 3 are calculated for the bolt group looseness case 1 and 2, which have two bolts loosening with different positions. The results are shown in Table 3.
Mean and standard difference value of {DF} for cases 1 and 2.

It can be seen from Table 3 that because test point 1 is arranged on the top of the clamping support, the calculated structure damage characteristic parameter is insensitive to the variation of loosening bolts’ positions; however, because test point 3 is arranged near the attachment bolts, when the two loosening bolts is that nearest to the test point 3 (damage case 1), the mean value of {DF} is obvious higher than that of damage case 2, in which the two loosening bolts are far away from the measuring point 3. Therefore, if more sensors are laid beside each attachment bolt, the loosening bolt position may be roughly determined by the relative value of damage characteristic parameters calculated from each measuring point.
AR-ARX model–based bolt group looseness monitoring
Recognition of bolts’ looseness degree
The same output signal with that in section “Recognition of bolts’ looseness degree” is used, the analyzed data length and data segmentation are also the same. The input signal is unknown for this section. When calculating the AR-ARX model parameters and the residual error in equations (14) and (15), the order of the high-order AR(p) model is selected as p = 200; the ARX(60,60) model is used for equation (15).
The same bolt group looseness cases with Table 2 are used for AR-ARX model–based bolt group looseness monitoring. Table 4 shows the computation results.
Mean and standard difference value of {DF} and base frequency.

It can be clearly seen from Table 4 that as the looseness degree of the bolt group increases, the mean value of sequence
Detail of the
Detail of the {DF} sequences corresponding to the bolt group looseness cases 1, 3, and 4.
From the experimental analysis, it can be seen that the AR-ARX model with input unknown can replace the ARX model with known input for monitoring the bolt group looseness degree, without decreasing the monitoring accuracy.
Recognition of bolts’ looseness position
The ability of bolts’ looseness position recognition is also tested for the AR-ARX model. The response signals obtained from the test points 1 and 3 are calculated for the bolt group looseness cases 1 and 2, which have two bolts loosening with different positions. The results are shown in Table 5.
Mean and standard difference value of {DF} for cases 1 and 2.

The results of Table 5 are similar to those in Table 3, which indicates that the AR-ARX model without input signal also has the ability of determining bolt looseness position as the ARX model.
Conclusion
The SHM for bolted structures is important. The commonly used methods often require actuators, which are sophisticated and not economical for large-scale deployment. This article provides a passive and economic way by vibration-based method. To avoid the insensitivity of modal parameters to local damage, time series analysis of ARX model with input known and AR-ARX model with input unknown are constructed for bolt group looseness monitoring in a clamping support structure model.
The experimental study shows that the damage characteristic parameter from the ARX model and the AR-ARX model can indicate bolt group looseness. The variation of structural resonance frequency can only be used to monitor large bolt group looseness degree, while time series analysis of ARX model and AR-ARX model can monitor bolt group looseness at early stage.
Besides, based on the analysis of bolt group looseness of cases 1 and 2, the loosening bolt position may be roughly determined by the relative value of damage characteristic parameters calculated from each measuring point near the monitored bolt.
Footnotes
Academic Editor: Jun Li
Declaration of conflicting interest
The author(s) declared no potential conflicts of interest with respect to the research, authorship, and/or publication of this article.
Funding
The author(s) disclosed receipt of the following financial support for the research, authorship, and/or publication of this article: This work was supported by Natural Science Foundation of China (approved grants: 51575339).