
Abstract
Wheels are important safety components in the vehicle driving system. Automobile lightweight is the direction of the modern automobile development. In this article, steel wheel lightweight was studied. The equal strength design of rim was used to reduce the weight of the wheel. Stress analysis of the wheel was studied using UG/Nastran. A professional software WheelStrength was used to predict the radial and cornering fatigue lives of the wheel. Sheet stamping process was set up to analyze the interference fit between the disk and the rim. The assembly was simulated by axisymmetric finite element method. After calculation and analysis, the stress distributions and fatigue lives for rim under different load cases have been found. The thicknesses of wheel rim bead and the interface between rim and disk cannot be reduced. Stress and fatigue simulation results were compared using different thicknesses of the optimized region. It was found that the best thickness of the optimized region was 1.5 mm. Spinning was used to form the flared preform. The thickness of the rim after spinning and rolling forming agreed well with the simulation. The results of fatigue tests indicated that the lightweight wheel met the design requirement. The weight of the rim was reduced by about 14%.
Introduction
Wheel is a very important safety component of automobile. At present, there are two main types of wheels: steel wheels and aluminum alloy wheels. Steel wheels still occupy a considerable market share due to its relatively low price, high fatigue resistance, and high impact resistance. Fatigue life is the main performance of the wheel. There are two main kinds of fatigue testing methods: radial fatigue test and cornering fatigue test. It will waste a lot of cost and time using the test method for wheel fatigue design. The numerical simulation based on the finite element method is an effective technique in the design field.1–4 Fatigue prediction using finite element method was studied for many years. Many papers have been published focusing on the simulation of the wheel fatigue test. Wang and Zhang 5 studied the simulation of dynamic cornering fatigue test of a steel passenger car wheel with Neuber’s rule and local strain approach. Firat et al. 6 investigated the simulation of wheel radial fatigue tests based on the local strain approach in conjunction with linear elastic finite element stress analyses. Zheng et al. 7 proposed a computational methodology to simulate wheel dynamic cornering fatigue test based on the critical plane theory and the finite element methods. Topac et al. 8 predicted the fatigue life of a heavy vehicle using the stress-life (S-N) approach and finite element analysis. Meng et al. 9 analyzed the radial fatigue of steel hub based on partitioned seam weld model and a new pressure distribution regulation. All of the studies have shown good agreement with the experimental results of the fatigue life.
With the development of lightweight vehicle, lightweight steel wheel is also put on the agenda. Studies have shown that the energy saving effect of the lightweight of the wheel is 1.2–1.3 times as much as that of the other parts. Two methods have been used in the lightweight of wheel: material and geometry optimization. The studies of material improvement have focused on the application of the high strength steel (HSS) sheet 10 while the research on geometry optimization of the wheel is little.
The steel wheel consists of two parts: the rim and the disk. Due to different forces in different parts of the wheel, the design of variable cross section is an important method for the lightweight of the wheel. Roll forming is widely used in the fabrication of the rim. The thickness of the rim changes little after roll forming. In order to reduce the thickness, spinning (flow forming) is often used. The equal strength disk has been studied in the heavy vehicle steel wheel using spinning 11 while the study on equal strength rim is little. In this article, a typical wheel was used to study the optimization of the equal strength rim. The strength and fatigue tests were simulated using finite element method. The simulation results were compared with the experiment.
Finite element model
Geometry
Figure 1 shows the geometry of the 15 × 6 J wheel. The steel wheel includes two parts: the disk and the rim. The disk is made using sheet metal stamping, and the rim is made using sheet metal rolling forming. The fillets and shapes of the disk and the rim have great effects on the strength and fatigue life. In this article, these factors were not considered. Only the effects of the rim thickness on the fatigue life and strength were studied. The thickness of the disk is fixed to 3.8 mm.
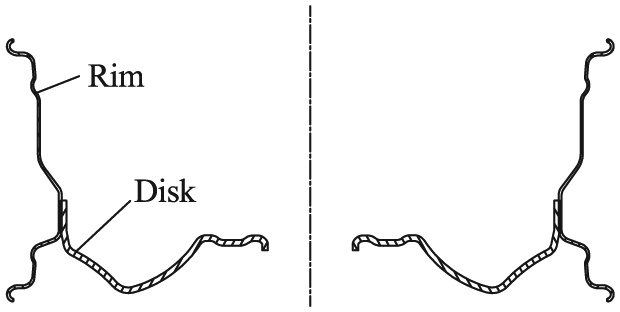
The geometry of the 15 × 6 wheel.
Materials parameters
The rim is made of SPFH590 from POSCO. Table 1 displays the mechanical properties of these materials from the factory. In Table 1, E is Young’s modulus, σ s is the yield strength, σ b is tensile strength, K is the strength coefficient, n is strain-hardening exponent, and v is Possion’s ratio. In order to verify these parameters, the tensile specimens were made to do tensile test. The specimens were made along 0°, 45°, and 90° to the rolling direction. Figure 2 shows the stress–strain curves along 0° to the rolling direction. Table 2 shows the measured materials parameters. From Table 2, we can see that the yield strengths and tensile strengths are smaller than those of Table 1. These should be considered in the fatigue prediction.
Materials parameters.


Engineering stress–strain curves along 0° to the rolling direction.
Measured materials parameters.

Finite element model for static analysis
The static finite element analysis of the wheel includes radial fatigue test and cornering fatigue test. The finite element analysis software used here is UG 9.0. The finite element solver is NX/Nastran. The rim and the disk of the wheel are modeled with the 10 nodes tetrahedron elements. The length of the tetrahedron is set as 6 mm. The finite element model for static cornering fatigue test is shown in Figure 3. The moment arm is modeled with the rigid body element 2 (RBE2). The length of the arm is 1 m. The rim and the disk are fixed together. The force is transmitted through the arm. The force is 2400 N. The cornering fatigue design cycle is set as 400,000. The real arm and bolt connections are not modeled. Bolt holes were removed in order to simplify the simulation. This can save a lot of computation time and hard disk space. The inner edge of the rim is fixed. The finite element model for static radial fatigue test is shown in Figure 4. The tire dimension is 195/65/R15. The tire pressure is 4.5 Bar. The applying force on the wheel is 15,100 N. The radial fatigue design cycle is 500,000. Contact pressure distribution between tire and wheel is shown in Figure 5. Contact pressure is calculated as follows 12


where Wr denotes the distributed pressure, W is a total radial load, b is total width, rb is the radius of the bead seat, θ is the loading angle, and θ0 is the angle at maximum load.

Finite element model for static cornering fatigue test.

Finite element model for static radial fatigue test.
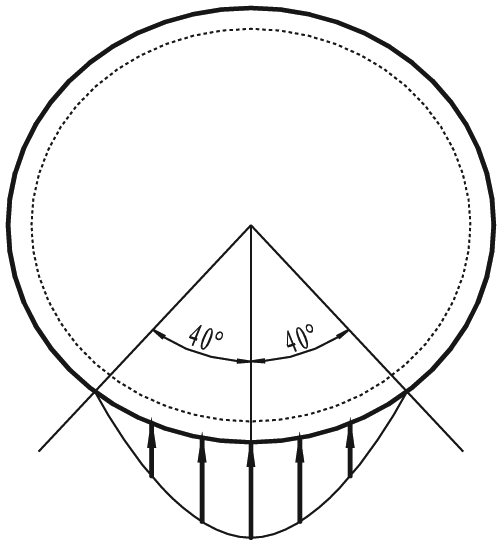
Radial loading schematic.
Fatigue model
In the design of steel wheel, the fatigue prediction plays an important role. Many researchers have studied the fatigue prediction.5–9,13–17 Many softwares, such as Msc.Fatigue, Ncode, Ansys, and so on, have been developed. In this article, a professional software WheelStrength developed by LBF of Germany was used to predict the radial and cornering fatigue tests. The finite element mesh is the same as the model set up by UG9.0. First, the mesh model (*.dat) was imported into WheelStrength. Then, the boundary conditions such as loading, fatigue cycle, and materials were imposed by WheelStrength. The model *.bdf was exported using WheelStrength. Finally, the model (*.bdf) was computed with NX/Nastran. The finite element analysis result of WheelStrength is the required fatigue strength (RFS). If the computed RFS is smaller than the RFS of the material, it is qualified. Otherwise, the geometry or material of the wheel should be modified.
The S-N was used to predict the fatigue of the wheel. The cumulative damage calculation method is the Miner hypothesis,18,19 which can be written as follows
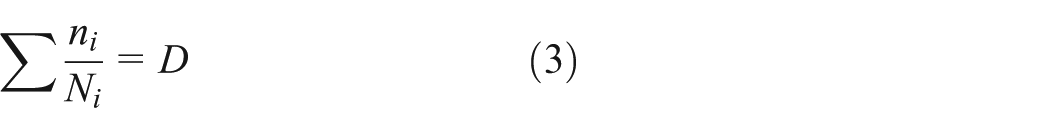


where D is the damage sum, here D = 0.5, Ni is the endurance, ND is the design number of cycles, ni is the step frequency, k is the slope of the S-N line, σ is the stress amplitude, and σD is the knee point of the S-N line (see Figure 1 of Schoenborn et al. 18 ).
The RFS of the wheel can be calculated by iteration as follows

where i is the step number, σD,i + 1 is step (i + 1) knee point of the S-N line. σD,i is step i knee point of the S-N line. Di is the damage sum of i step. First, the load cycle is divided into n1, n2, ni, …, a start RFS is given such as 200 MPa. Then, Ni is computed by equation (4) or (5). D is computed by equation (3). If D is not equal to 0.5, a new RFS is computed using equation (6). The iteration starts. When the D is equal to 0.5, the RFS is arrived.
Finite element model for interference analysis
In the assembly of the disk and the rim, there is an interference fit between the disk and the rim. The interference value has large effect on the wheel. During the assembly of the disk and the rim, the disk is pressed into the rim by a punch. A stamping process was introduced to analyze the interference fit. The assembly process was simulated by axisymmetric finite element. The symmetry axis is X-axis. The thickness of the rim is 1 mm. The thickness of the disk is 3.8 mm. The element size of the rim is set as 0.3 mm × 0.3 mm. The element size of the disk is set as 1 mm × 1 mm. Full Newton–Raphson iteration strategy was employed. Real stress–strain curve was used based on the experiment data. Coulomb’s frictional law with a constant die friction coefficient 0.1 was used in the simulation. Figure 6 shows the finite element model and mesh for interference analysis.

The finite element model for interference analysis: (a) model and (b) mesh.
Results and discussion
Stress analysis with uniform thickness rim
In the design of steel wheel, the thickness of the rim and disk is the most important factor. With the increase in the thickness, the weight and cost of the wheel increase and the fuel economy decreases. There are two most important factors including material type and the sheet thickness in the lightweight design of vehicle. In this study, the material used is fixed. The thickness of the rim was studied. First, the cornering and radial fatigue tests were simulated using a 2-mm-thick rim. Figure 7 shows the simulation results of the cornering fatigue with 2-mm-thick rim. It can be seen that the largest Von Mises stress region is in the disk. The stress in the rim is not even. The Von Mises stress is larger in places 1, 3, and 4 than other places (see Figure 7(b)). The thickness of the rim with the small stress can be reduced. Figure 8 shows the simulation results of the radial fatigue with 2-mm-thick rim. It can be seen that the largest stress region is in the rim, and as well the stress in the rim is not even. The stress is larger in places 1, 2, 3, and 4 than other places. The largest stress of the radial fatigue test (see Figure 8) is smaller than that of the cornering fatigue test (see Figure 7). The Von Mises stress of the rim in radial and cornering fatigue test is generally small. The largest stress is place 1. And place 5 is the symmetric region of place 1. The stress in place 5 is small because no force is imposed on the cornering fatigue test. In reality, the tire air pressure is applied on places 1 and 5. In the stress analysis, the tire air pressure is not considered. So the thickness of the rim can be reduced except places 1 and 5 (rim flange) through the stress analysis.
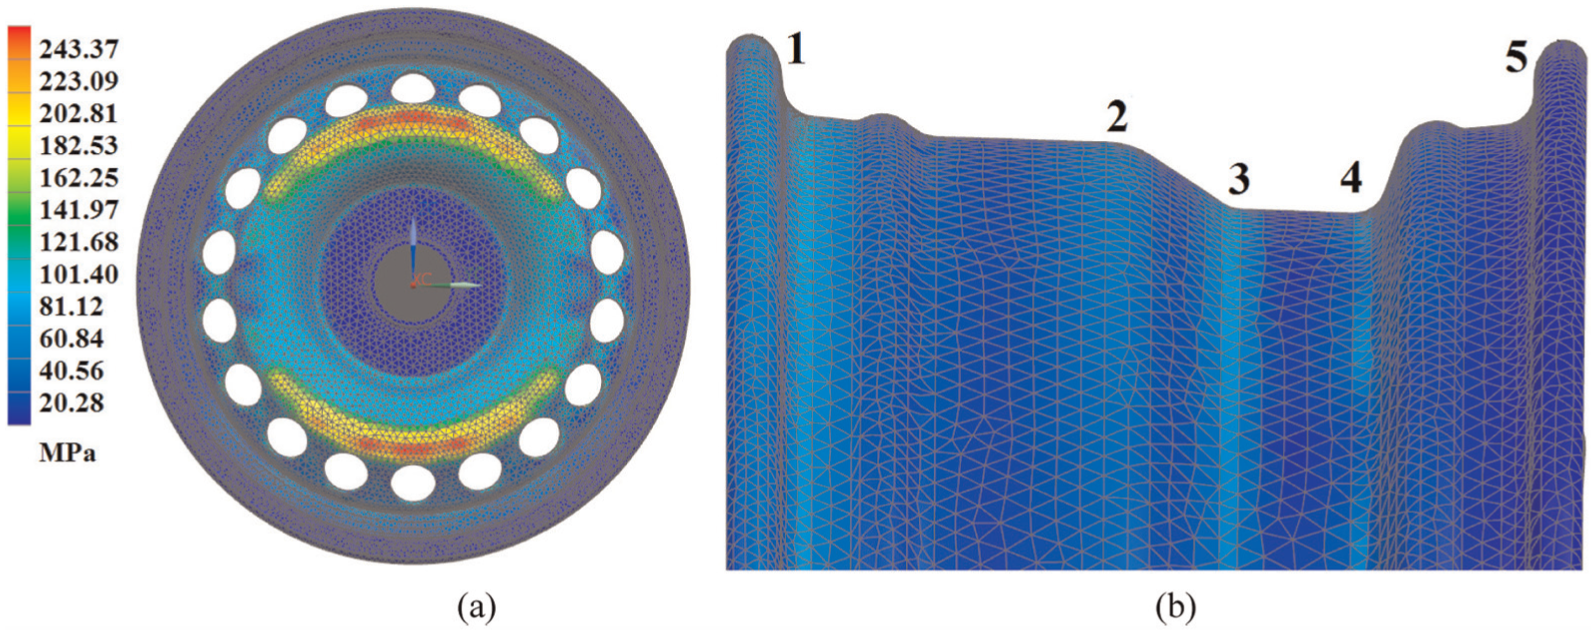
Simulation Von Mises stress distributions of cornering fatigue with 2-mm-thick rim: (a) lateral view and (b) frontal view.

Simulation Von Mises distributions of radial fatigue: (a) lateral view and (b) frontal view.
Fatigue analysis
The fatigue analysis includes cornering and radial fatigue test. Figure 9 shows the simulation RFS of the cornering fatigue test. It can be seen from Figure 9 that the largest RFS (234.2 MPa) is in the disk, and this area is the region that was suffered the largest stress. Owing to the wheel rotation and homogeneous material, the fatigue results are circumferential symmetrical distribution. And in stress analysis (see Figures 7 and 8), the applying force is in one direction, so the stress distribution is not symmetrical. Figure 10 shows the simulation results of the radial fatigue test. It can be seen that the RFS values are not even in the rim and disk. The largest value is in the wind hole. The RFS value in the radial test at the rim flange is larger because the force is applied directly in this region, while it is nearly zero in cornering fatigue test (see Figure 9) owing to not applying force and being fixed. The areas with the larger RFS agree well with the areas with larger stress.
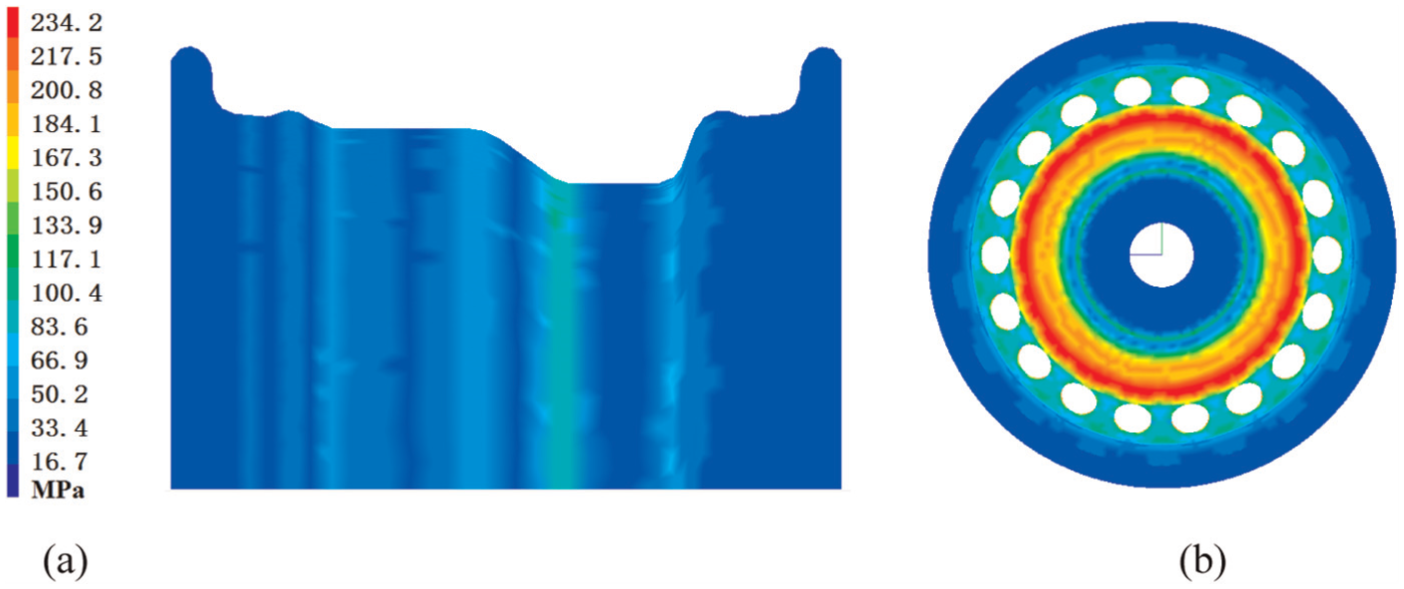
Simulation RFS results of the cornering fatigue test: (a) lateral view and (b) frontal view.

Simulation RFS results of the radial fatigue test. (a) lateral view and (b) frontal view.
Interference analysis
Figure 11 shows the simulation process of the interference analysis. The base and punch contact the rim and disk first (see Figure 11(a)). Then, the base is fixed. The punch moves and the disk is pressed into the rim until it reaches the position (see Figure 11(b) and (c)). Finally, the punch moves reversely and the residual stress is released.

Simulation process of the interference analysis: (a) 0 step, (b) 30 step, (c) 50 step, and (d) 55 step.
Figure 12 shows the Von Mises stress distribution with an interference fit of 0.7 mm. It can be seen from Figure 12 that the stress is concentrated at the interface of the rim and disk, and the stress at the other areas is nearly zero. So the interference fit has great effects on the interface. The interface of the rim and disk will be welded after interference connection. So the thickness of the part near the interface should not be reduced. Figure 13 shows the stress distribution with different interference fits. The interference fits are 0.8, 1, 1.2, and 1.5 mm. The interference fit is changed through moving the disk along the Y-axis when fixing the rim. It can be seen from Figure 13 that with the increase in the interference fit the deformation of the rim increases. When the interference is smaller than 0.8 mm, the stress of the rim is nearly zero. When the interference fit is larger than 1.2 mm, the deformation of the rim is very large and the shape of the rim is destroyed (see the part in the rectangle of Figure 13(d)). So the interference fit should be smaller than 1 mm.

Von Mises stress distribution with an interference fit of 0.7 mm.
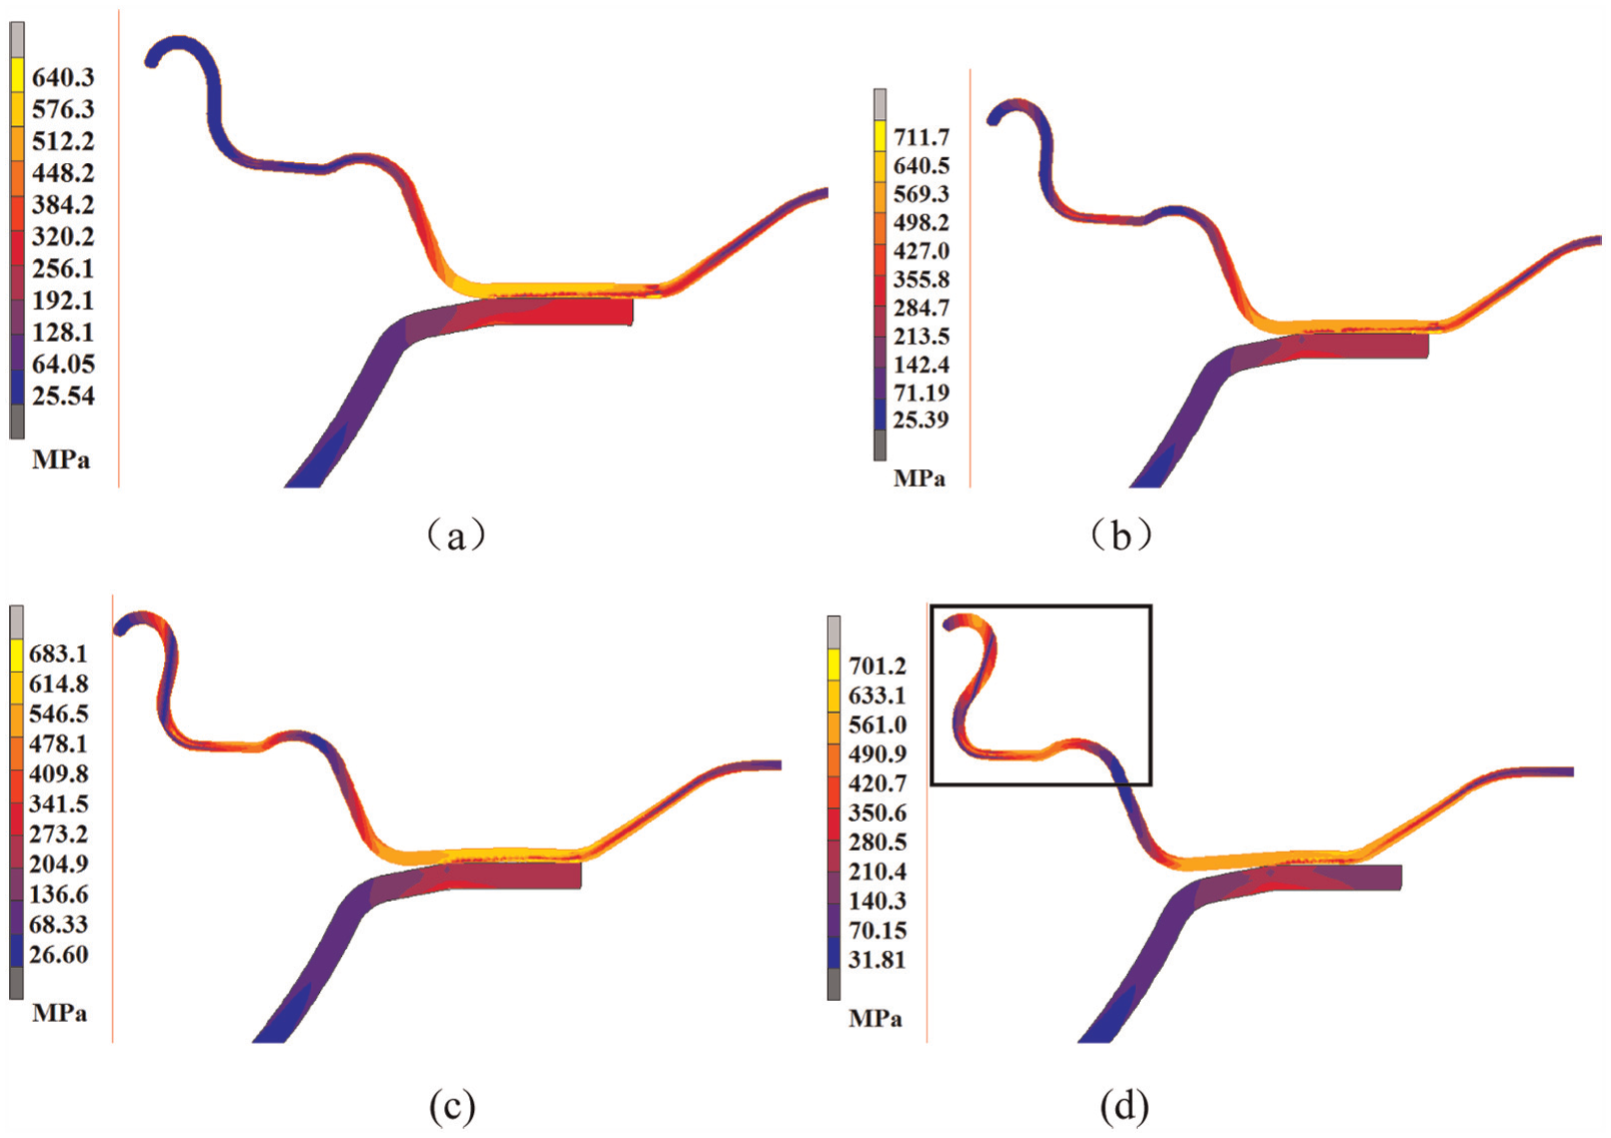
Von Mises stress distribution with different interference fits: (a) 0.8 mm, (b) 1 mm, (c) 1.2 mm, and (d) 1.5 mm.
Optimal regions of rim
According to the stress and fatigue analysis above, the thickness of the rim can be reduced except the rim flange. In the interference fit analysis, the stress is focused in the interface of the disk and rim. And these regions cannot be thinned as well. The optimal regions of rim are shown in Figure 14. The regions of A, C, and E of the rim as shown in Figure 14 are not thinned. The other two regions of B and D are thinned. In order to study the effect of the thinning amount on the fatigue and strength of the rim, different thicknesses of the regions B and D (1.75, 1.5, and 1.25 mm) were analyzed. The thickness of A, C, and E is 2 mm.

Optimal sections of rim.
The stress and RFS distributions are similar to the distributions of the rim with 2 mm thickness, as shown in Figures 7–10. In order to comparing the results of the stress and RFS distributions, the sample points were taken from the rim. The sampling distribution is shown in Figure 15. Figure 16 shows the Von Mises distributions of the rim with different thinning amounts. It was found that the stress was not even in the rim. There are five peaks in the curves of both the cornering and radial fatigue tests. The five peaks of the cornering fatigue test are in the sample points of 2, 4, 10, 12, and 14. It is nearly zero at points 17–20 because of not applying force in simulation. Initially, the largest stress is at the point of sample 2. With the decrease in the thickness of the rim, the Von Mises stress increases and the largest stress is at the point of sample 4. The five peaks of the radial fatigue test are in the sample points of 2, 4–6, 10, 12, and 16–18.

Sampling distribution of the rim.

Von Mises stress distributions of the rim with different thinning amounts: (a) cornering fatigue test and (b) radial fatigue test.
Fatigue is the main property of the wheel. Figure 17 shows the RFS distribution of the rim with different thinning amounts. There are four peaks in the cornering fatigue test. The four peaks are in the sample points of 7, 10, 12, and 14. The maximum RFS is about 100 MPa at point 12. There are five peaks in the radial fatigue test. The five peaks are in the sampling points 2, 5, 12, 14, and 17. With the decrease in the thickness of the rim, the RFS value increases. In order to assess the strength and fatigue, date mining and experimental data are used. For the rim, the RFS can be written as follows 19

where RFS Rim is the RFS of the rim and σ s is the yield strength.

RFS distribution of the rim with different thinning amounts: (a) cornering fatigue test and (b) radial fatigue test.
According to the data of Tables 1 and 2, the maximum allowable RFS for the rim is 179.6 MPa. The RFS of the 1.25-mm rim is larger than 179.6 MPa, so the 1.5-mm-thick rim is better.
Experiments
The HSS rim is very hard to be formed. In this article, a new flow forming die is designed to form the HSS rim. Figure 18 shows the spinning process of the rim. The spinning die contains two parts. One part has a groove. In the spinning process, the blank is first spun into the groove and fixed. Other parts of the blank are spun according to the optimal thinning region of the rim. Here, it is 1.5 mm, as shown in Figure 14. Figure 19(a) shows the photo of the spinning part. Figure 19(b) shows the photo of rolling part after line cutting for thickness measurement. Figure 20 shows the thickness distribution of the rim. The horizontal coordinate-axis (section length) is the length of the cross-sectional length of the rim of Figure 19 (along the points of Figure 19(a) and the cross section of Figure 19(b)). After spinning, the thickness distribution of the rim was changed. The minimum thickness after spinning is 1.6 mm. The thickness of rolling part (finial shape) is smaller than that of the spinning part. The minimum thickness of the rolling part is 1.55 mm. The thickness of the rolling part changed little.
The spinning process.

The photo of the rim: (a) spinning part and (b) rolling part.

The thickness distribution of the blank.
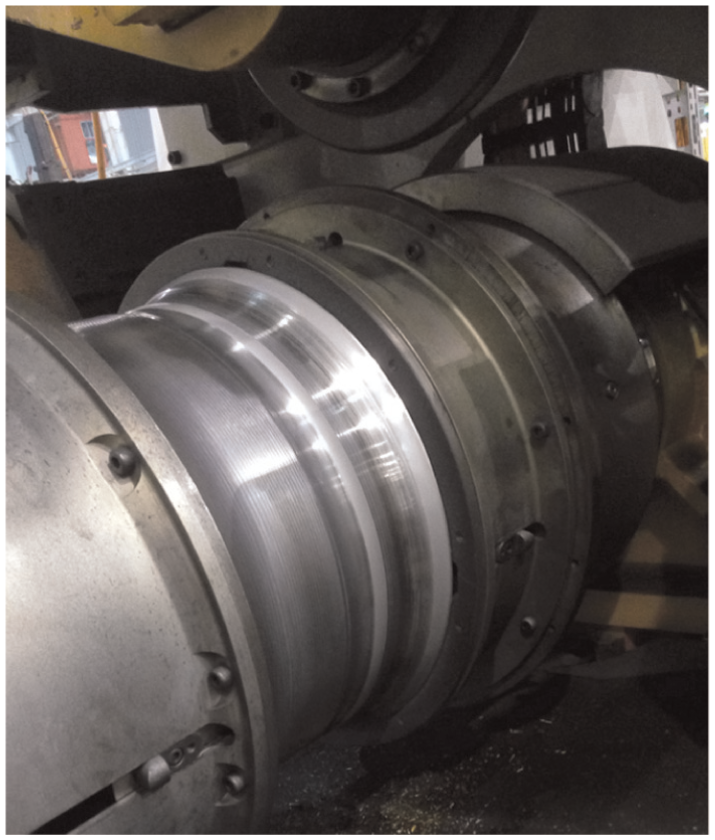
Figure 21 shows the wheel after assembly. Before application, the wheel was verified using fatigue test. Table 3 shows the fatigue test results. It can be seen from Table 3 that the fatigue cycles of the radial and cornering tests were larger than the design. The parts meet the design requirements. The rim after thinning is 3.46 kg. The weight of the rim was reduced by about 14% (0.55 kg).

The photo of the wheel after assembly.
Fatigue test results.

Conclusion
In this work, we summarized the design method of equal strength rim based on stress and fatigue analysis using finite element method. On the basis of above-reported results, the following statements can be derived:
Stress analysis with equal thickness shows that the stress in the rim is not even. The stress in radial and cornering fatigue test is generally small. The fatigue analysis using WheelStrength software showed that the areas with the larger RFS agreed well with the areas with larger stress.
A stamping process was applied to analyze the interference fit. The assembly process was simulated by axisymmetric finite element. With the increase in the interference fit, the deformation of the rim increases. When the interference is smaller than 0.8 mm, the deformation of the rim is nearly zero. When the interference is larger than 1.2 mm, the deformation of the rim is very large and the shape of the rim is destroyed. So the interference fit should be smaller than 1 mm.
The thicknesses at the rim bead and interface between rim and disk cannot be reduced because the stress and fatigue are larger. The optimal section of rim was obtained. The comparisons of stress and fatigue simulation results were carried out by different thinning amounts. The best thickness of the optimized zone 1.5 mm was gotten.
Spinning was used to form the blank of the rim. The thickness of the rim after spinning and rolling forming agrees well with the design. The fatigue experimental results showed that the wheels met the design requirement. The weight of the rim was reduced by about 14%.
Footnotes
Acknowledgements
The authors would like to thank Professor M. Ding for guidance and the help of Dong Ping and Hao Bin during the work.
Academic Editor: Filippo Berto
Declaration of conflicting interests
The author(s) declared no potential conflicts of interest with respect to the research, authorship, and/or publication of this article.
Funding
The author(s) disclosed receipt of the following financial support for the research, authorship, and/or publication of this article: The research is supported by the Zhejiang Provincial Top Key Discipline of Mechanical Engineering (GK160203201003/010).