
Abstract
The fractal characteristics of urban forms and road networks can provide extremely useful information for urban planning. Previous research, however, has hardly acknowledged the fractal nature of transit networks, although this topic is of vital importance given the significance of public transit to city operations. In this study, the fractal characteristics of urban surface transit and road networks were analyzed based on the case study of Strasbourg, France. Two fractal dimensions that are most widely used, the length dimension and branch dimension, were calculated and analyzed using regression and correlation analysis. The results show that surface transit networks are fractal in seven sub-districts of Strasbourg. Furthermore, a relationship was found between the length dimension and branch dimension of road network. The branch dimension of transit network was related not only to the length dimension of transit network but also to the branch dimension of road network. Based on the fractal information, the results suggest possible methods for designing good road and surface transit networks that are well-coupled in urban traffic planning. The implications for urban development are that some potential problems with regard to traffic network structure may exist if current situations are not coincident with some findings in this article.
Introduction
The term “fractal” was first introduced when the length of the coast of Britain was analyzed in depth. It was found that many geographical curves are statistically “self-similar,” although such curves are so detailed that their lengths are usually indefinable or infinite. 1 Later, fractal theory was gradually applied to geometry, complex systems, geography, urban morphology, and so on.2–4 Furthermore, cities were regarded as complex hierarchical systems, 5 and the fractal characteristics of their forms were followed with particular interest. It was because the characteristics could be used to identify urban boundaries 6 and urban pattern designs, 7 which are crucial components of urban studies. As a consequence, it became of vital importance to include fractal theory in the research of urban planning and development. Many other researchers delved into theoretical studies of the fractals of cities. For example, fractal dimensions were calculated based on a box-accounting algorithm for 20 large cities in the United States. Then, the dimensions were regressed to total urbanized areas and total urban populations, and it was found that fractal dimension could not act as a good measure of urban population. 8 Chen 9 believed there was incorrectness in the formula to determine the fractal dimension of urban boundaries, so he proposed a corresponding new formula. A hyperbolic relationship, furthermore, between the boundary dimension and form dimension of cities was derived in order to estimate the form dimension well. In addition to this creative work, he studied on fractal urban forms with special emphasis on their evolution, relationship with land-use structures, and their complex fractal characterization.10–13
As one of the most crucial subsystems of a city, the urban transportation network forms the skeleton for physical extension of cities. Determining whether the transportation network of a fractal city is fractal as well has been of intense interest for researchers. Examples include research into the relationships between the fractal dimensions of urban growth and transportation networks. Such research has confirmed that transportation networks have become increasingly complicated with the growth of cities. 14 Jayasinghe and Jezan 15 studied the relationship between the fractal dimensions of urban forms and transportation networks and concluded that fractal theory can prove effective in simulating urban form changes in certain contexts. On the whole, many studies have shown that urban transportation networks are fractal, which constitutes one of the most important spatial fractals. The study of spatial fractals has been widely applied to various studies of transportation network analysis, traffic flow theory, and so on.16,17 More theoretically, complex network theory was introduced to capture the fractals in spatial structures of urban transportation networks. For instance, Sun et al. 18 proposed an improved box-counting algorithm to determine the fractal patterns of urban transportation networks. It was concluded that the spatial structure is central to the understanding of network complexity. In general, transportation networks have received much attention in the fractal literature in the past 5 years.19–24
These research efforts that focus on the fractal nature of urban transportation networks have provided insights for understanding network spatial structures. The term “transportation” here, however, is loosely defined, because previous studies on fractal transportation networks were narrowly aimed at urban road networks and rail networks 25 on the whole. Examples in the literature seldom mention whether an urban surface transit network is fractal. Chances are that the fractal of a surface transit network is tenable. First, it attaches to the road network, which has been confirmed to be fractal, in terms of physical extension. Second, the surface transit network and the subway network are both major components of the urban transit network, so the spatial structure of the two networks are essentially similar. Based on the case of Seoul, Korea, 26 an urban transportation network that is composed mainly of a subway network appears to be fractal. Therefore, it is probable that the analysis results of fractal characteristics of the surface transit network would be significant. The relationship between the fractal dimensions of a surface transit network and those of a road network can also be found if a fractal surface transit network is observed. It is believed that studying on fractal characteristics is crucial for understanding the evolution of complex urban systems. Furthermore, surface transit systems have clear advantages over other urban traffic systems in alleviating congestion and reducing pollution.
Clearly, the layout of surface transit networks in different cities is unique and distinctive due to the differences in their urban transport modes. For this study, we concentrated on candidate study cities that did not have complex underground rail transit systems. The surface transit system should be able to distribute a relatively large number of passengers within its various public transportation systems. European cities, such as London and Paris, for instance, were not considered because their subway systems took on the major role of distributing passengers. So in this study, Strasbourg, a city in France that does not have a subway system and whose surface transit network distributes the majority of passengers, was selected in order to analyze the fractal characteristics of its surface transit and road networks. First, analysis was conducted to clarify that the surface transit network was indeed fractal, based on which the fractal dimensions of the transit network combined with those of the road network were determined using Strasbourg data. Second, correlation and regression analyses were performed to explore the relationship between the fractal dimensions. Considering that the surface transit network is attached to the road network, the relationships among the transit fractal dimensions, road fractal dimensions, and network density were determined. (Note that “transit network” refers to “surface transit network,” and “traffic network” refers to “road and surface transit network” unless otherwise specified in this article.)
Preliminaries
In this section, an overview of the fractal dimensions and methods to determine the dimensions of an urban traffic network is provided.
Summary of fractal dimension
The fractal concept was proposed to characterize self-similarity, that is, an object is similar to itself when it becomes locally amplified. This self-similarity reflects the universal law of urban space form; thus, many research topics are related to the fractal dimensions of cities including their road networks. The length dimension and branch dimension are the two main fractal dimensions that reflect the fractal characteristics of urban traffic networks. 27 The radius-spreading method is a typical and efficient way to determine fractal dimensions.28,29 This article takes advantage of this method to determine the length and branch fractal dimensions of the road and transit networks. The key points of the method are as follows. First, a center where the road and transit networks are, as near as possible, the densest in the whole district, such as a central business district (CBD) center and an integrated transportation hub, is chosen as the measurement center. It is the center of numerous concentric circles. Note that “CBD center” refers to the center of CBD. Second, all the radii of these concentric circles should form an arithmetic progression, which is acceptable and easy to implement.
Length dimension
The following proportional relationship exists among length (L), area (S), and volume (V) based on plane geometric theory

where M is the generalized volume and d (d > 0) is the Euclidean dimension. Supposing M equals S, then the value of d is 2. Actually, d is unrestricted to a positive integer and changes along with the change of M. When the measure M has fractal characteristics, the corresponding d is defined as the fractal dimension.
It is assumed that a traffic network has fractal characteristics. Under this assumption, a planar region with area S is the focus. According to expression (1), the total network length, PL, in this area has a relationship with S

Using the radius-spreading method, the situation where the area is circular is the focus of our work. Due to the directly proportional relationship between the area and the square of the radius in a circle, we obtain

where k (k > 0) is a constant and d is the length–radius fractal dimension because it is derived from the network length and radius of a region. The length–radius fractal dimension can be referred to simply as the length dimension.
The length dimension reflects the condition of network density change in the whole city or a certain region of the city, which is measured from a center. This statement can be validated through the deformation and derivative of equation (3)


The derivative of equation (3) expressed as equation (5) reflects the rate of network density change. Judging from common sense, the traffic network density in a circular area should decrease from the measure center to surrounding areas when a CBD center or an integrated transportation hub is selected as the measure center. Also, this assertion can be supported by expression (6)
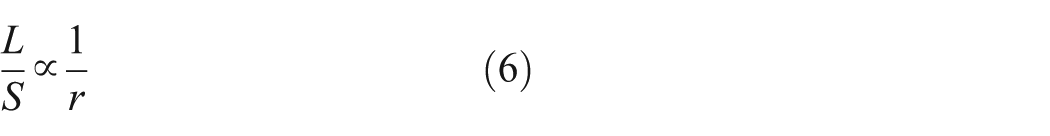
The density, however, probably decreases initially, followed by an increasing trend if there are several CBD areas or transportation hubs in the city. In this case, the fractal characteristics would be significant only in certain regions that cannot cover several CBD areas or transportation hubs. Therefore, when fractal characteristics are not insignificant, d is less than 2 according to equation (5). The method used to validate the significance of the fractal is presented in section “Methods of calculating the fractal dimensions.” The decreasing rate of the traffic network density becomes slower when the length dimension approaches 2. So, in this way, it is confirmed that the role and function of the length dimension is to indicate the condition of network density change.
Based on the analysis presented above, when the fractal characteristics of a transit network are significant in a certain region (e.g. the whole city or district), the value range of the length dimension is (0, 2). The closer the value gets to 0, the faster the network density decreases along with the increase in the radius. In summary, the length dimension can describe the homogeneity of network coverage, and a network is homogeneously distributed when the dimension is close to 2.
Branch dimension
The definition of “branch dimension” is similar to that of length dimension in essence. It is based on equation (7)

where NB is the number of branches in a circular area with radius r and d′ is the branch-radius dimension. θ is a constant here, as well as in the case of the length dimension. The number of branches can be calculated using the node divergence method. This method helps to clarify how many branches a node links to and then records the corresponding branch numbers. Details about the determination of branch numbers of road and transit networks are discussed in section “Data preparation.”
Evident differences arise when it comes to the value range of the branch dimension. The branch dimension value is not less than 1 without an upper bound. On the one hand, it has been determined that the branch dimension is 1 when no link connects any two links in the network. The connectivity of the network is the worst in this case. On the other hand, the dimension can be somewhat large because it is probable that the network connectivity would show improvement from the urban center to its surrounding areas. In this case, the branch dimension is greater than 2, which is different from the case of the length dimension. Although an abnormal situation could arise if the branch dimension was too large for a realistic traffic network, the upper bound is difficult to clarify. To sum up, the value range of the branch dimension is (1, +
Methods of calculating the fractal dimensions
The radius-spreading method used to calculate the fractal dimensions is presented below. Regression analysis is performed to achieve this purpose. Taking the length dimension as an example, we take the logarithm at both sides of equation (3)

where C is a constant. The total length of the traffic network in a region determined by different lengths of radii is calculated via geospatial analysis so that a series of data points can be obtained. Then, regression analysis is conducted while d, the length dimension, is calculated by calibrating equation (8). This method is similar to that used to determine the branch dimension. The fractal in a region is tenable when the regression model has a good level of significance. If the significance level is poor, the fractal characteristics are hardly significant when the selection of the measure center and radius is reasonable.
Data preparation
Strasbourg is a city in France with developed surface public transit systems. 30 The trams and buses are major travel modes of public transportation. As a consequence, Strasbourg is selected for this study as a typical European city with no complex underground rail transit. Based on obtained information, 31 the Strasbourg region has several districts. Esplanade, Krutenau, Petite-France, and Gare are the four districts that basically constitute the metropolitan area of Strasbourg. Other districts, such as Cronenbourg Est, are suburban. In this work, urban districts and suburban districts are all considered in order to make some comparisons. Besides, given that the measure centers should be located where the density of the road and transit network is nearly the highest, the circular areas may occupy the fields of other districts in some cases. Therefore, to avoid this problem while those typical districts are still taken into account, Esplanade, Krutenau, Petite-France, Gare, Kable, Contades, Orangerie, Cronenbourg Est, Koenigshoffen Est, Plaine des Bouchers, Schluthfeld, and Neudorf Est become the 12 districts selected for this study. Then, these districts comprise five big districts: BD1, BD2, BD3, BD4, and BD5. BD1 is made up of Esplanade, Krutenau, Petite-France, Gare, Kable, Contades, and Orangerie. BD2 is the Cronenbourg Est. BD3 is the Koenigshoffen Est. BD4 consists mainly of Plaine des Bouchers, and BD5 comprised Schluthfeld and Neudorf Est.
BD1 is the main city district that covers the widest area among the five big districts, and the others are suburban districts. Three measure centers within BD1 and one, respectively, within the other four big districts are selected according to the principles described above, which means seven sub-districts, referred to as S1, S2, S3,…,S7 are the focus. Considering the scale of these sub-districts and the need for sufficient samples to ensure the validity of the regression analysis, the number of concentric circles is set as 6. The determination of the minimum and maximum values of the radii follows the same rules as those recommended in Benguigui. 25 The two critical values of the radii, therefore, are set as follows: (1) for S1, S2, S4, S6, and S7 from 130 to 330 m and (2) for S3 and S5 from 90 to 290 m. It can be calculated that the difference of the radius values is uniformly 40 m. The circular areas and their locations shown in Figure 1 allow the determination of the total length and total number of branches for the road and transit networks.

Concentric circular areas of sub-districts (a) S1, (b) S2, (c) S3, (d) S4, (e) S5, (f) S6, and (g) S7; (h) location of seven sub-districts.
Then, the network lengths and number of branches within those circular areas are recorded based on Google Map. Multiple bus lines contribute to the network lengths and branches. For instance, three bus lines operate unidirectionally on a road segment with length L, which thereby adds 3·L to the total transit network length. For the branches, the counting method is similar. To make our data accurate, several points require special attention during the data acquisition process. First, the direction of road segments and transit lines needs to be considered. When a road or transit link is dual, the multiplier 2 is needed, so 6·L will be added to the total network length if the three mentioned bus lines are all dual. The one-way traffic and discrepancy between upstream and downstream bus lines, thus, could be considered in this way. After the total length and number of branches are determined, they are divided by 2 to obtain the unidirectional network length and branch numbers, which is in accordance with usual practice. As a result, although the total number of branches must be an integer, the unidirectional branch numbers needed in this study are possibly decimal. Second, dead-end roads and those not amenable to transit use are not counted in this research. It is believed that such roads do not achieve a transit function and they should never contribute to transit network structure.
Finally, the data regarding network length and number of branches are acquired as shown in Table 1. It is not difficult to see that the lengths and branch numbers of S3 and S5 are fewer in general. This is reasonable because the minimum and maximum values of their radii are lower than those of the other five sub-districts as is aforementioned. Besides, S6 and S5 seem to be poorly covered with the road network and transit network, respectively, in terms of network complexity, which coincides with observations from the website map of the Strasbourg transit network. To sum up, the data acquired in this research are reasonably accurate.
Radius, network length, and branch numbers of seven sub-districts.

Results
Fractal dimensions in different areas
According to section “Methods of calculating the fractal dimensions,” regression analysis is conducted, and the results for S1 are shown in Figure 2; the results for the other sub-districts are not displayed here. Due to the fact that the R2 values of all the regression equations for the seven districts are larger than 0.95, the fractal characteristics of these sub-districts are significant for both the surface transit network and road network. In this way, it found that the surface transit networks in the seven sub-districts of Strasbourg are all fractal.

Results of regression analysis to determine fractal dimensions for S1.
The length and branch dimensions along with their R2 values for the seven sub-districts are presented in Table 2. According to the table, although the total length of the transit network is generally the longest, S1 has the smallest transit length dimension, proving that its network is not homogeneously distributed. This indicates that any relationship between network density and coverage homogeneity is possibly irrelevant. The electronic maps show that the transit network in S1 has an evident concentration in a certain region with a fairly small area. The network density attenuates quickly with distance away from this region in S1, which means that the transit network has poor coverage homogeneity. The results, therefore, reached using the length dimension of S1 correlate with the observations. More similar analyses could be conducted.
Length and branch dimensions along with relevant statistics.
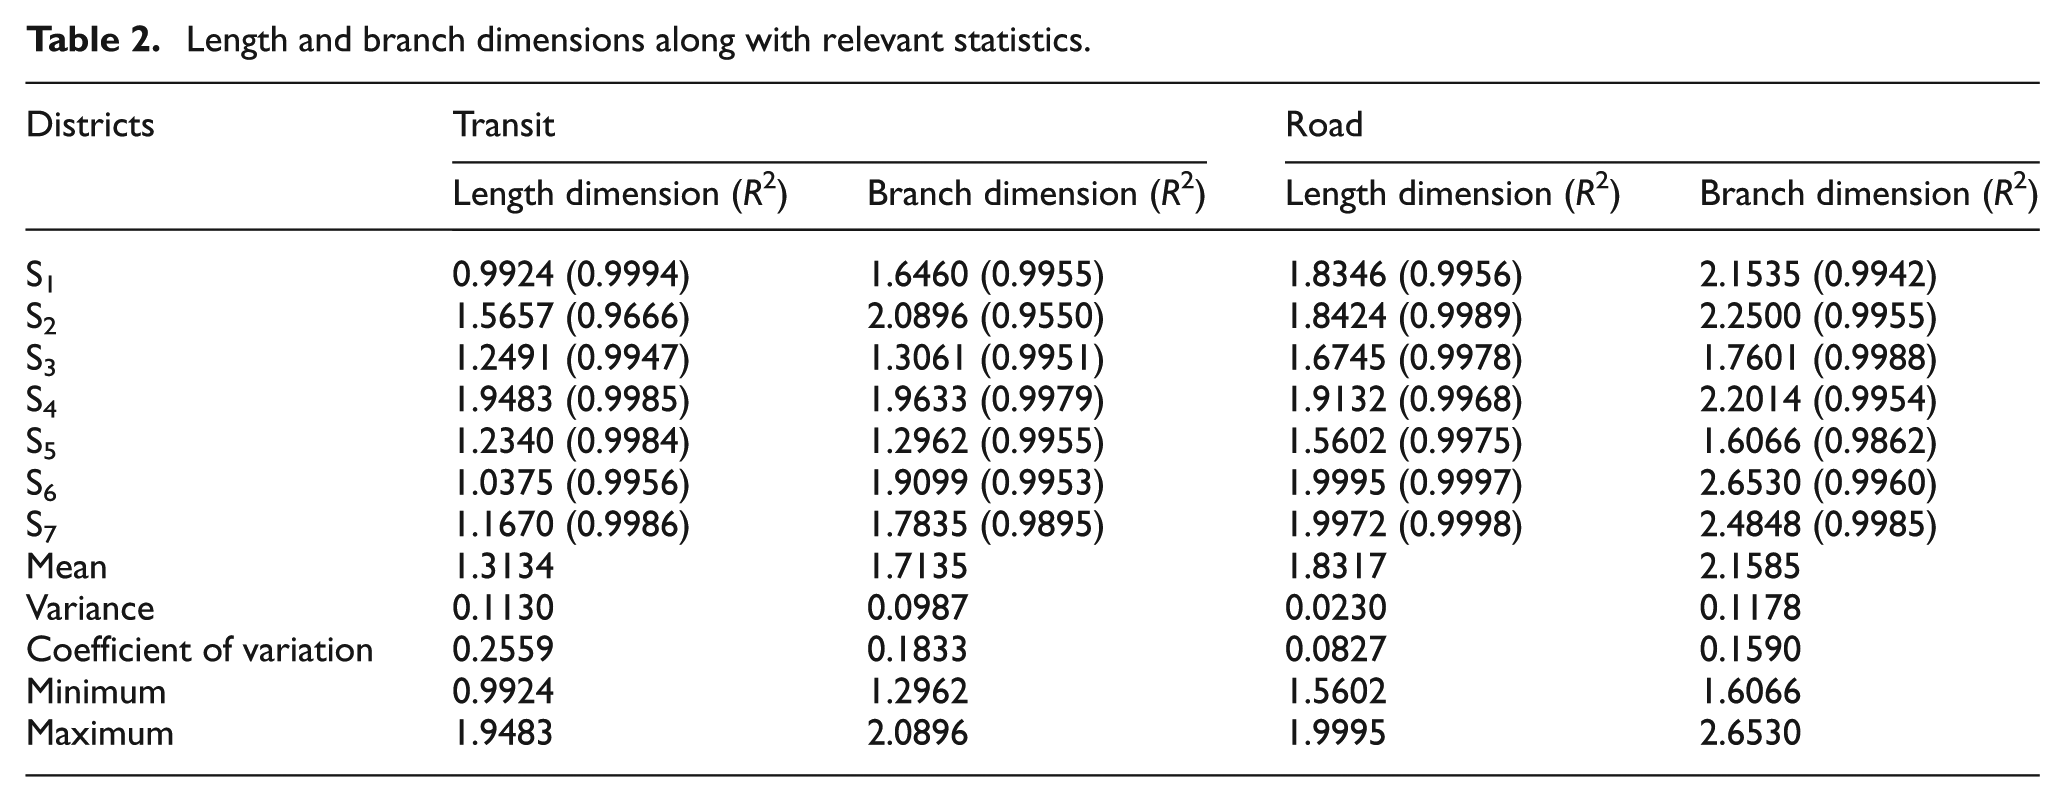
In addition, the mean and variance of the fractal dimensions are determined. The mean of the two length dimensions far exceeds 0, indicating that the networks in Strasbourg have fairly good coverage homogeneity. As for the two branch dimensions, they both have large values, and the dimension of the road network is greater than 2. These mean that both the transit and road networks have quite good connectivity and that the road network connectivity of the suburban areas is not necessarily inferior to that of the urban areas in Strasbourg. The variance or coefficient of variation is a concern when the difference between the fractal dimensions for every two sub-districts is observed. It is concluded that road network coverage homogeneity is relatively the most consistent among these sub-districts.
Meanwhile, for Strasbourg, the branch dimensions of both the transit and road networks are larger than their length dimensions, respectively, indicating that the variation of the branches is more significant than that of the length in the networks. Also, the road network dimensions are larger than those of the transit networks. It is reasonable to find that the surface transit network is not as homogeneously distributed as the road network which has better connectivity as well. Detailed analysis concerning the relationship between the different fractal dimensions is made in the following sections.
The relationship between length and branch dimension
The correlations between the two transit dimensions and between the two road dimensions are determined in order to discern the relationship between the length and branch dimensions. The correlation coefficients are found to be 0.4263 and 0.8759, which shows a loose correlation between the two transit dimensions and a fairly strong correlation between the two road dimensions.
Based on the correlation analysis, unitary regression analysis is conducted between the road length and branch dimension. Using all the seven sample points, the results of the subsequent regression analysis are shown in Figure 3. The road length and branch dimension are highly correlated judging from their large correlation coefficient, which is close to 1, and the R2 that is higher than 0.90. So, the regression equation (9) is able to represent the linear relationship between the two fractal dimensions of the road network

where x denotes the road length dimension and y denotes the road branch dimension.

Regression analysis of two road fractal dimensions.
Due to the loose correlation between the transit length and branch dimension, unitary regression analysis is not ideal as with the two road fractal dimensions. Multivariate regression analysis requires more independent variables. Comparing the significance of different multivariate regression models by trial-and-error, the bivariate regression model shown in equation (10) is adopted. Data for the regression can be seen intuitively from Figure 4(a)

where x1 is the transit length dimension, x2 is the road branch dimension, y is the transit branch dimension, and a0, a1, and a2 are the parameters of the regression equation.

Regression analysis of two transit fractal dimensions: (a) data points and relation of their spatial position and (b) regression plane.
The bivariate regression analysis is performed using SPSS, and we obtain the R2 value as 0.916, which is larger than 0.9. The significant values of x1 and lnx2 are 0.004 and 0.018, respectively, and they are both smaller than 0.05. The regression model, therefore, proves significant. It is not difficult to figure out the regression plane shown in Figure 4(b) using the regression equation (11)

Although the correlation coefficient between the transit length and branch dimension is rather small, a linear relationship between them can be observed when the road branch dimension is controlled. In summary, a linear relationship exists between the length dimension and branch dimension for both transit and road networks.
The relationship between surface transit and road networks
The relationship between the road and transit fractal dimensions is analyzed in depth. Their correlation coefficients are shown in Table 3. The coefficients between the road and transit length dimension and between the road branch and transit length dimension are both far less than 0.5, which indicates only a small correlation. So, the coverage homogeneity and connectivity of the road network make only a slight difference to the transit network coverage homogeneity in Strasbourg.
Correlation between road and transit fractal dimensions.
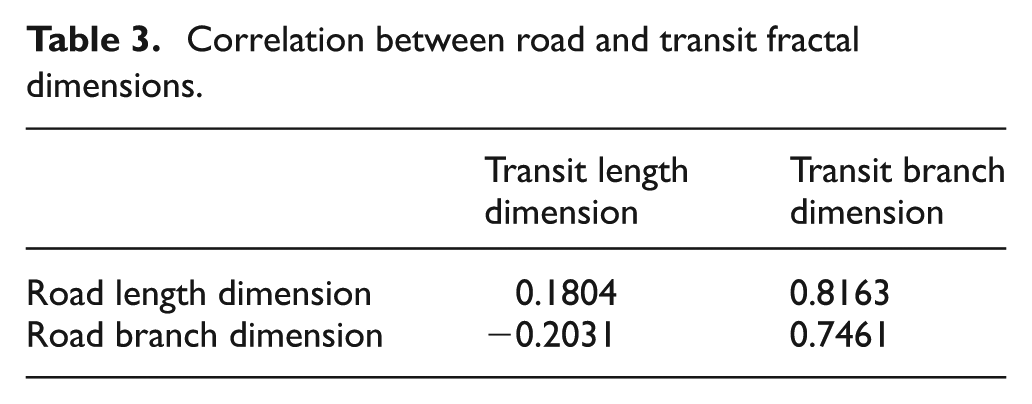
This scenario is the opposite when the transit branch dimension is observed. The road length dimension is highly correlated with the transit branch dimension, so the road network coverage homogeneity has a great effect on the connectivity of the transit network. As for the road and transit branch dimensions, their correlation is fairly strong though the coefficient is not so large. The reason is probably that the transit branch dimension is not directly related linearly to the road branch dimension, which can be observed through equation (11). This equation captures the linear relationship between the transit branch dimension and the logarithm of the road branch dimension when the transit length dimension is controlled.
In short, road fractal dimensions have evident impacts on the surface transit network in terms of its connectivity rather than its coverage homogeneity. For Strasbourg, this result probably reveals that transit network coverage homogeneity is affected mostly by the layout of all bus lines itself, whereas its connectivity is more restricted by the homogeneity and connectivity of the fundamental road network.
It is known that surface transit networks attach to road networks, so their characteristic indicators should be strongly related. Nevertheless, not all the characteristics between transit and road networks have much correlation based on the previous analysis. To conduct further analysis, correlations between road and transit network density, road network density and transit length dimension, and road network density and transit branch dimension are investigated. This investigation also contributes to understanding the effects that an increase in road network density has on the characteristics of the transit network. The correlation coefficients are calculated to be 0.5232, 0.5013, and −0.0136 in sequence. (The data for calculating network density are presented in Table 1.) Accordingly, road network density is found to have some effect on the density and length dimension of the transit network, as the two correlation coefficients are slightly larger than 0.5. So, road network density affects not only the coverage intensity but also the coverage homogeneity of the surface transit network. However, this makes no difference to transit network connectivity. These findings support our assertion that some characteristics of the transit and road networks have little correlation with each other.
Discussions
In urban traffic network planning, the fractal dimensions of road and transit networks, which far exceed 0 in Strasbourg, should be as large as possible unless factors such as economics are taken into account. Nonetheless, there is usually a trade-off between the construction of infrastructure and economic investments. When an evaluation is made for road and transit networks in a city, the networks in the districts whose fractal dimensions are generally lower than the mean of those of the whole city should be given special attention. The implication is that some problems that are inherent of the network structure may exist in the planning work.
Many potential relationships between fractal dimensions and other network indicators are found in this study. For example, a linear relationship between the length and branch dimension exists for both the transit and road networks. To support this conclusion, correlations between the lengths and branch numbers of the two networks, respectively, are studied for all the circular areas. The correlation coefficients are 0.9141 and 0.9229 for the transit network and road network, respectively, thereby showing that a strong correlation exists between the lengths and branch numbers for both networks. Also, the two related scatter plots can be observed. As is shown in Figure 5, the points are uniformly distributed on both sides of the lines by and large. Thus, the lengths and branch numbers are highly correlated for both the transit and road networks. To some extent, this finding strengthens the significance of the two regression equations concerning the relationship between the length and branch dimension determined in this work. Although the transit length and branch dimension are not directly correlated in Strasbourg, the lengths and branch numbers in the transit network show an unexpectedly strong correlation. Consequently, it is posited that under certain conditions, the transit branch dimension can be unitarily regressed linearly using the transit length dimension, which is similar to the case of the road network to which the surface transit network attaches. In order to clarify this conjecture, more studies on fractal characteristics of transit networks in various regions are needed.
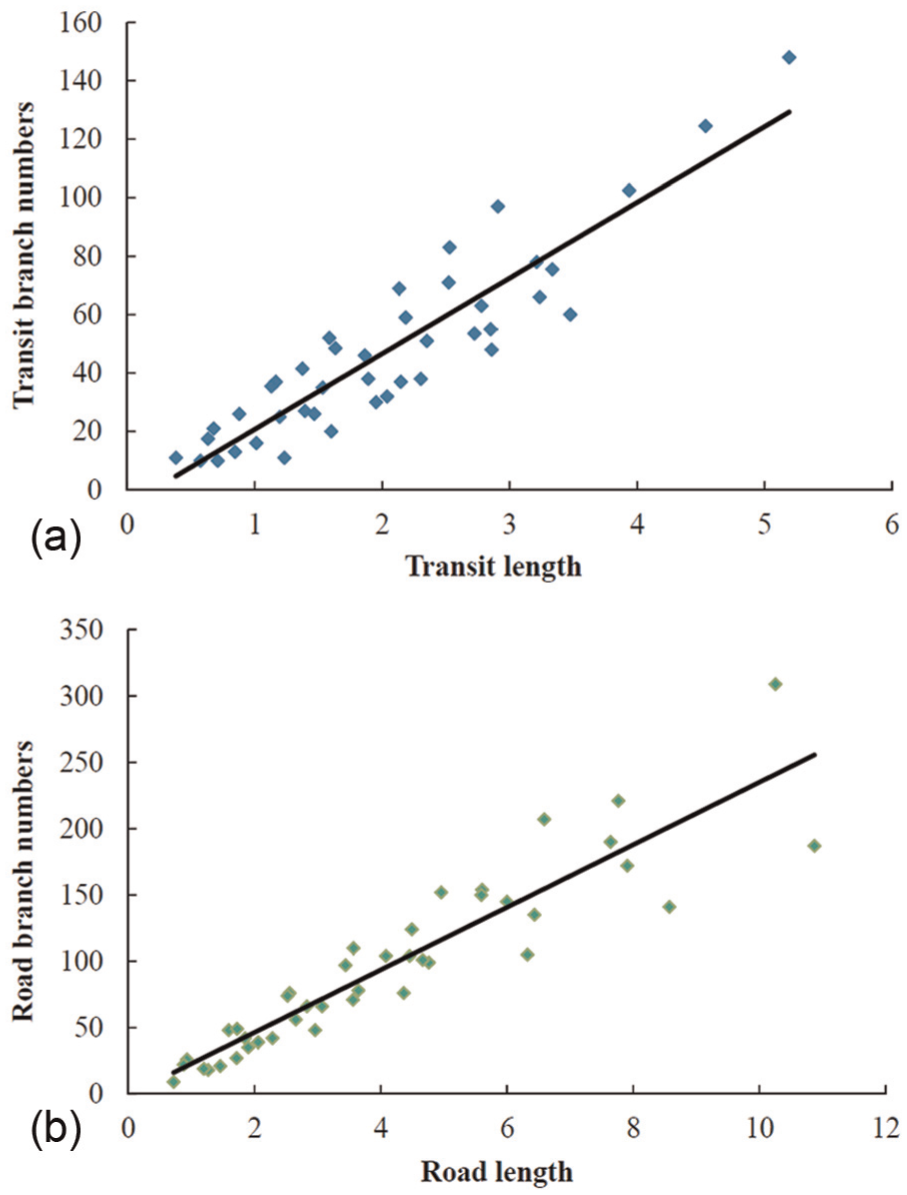
Scatter plots of lengths and branch numbers of (a) transit network and (b) road network.
Surface transit networks attach to road networks, but many characteristics between the two networks have little correlation with each other. This finding may reflect the European urban transport mode where the private car and public transportation hold equivalent status in terms of their development. When conducting urban road and transit network planning in cities whose situations are similar to those of Strasbourg, it is of great value to focus on the correlation between the following network indicators: (1) transit branch dimension and road length dimension, (2) transit branch dimension and road branch dimension, (3) transit network density and road network density, and (4) transit length dimension and road network density. Other correlations are not as valuable as these four because the correlation between some indicators is poor. In section “Fractal dimensions in different areas,” for instance, possible irrelevance between network density and coverage homogeneity is observed, which can be further supported through correlation analysis. The correlation coefficients are −0.1623 and −0.0251 for the transit and road networks, respectively. The network density and length dimension show little correlation for both networks, which coincides with their significance because an intense network never indicates a homogeneous network. Therefore, different network indicators should be jointly considered for rational and comprehensive traffic network planning.
Conclusion
In this study, the fractal characteristics of surface transit and road networks in Strasbourg are quantified and the relationships between fractal dimensions and network density are analyzed in depth. The conclusions can be extended to other European cities without complex underground rail transit systems at least. This study verifies that a surface transit network is fractal, validating its length and branch dimensions while further proving the previous conclusion that road networks are fractal. Furthermore, for urban road and transit network planning, both networks should have good coverage homogeneity and connectivity, which is not paradoxical to the traditional belief that large density of a network should be ensured in traffic planning. Various aspects of a network, its fractal dimensions and network density included, should be taken into account simultaneously. In addition, road length dimensions ought to be the most consistent among all the mentioned fractal dimensions when focusing on various zones of a city. That is, network coverage homogeneity, rather than network density, should be approximately at the same level for road networks in different urban zones.
The relationship between the length and branch dimension acts as a crucial reference for determining the layouts of road and transit networks. In general, the branch dimension should be larger than the length dimension for both networks. The correlation between the road length and branch dimension is very strong, and a linear relationship also exists between the transit branch dimension and two variables, that is, the transit length dimension and the logarithm of the road branch dimension. When traffic planning is conducted, these relationships between the length and branch dimensions should be tenable in the layout schemes of road and transit networks. The specific regression equations for the length and branch dimensions are also useful, especially in new town planning. These equations could be determined by the existing sub-districts of a city. Then, the future network fractal dimensions in the planned new town should satisfy the equations, providing guidance for determining the layouts of traffic networks in the new town planning.
The surface transit network attaches to the road network, so the indicators that have some correlation ought to be involved in the synchronization process. The correlations include the road length dimension and transit branch dimension, road branch dimension and transit branch dimension, road network density and transit network density, and so forth. This synchronization requires specialists to coordinate the planning of road and transit systems. In addition, in Strasbourg, the two road dimensions are larger than the two transit dimensions, respectively. If the transit dimensions are greater than the road dimensions in another city, it may not be a typical European city without a complex underground rail system. Also, the possibility is that some irrationality lies in the layout of the road or surface transit network. On the whole, our findings can provide significant implications for future urban traffic planning and development.
Footnotes
Academic Editor: Xiaobei Jiang
Declaration of conflicting interests
The author(s) declared no potential conflicts of interest with respect to the research, authorship, and/or publication of this article.
Funding
The author(s) disclosed receipt of the following financial support for the research, authorship, and/or publication of this article: This research was supported by the National High Technology Research and Development Program of China (2014AA110303) and the Foundation for Excellent Young Scientists of Southeast University (grant no. 2242015R30028).