
Abstract
Flight data are recorded in an acoustic beacon. A new signal extraction method led by random decrement technique is proposed to detect sound signals from thousands of meters under the sea. This method involves dislocation superimposed method and cross-correlation function to extract acoustic beacon signals with noise interference. First, the starting point is selected and the length of each segment is determined via two superposition ways. Second, the signal segment for linear superposition is intercepted to complete acoustic beacon signal extraction. Finally, the signals are subjected to cross-correlation and energy analyses to determine the accuracy of interception signals. During the experiment, the collected acoustic beacon signal is used as the test signal, and the signal is obtained as the simulation signal on the basis of the parameters of acoustic beacons. Results show that the correlation between the synthetic and concerned signals is more than 80% after a number of superposition are performed and the extraction effect is remarkable. Dislocation superimposed method is simple and easily operated, and the extracted signal waveform yields a high accuracy.
Keywords
Introduction
A plane is equipped with a flight data recorder composed of an acoustic beacon. When a plane crashes into the sea, flight data recorders, which are commonly known as the black box, are rapidly detected. Acoustic beacons are automatically activated when flight data recorders fall into water. A signal is then sent to water in the form of a specific signal to perform an acoustic positioning for the search equipment. Acoustic beacons can strongly resist shock and ensure that their features are intact after a plane explodes, disintegrates, or violently impacts land or water because acoustic beacons generally work after a plane crashes. Acoustic beacons can function underwater at a depth of 6000 m, and their functional time after entering the water is more than 30 days. 1 Acoustic beacons function at the bottom of the sea, and emitted sound waves are weakened as distance or transmission loss increases when these waves propagate in the ocean. Ocean noise is not subject to people’s control and is dependent on the marine environment or ambient sea noise. Ocean noise is produced through thermal motion of molecules in seawater, marine organisms, ship sailing, and natural phenomena, such as earthquakes, storms, and rain. Signal processing must be optimized because of propagation loss and ambient sea noise interference. Common signal extraction methods are mainly human ear hearing, narrow band filtering, matched filtering, energy detection, fast Fourier transform (FFT) filtering, and adaptive filtering. In underwater acoustic signal processing, short-time Fourier, wavelet, and Hilbert–Huang transforms (HHTs) are three of the most commonly used methods. In 1946, Gabor proposed short-time Fourier transform (STFT) to obtain the spectrum of signals on the basis of the specific translation window function, to extract local information, and to improve the ability of time resolution.2,3 However, STFT is based on Fourier transform. Therefore, this technique cannot fundamentally overcome the limitations of Fourier transform. Morlet et al. 4 initially proposed the concept of wavelet analysis in 1981, and they also transformed signals through expansion and translation to analyze time–frequency localization. This technique is also used to determine the location of sound signal frequency. However, wavelet transform is a kind of Fourier transform with an adjustable window, and the signal in the wavelet window must be smooth; as such, wavelet transform is not free from the limitations of Fourier transform.5,6 In 1998, Huang et al. 7 proposed HHT to analyze nonlinear and non-stationary signals. This technique is different from Fourier transform signal analysis, which fundamentally overcomes the limitations of Fourier transform. Nevertheless, this process is complex and limited to the characteristics of signal processing. These methods have been used to extract signals. A new signal extraction method based on random decrement technique is introduced in this article to extract signals rapidly and accurately. Signals are superimposed and enhanced to a certain extent to extract the required signal.
Cole8,9 originally proposed and developed random decrement technique in 1968. This simple and direct method is used to analyze vibration system data under random excitation action. In 1999, Huang et al.10,11 improved the mathematical basis of random decrement characteristic signal through rigorous mathematical derivation and numerical simulation. Random decrement technique is preliminarily applied to structural damping measurement and fatigue testing in a single-mode response.12,13
Traditional signal processing methods, such as Fourier and wavelet transforms, are used to process acoustic beacon signals. However, these methods yield a large workload and involve complicated processes. Dislocation superposition algorithm has not yet to be used in acoustic beacon signal processing. As such, this method is applied in this study to complete the analog and test analyses and also to compare the proposed method with traditional methods.
Signal extraction algorithm of underwater acoustic beacon
Review
The random decrement technique is based on the superposition principle of the linear system. The measured response signals are used to construct the free attenuation signal, which is used to characterize the structural properties.
Taking the single degree of freedom linear system as an example, the differential equation of motion for a stationary random excitation is

In the formula, M, C, and K are the system’s mass, damping, and stiffness, respectively; x is the system’s motion response; and f(t) is a sample of random inputs.
After applying and finishing the Laplace transform on both sides of equation (1), it becomes

In the formula, F(s) and X(s) are the Laplace transform of excitation and response, respectively; ωn is the natural frequency; ζ is the system damping ratio; and x0 is the initial displacement.
After applying the Laplace inverse transform on both sides of equation (2), it becomes

where x1(t) is the initial displacement caused by the response (step response), x2(t) is the response caused by the initial velocity (impulse response), and x3(t) is the forced response due to excitation (random response).
If x(t) is the total random response, N is the average number of subsamples. The free decay response is

where x(t) is the response signal of the system under stochastic excitation, τ is the independent variable, x(tk) is a set of threshold used in advance for signal interception, tk is the signal interception location, and N is the sum of the interception signals. 14
If the random excitation is the white noise with zero mean value, the attenuation is zero when N is large enough.
Dislocation superimposed method based on the fault diagnosis technique
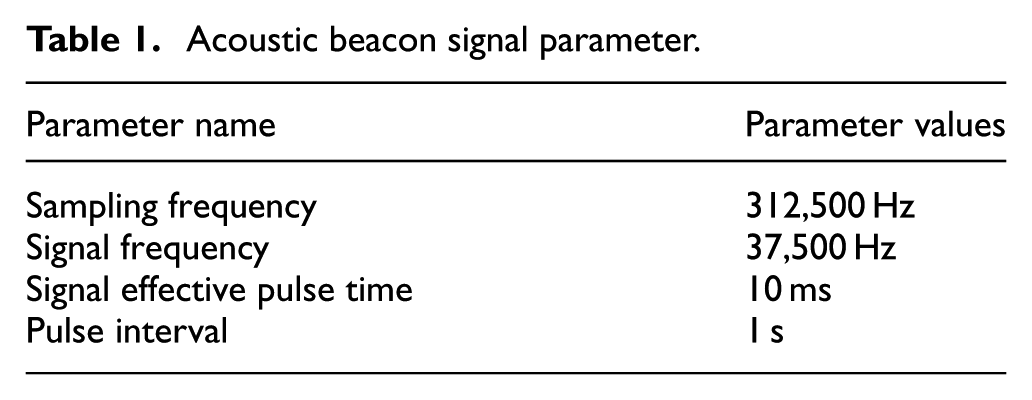
Dislocation superimposed method is proposed based on the random decrement technique. It is a simple method for extracting periodic signals from the complex signal. The algorithm only uses the addition operation; the calculation efficiency is high, and the extracted signal model is accurate. Dislocation superimposed method has been applied to the fault diagnosis, such as extraction of engine abnormal sound signal components, analysis of the waveform change law of different signal fault components, and feature extraction to provide theoretical guidance for real-time engine fault diagnosis.15,16 This article deals with the acoustic beacon signal based on the algorithm to extract the effective signal. The signal form of the airborne acoustic beacon meets the minimum performance standard of the underwater acoustic beacon, and the main parameters of the transmitted signal are shown in Table 1.
Acoustic beacon signal parameter.
The signal is processed using the dislocation superimposed method. Two ways of superposition are presented here: the first one is based on the signal’s own period of superposition, and the second is based on the superposition of the same time interval. The purposes of the two ways are both to enhance the concerned signal and weaken other ingredients to extract the effective signal.
Superposition of adjacent pulses
In Figure 1, A1, B1, and C1 are three sine signals with different period and amplitude; D1 is the synthetic signal of the three signals; and the period of B1 is T. Assuming that B1 is the signal of concern, the method to weaken A1 and C1 can be used to extract D1 from B1. Overall, D1 moves the distance of the period of B1 to the left; D2 is obtained after superimposition with D1. By repeating the above process, the energy of the concerned signal can be enhanced.
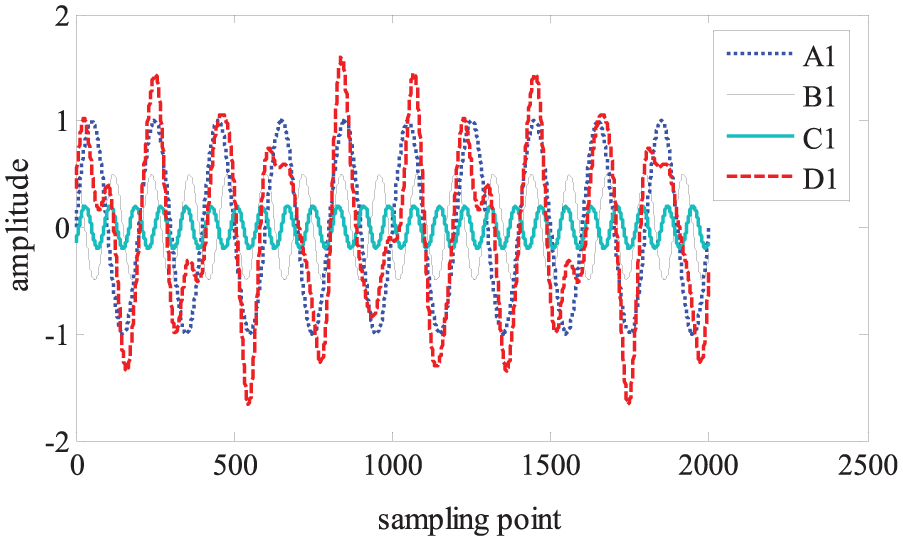
Three sine signals and their synthetic signals.
Figure 2 shows the waveform of synthetic signal D1 in Figure 1 under different superposition times. Among them, D2, D3, D4, and D5 are the signals under the superposition times of 1, 2, 3, and 4, respectively. According to Figures 1 and 2, the waveform of D2 is very close to A1; however, the amplitude is magnified by nearly double. With the increase in the number of superposition times, the waveform similarity between the signal after superposition and concerned signal is also increased.
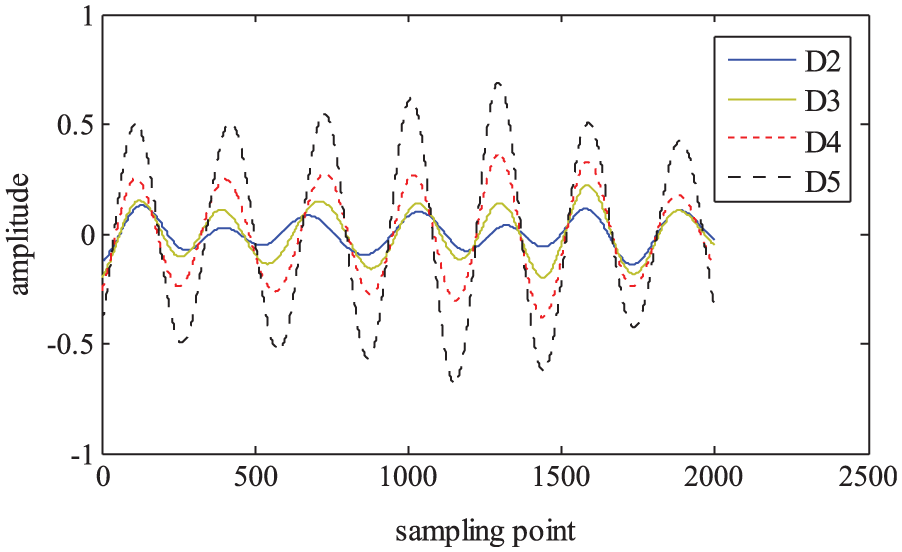
Waveform of signal D1 under different superposition times.
The superposition formula is

where S1[n] is the original signal, M is the number of times, T is the step size, and k is the number of iterations (k = 0, 1, 2, …).
The number of times M cannot be infinitely large. To find the best superposition times, the correlation analysis should be applied to the signal after superposition and the concerned signal. The similarity of the two signals is studied to realize detection, recognition, and extraction of the signal. The correlation function is an important statistic to describe the random signal
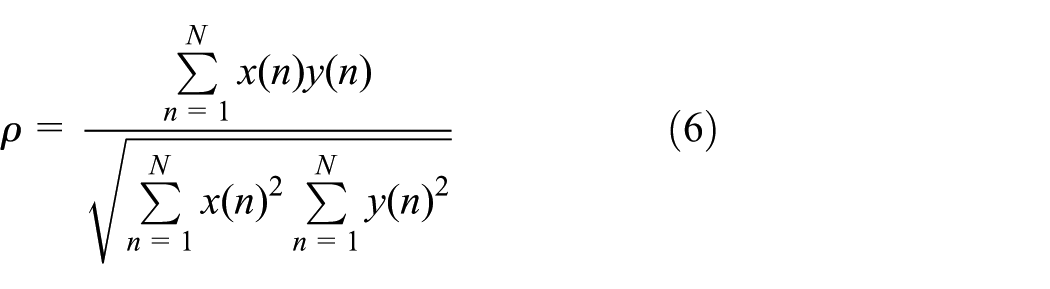
where the length of discrete signals x(n) and y(n) are both N, ρ is defined as the cross-correlation coefficient of x(n) and y(n), and x(n) and y(n) is not at the same time as zero. According to Schwartz inequality, |ρ| ≤ 1. When x(n) is equal to y(n), ρ = 1; ρ obtains the maximum value. When x(n) and y(n) are completely independent, ρ = 0; when x(n) and y(n) have a certain degree of similarity, the value of |ρ| is between 0 and 1. 17
According to formulas (5) and (6), the correlation coefficient between the signal after each time of superposition and the signal that is paid attention to in Figure 2 can be calculated. Figure 3 shows the changes in cross-correlation coefficient under different superposition times.

Cross-correlation coefficient of D1 and B1 under different superposition times.
As shown in Figure 3, with the increase in the number of superposition times, the cross-correlation coefficient is continuously becoming big. It indicates that the correlation between the signal after superposition and the signal that is paid attention to is continuously becoming large; the signal being focused on has been maintained. After five times of superposition, the cross-correlation coefficient remains generally stable.
Superposition of the same time interval
Similar to the first method, a sample point is taken as the starting point of the superposition, at the distance of one pulse from the point, and a fixed length is selected to carry on the superposition test. The calculation model is shown in Figure 4; point B is a pulse distance from point A, and the length of l is back-intercepted at point B and superimposed on point A. After a pulse length, the length of l is back-intercepted and superimposed on point A again; this process is repeated.

The computational model based on superposition of the same time interval.
The formula for calculation is
With the increase in the number of superposition times, the energy of the sine pulse signal is enhanced; the corresponding noise signal is also enhanced. Therefore, it is necessary to analyze the signal energy.
For continuous signal, the autocorrelation function of the energy finite signal f(t) 18 is

According to the relevant theorem

The energy signal is

Formula (11) shows that the energy of a continuous signal is the integral of the square of the amplitude of the signal in the time domain.
For discrete signals, the energy of the signal is defined as

In the formula, k is an integer.
Signal processing experiment
Signal acquisition system
Figure 5 shows the whole diagram of the signal acquisition system. The physical and schematic diagrams of the hardware part of the signal acquisition system are shown in Figure 5(a) and (c). The acoustic beacon is placed in the sea; hydrophones are placed a distance of 1000 m away from the beacon. The sea is under level 3; the signal-to-noise ratio (SNR) is about 40 dB. The signals received by the hydrophones are collected through the A/D converter to realize the analog digital conversion, transmitted to the host computer screen, and finally connected to the host computer.

Diagram of the signal acquisition system: (a) physical diagram, (b) flow block diagram, and (c) schematic diagram.
The work flow of the signal acquisition system 19 is that underwater sensor unit receives acoustic signal in real time, by signal processing of signal conditioning and direction finding such as filtering and amplification in underwater pressure tank unit. The signal is transmitted to the water surface display control unit through a towing cable. The water surface display control unit receives and processes the signal data in real time, displays the signal waveform, and simultaneously outputs the audio signal. The operator judges whether the target signal is found by listening to the audio signal and analyzing the signal.
As shown in Figure 5(b), the signal acquisition system mainly includes the signal conditioning, acquisition, array processing, main control, data storage, power modules, and so on. The signal conditioning module can respectively complete the filtering and amplifying process of 16-element linear array and single hydrophone signals. The acquisition module can finish the synchronous acquisition of 16-element linear array and other sensor signals. The array processing module can complete the forming of the digital beam of 16-element array and signal processing calculation of the hydrophone. The main control module can mainly achieve the functions of the data storage and the general communication with the platform and so on. The data storage module records the original data of the important signal and analysis data. The power module can achieve the power supply voltage conversion of the overall platform, the supply power for the other modules of the electronic cabin, and two 16-element line array hydrophones. High-pressure hydrophone array makes full use of the domestic existing line array design, production, and signal processing foundation. It can reasonably design the array element spacing and enhance the receiving gain of the specific frequency signal of the acoustic beacon. Deep-sea technology, such as deep-sea overflow transducer structure design, is adopted; the array elements are combined to a whole through a rigid component.
The signal receiving end of the system includes the 16-element horizontal line array, an omnidirectional hydrophone, and two directional hydrophones. The omnidirectional hydrophone is used to receive the acoustic beacon signal from the distance and judge the existence of signal. Directional hydrophones are assembled on both sides of the shipboard to judge the basic direction of the signal. The 16-element horizontal linear array is used for accurate direction finding and positioning. The signals received by the three systems are carried on signal conditioning, such as amplification and filtering, and then sampling. The 16-element horizontal linear array data are carried on the digital beam forming. The omnidirectional hydrophone, the two-port directional hydrophone data, and the data after beam forming are brought together. And they can be used for target detection, azimuth estimation, and orientation fusion. Finally, the target position information is uploaded to the deck unit display and control terminal. The acoustic signal acquisition system is the basis of the acoustic signal processing, and its performance directly affects the results of these treatments.
Signal processing
Analog and test signals are processed separately based on the proposed dislocation superimposed method.
Analog signal processing
By simulating the signal parameters of acoustic beacon, analog signal parameters are obtained (Figure 6). The analog signal is the compounded effective pulse and white noise, and the effective pulse is a sine pulse signal. White noise is the uniform distribution of the power spectral density in the whole frequency domain. It covers all the frequency bands; this characteristic can be used as the ocean background noise. White noise is more convenient in mathematical treatment because it is a powerful tool for system analysis.
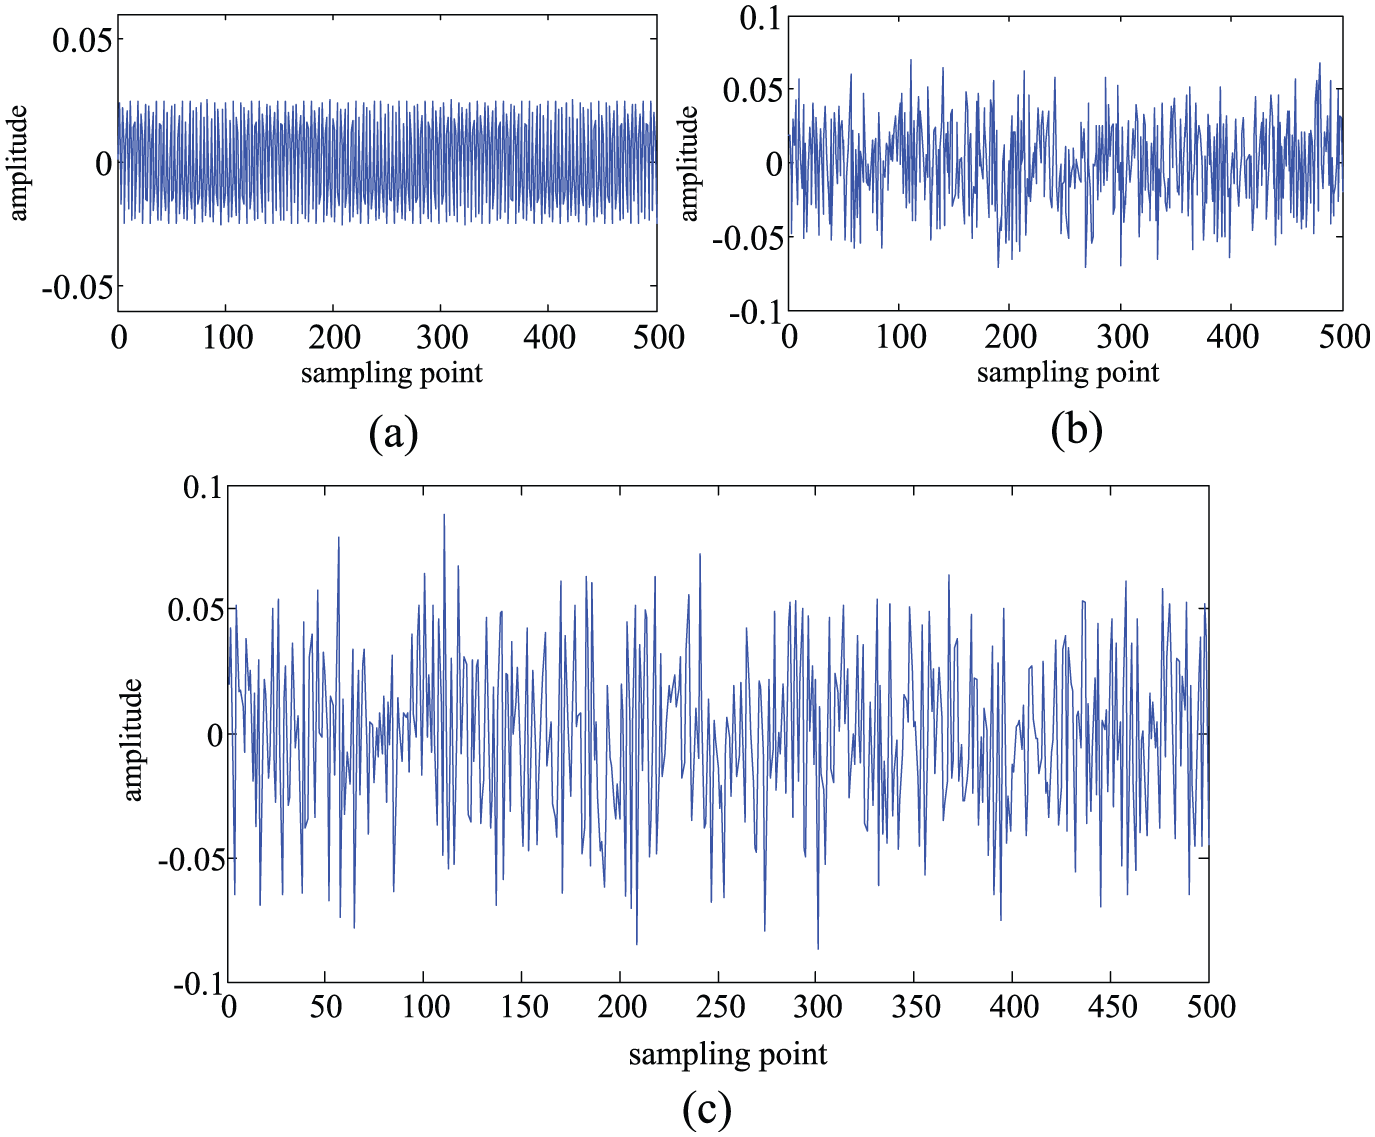
Analog signal before processing: (a) effective part of the signal, (b) white noise, and (c) synthetic part.
The sampling frequency of the analog signal is 96,000 Hz, the signal frequency is 37,500 Hz, signal effective pulse duration is 10 ms, and pulse interval is 1 s. Figure 6 took 500 of the sampling points; Figure 6(a) is the effective part of the signal, Figure 6(b) is the white noise, and Figure 6(c) is the synthesis signal of pulse and white noise.
According to the above two kinds of superposition methods, the analog signal is superimposed 20 times. The results can be obtained as shown in Figures 7 and 8; they have already been very close to the sine signal. The effect of the first superposition method is better than the second method.

Analog signal after processing under superposition of adjacent pulses.

Analog signal after processing under superposition of the same time interval.
Test signal processing
Figure 9 is the acquisition of the acoustic beacon signal; part of the signal is intercepted for processing in Figure 10. The following lists the signals in four superposition ways and compares them.

Test signal before processing.

Partial enlarged view of Figure 9.
According to the above two kinds of superposition methods, the test signal is superimposed 20 times. The results are shown in Figure 11(a) and (b), where a tendency exists to be close to the sine signal, and the effect of the first superposition method is better than the second. The test signal is processed by Fourier transform, 20 and the spectrum chart is obtained. It is carried out by band-pass filtering; the band ranges from 30 to 50 kHz. Finally, Fourier inverse transform (inverse fast Fourier transform (IFFT)) is used to restore the signal from the frequency domain which is shown in Figure 11(c). The test signal is decomposed into four layers using a db10 orthogonal wavelet basis.21,22 The third layer detail signal is given in Figure 11(d). A short period of time, where the signal changes, may be missed when processing with the Fourier transform. The processing effect is poor when the wavelet transform is used. The wavelet basis choice determines the effect of processing on a certain extent, leading to an inaccurate processing effect, which is convenient to operate with the dislocation superposition algorithm. It only needs to be repeatedly superimposed to continue enhancing the signal to be extracted to obtain a better processing effect. As shown on the left side of Figure 11, taking sampling points from 200 to 300 in these four groups for local amplification and comparison, the dislocation superimposed method is superior to the traditional filtering method and it has a remarkable extraction effect.

Four different ways of superposition: (a) test signal after processing under superposition of adjacent pulses, (b) test signal after processing under superposition of the same time interval, (c) test signal after processing under Fourier transform, and (d) test signal after processing under wavelet transform.
Experimental analysis
Analog signal processing
The sine pulse and white noise of the analog signal are all determined; therefore, it can be analyzed in two aspects: correlation and energy analyses.
Correlation analysis
The correlation analysis of the sine signal and the synthetic signal after dislocation superposition is shown in Figure 12, showing the change in cross-correlation coefficient with superposition times.

The cross-correlation coefficient between the synthetic part and the sine part of analog signal under different superposition times.
With the increase in superposition times, the cross-correlation coefficient of the synthetic signal and sine pulse signal shows an upward trend.
Signal energy analysis
The above energy calculation method is used to calculate the energy ratio of the sine pulse signal to total when the analog signal is processed in different superposition times. It is shown in Figure 13.

The energy proportion of the sine part in the analog signal under different superposition times.
Figure 13 shows the change in signal energy proportion with the superposition times when the initial energy proportion is not the same, and all show an upward trend. In the first 50 times of superposition, with the increase in the initial energy proportion, the initial increase velocity of energy proportion becomes large.
Test signal processing
The sine pulse and the noise part of the test signal are unknown, and the energy of each part cannot be obtained. Therefore, only the correlation analysis is carried out.
The correlation analysis of the processed acoustic beacon signals is shown in Figure 14. It gives the situation change with the cross-correlation signal coefficient after superposition and sine signal. With the increase in the superposition times, the cross-correlation between the signal and the sine signal is becoming large.

The cross-correlation coefficient between the synthetic and sine parts of the test signal under different superposition times.
Conclusion
The dislocation superimposed method is used for fault diagnosis and other fields and for acoustic beacon signal processing. Analog and test signals are processed through dislocation superimposed method to extract signals for underwater acoustic beacon. Correlation and energy analyses reveal that the cross-correlation between the synthetic and the sine signals is more than 80% after a number of superposition are completed. The energy ratio of the sine signal to the total reaches more than 80%, and the extraction effect is significant. The comparison of Fourier, wavelet, and Hilbert–Huang transforms and other traditional signal processing methods for acoustic beacon signals indicate that traditional signal processing methods cannot be used to extract beacon signals. For example, a wavelet packet is selected on the basis of a large number of experimental or statistical analysis methods when wavelet transform is used to deal with an acoustic beacon signal, but processing is complex and uncertain. Conversely, dislocation superimposed method is simple and accurate. Signal extraction is also accurate. Therefore, the proposed algorithm can be used effectively in underwater acoustic signal processing.
Footnotes
Academic Editor: Teen-Hang Meen
Declaration of conflicting interests
The author(s) declared no potential conflicts of interest with respect to the research, authorship, and/or publication of this article.
Funding
The author(s) disclosed receipt of the following financial support for the research, authorship, and/or publication of this article: This work was financially supported by the Fundamental Research Funds for the Central Universities (Nos 3132016067 and 3132016355), Liaoning Natural Science Foundation (No. 2014025007), National Key Technology Support Program (Nos 2014BAB12B05 and 2014BAB12B06), National Natural Science Fund (No.51275063), and Dalian science and technology planning project (2014A11GX023).