
Abstract
A new centrifugal compressor impeller design approach is presented, focusing on electrically driven compressors for gasoline engine and fuel cell applications. The performance and mechanical integrity are evaluated based on numerical simulations. Additionally, the numerical model is applied to several variations of the diffuser and volute geometries, in order to evaluate stage characteristics for diffuser area ratios of 110% and 150%, volute area ratios from 60% to 90%, and diffuser pinch ratios from 60% to 80%. The preliminary performance results show the capability to achieve a flow range comparable to a larger state-of-the-art impeller, with minor penalties regarding stage efficiency and near surge operating stability.
Keywords
Introduction
The powertrain electrification of passenger vehicles1,2 leads to new aspects for turbomachinery development. Future high-voltage on-board power supplies3,4 and fuel cell applications will increase the usage of electrically driven compressors. 5 Minimizing response times will still be one of the main challenges for these machines. The inertia of turbocharger shaft–wheel assemblies is mainly determined by the turbine wheel inertia, due to its higher material density compared to the density of the aluminum alloy of which the compressor wheel is made. The common approach to decrease overall inertia is the reduction of the turbine wheel mass, for example, by use of scalloped turbine wheels. An electrically driven compressor used for fuel cells either has no turbine side or, due to the low exhaust temperatures, an aluminum turbine impeller. As a consequence, the weight reduction of the compressor impeller will become more important in the future.
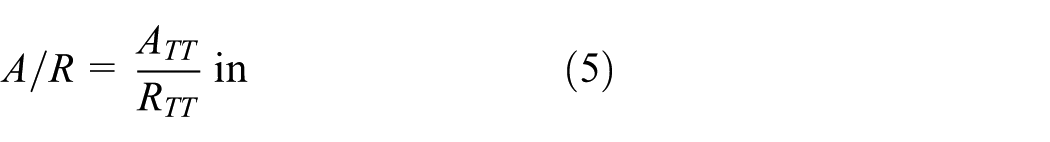
In this article, the final aerodynamic and mechanical design of a high-flow centrifugal compressor is presented. The focus of the impeller design is the minimization of the moment of inertia due to a reduction in the tip diameter (D2 = 47 mm). For this purpose, a high inducer shroud-to-impeller tip diameter ratio (equation (1)) of 0.8 and an inducer hub-to-shroud diameter ratio (equation (2)) of 0.35 are chosen to achieve the same maximum flow rate as a compressor impeller with a larger outer diameter. The impeller exit-to-inlet area ratio (equation (3)) is 0.68, and the diffuser exit-to-inlet area ratios (equation (4)) are 1.1 and 1.5. To minimize the compressor housing size, the diffuser and volute are designed with A/R values (equation (5)) between 0.4 and 0.67 for diffuser pinch ratios (equation (6)) from 0.6 to 0.8. The corresponding geometrical parameter locations are illustrated in Figure 1


Geometrical parameter locations.
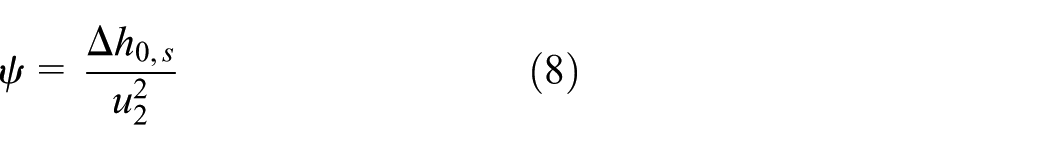
The compressor stage is designed for a design mass flow rate of 0.12 kg/s at a design tip speed of 357 m/s. The maximum tip speed is restricted at 554 m/s. The stage flow coefficient (equation (7)) at the design point is 0.14 and the design pressure ratio is 1.8, in order to comply with the requirements for gasoline and fuel cell applications.6–10 The resulting stage work coefficient (equation (8)) is 0.4 at design point

The preliminary performance results are determined based on steady-state Reynolds-averaged Navier–Stokes (RANS) simulations. The aerodynamic results are presented in terms of stage performance maps. For the prediction of the stable compressor operating limit, with steady-state numerical simulations, a stability criterion is introduced to estimate stall inception based on inducer blockage through the backflow at compressor shroud side. The mechanical integrity is evaluated based on structural mechanics simulations. These results are presented in terms of impeller natural frequencies and stress distributions for a maximum tip speed of 566 m/s.
The fundamental investigation of diffuser and volute performance is particularly not the focus of this article. These investigations have already been performed by various researchers in the past 60 years. Extensive summaries of the fundamentals of diffuser and volute performance can be found in several specialist books,11–16 to name but a few. Most of the original investigations were conducted for large and medium size, high pressure, radial and axial turbomachines. Consequently, the purpose of this article is to provide an expansion of the existing database aiming on the design of low-inertia, high-flow, and high-speed centrifugal compressors for medium pressure ratio applications such as gasoline engines and fuel cells.
Materials and methods
Numerical setup
The numerical simulations for the present investigation are performed with the commercial software ANSYS. The software tool ANSYS CFX is used to predict the performance by means of steady-state RANS simulations. The steady-state structural mechanics simulations are performed with the software tool ANSYS mechanical.
The numerical model is depicted in Figure 2. It consists of an inlet pipe, a compressor impeller with five full and five splitter blades, a vaneless diffuser, a volute, and an outlet pipe. Both inlet pipe and outlet pipe are extended by 500 mm to improve numerical convergence, especially for operating points near the surge line. Local performance parameters are evaluated at domain-related boundaries. The locations are marked green in Figure 2. Global performance parameters (stage efficiency and pressure ratio) are evaluated from the boundary at the end of the extended inlet pipe to the volute outlet.

Numerical model.
The boundary conditions are the total pressure and total temperature at inlet (marked blue) and the mass flow rate at outlet (marked red). For the impeller domain, a rotational speed is set. The transition between domains with different frames of reference is modeled with the frozen rotor approach. For turbulence modeling, the two-equation k–ω shear stress transport (SST) model developed by Menter 17 is used. This turbulence model has been validated against experimental data by various authors. Menter 18 found that the SST model provides the best agreement against experimental data, compared to other state-of-the-art turbulence models available in ANSYS CFX, in terms of the near wall velocity profile prediction. Bardina et al. 19 compared these turbulence models for test cases of five free shear flows and five boundary layer flows and also found that the SST model is advantageous for the prediction of complex flows because of its ability in predicting separation. For these reasons, the SST turbulence model has been the common approach for RANS simulations of turbomachinery with ANSYS CFX.
The numerical simulations are performed for a full 360° model of the compressor stage. Structured grids are used for all domains, except the volute domain which is discretized with an unstructured grid. A detailed grid convergence study of the inlet pipe, impeller, and diffuser domains was performed by Fischer et al. 20 they evaluated numerical results for three grid resolutions. For this purpose, a coarse grid with 8.5 million nodes, a medium grid with 12.6 million nodes, and a fine grid with 28.6 million nodes was used. The results for the target values stage efficiency and stage pressure ratio are shown in Figure 3.

CFD grid convergence study. 20
Based on these results, the medium grid size is chosen for the inlet pipe, impeller, and diffuser domains. In addition, the numerical model is equipped with extended inlet and outlet pipes, as well as different volute geometries. The resulting numerical grids consist of 15–21 million nodes. The number of grid nodes and dimensionless wall distances of the chosen numerical grids are summarized in Table 1.
Numerical grid data.

The main focus of the numerical investigation is the change in operating behavior due to different volute and diffuser geometries. The SST turbulence model is capable of blending between the usage of the low-Reynolds formulation and a wall function for the near wall velocity profile prediction, depending on the dimensionless wall distance. For the present numerical investigation, this is used to reduce the necessary computational resources. For this reason, the impeller mesh is generated with a maximum dimensionless wall distance of 30 to enable the automatic grid generation using the software TurboGrid without excessive increase in the resulting mesh size. The maximum y+-values are located at the cutoff part of the trailing edge, where the automatic meshing tool does not increase the near wall grid resolution. The average y+-value is 4 which shows that the low-Reynolds formulation is still used for most of the impeller domain. The regions of interest, diffuser and volute, on the other hand, are meshed with an average dimensionless wall distance of 1, in order to use the low-Reynolds formulation. The resulting maximum wall distance of the diffuser domain is approximately 3. The volute geometry is more complex; for this reason, the maximum wall distance is locally higher and reaches values of up to 11 at the volute’s tongue region.
The mechanical model is illustrated in Figure 4. The degrees of freedom are constrained with a zero-axial displacement at the end surface of the impeller nose and an axial preload force of 10 kN at the contact region between the back disk and the shaft in order to account for the tightening torque of the shaft nut. Fabrication constraints such as operating temperatures, varying material qualities, and manufacturing processes are neglected. The material properties are given in Table 2.

Mechanical impeller model.
Material properties of aluminum alloy.

All structural mechanics simulations are performed for a full 360° model of the compressor impeller. To determine an adequate mesh resolution for the structural mechanics simulations, a grid-dependence study is carried out by Fischer et al. 21 The maximum stress is chosen as target value for the grid independency study. A total of four impeller meshes with total mesh sizes from 150,000 to 2,500,000 nodes are evaluated. The resulting maximum stress deviations are depicted in Figure 5. A mesh resolution of 500,000 nodes is chosen for structural mechanics simulations with respect to the computation times. This grid size shows the best tradeoff between accuracy and computational efficiency.

FEM grid convergence study. 21
Variations of geometry
The stage characteristic performance and its dependence on the diffuser volute geometry downstream of the impeller are investigated based on different diffuser volute combinations. To allow for a good comparison, diffuser area ratios (equation (4)) of 1.1 and 1.5 are used for all geometries. For the first step, a diffuser width ratio (equation (6)) of 0.8 is used, and the volute throat area is varied from 60% to 90% of the diffuser outlet area which is the volute inlet area. For the second step, the diffuser width ratio is varied from 0.8 to 0.6 for a volute throat area of 70% of the diffuser outlet area. As a result, numerical simulations are performed for 12 different volute and diffuser geometries. The numerical results show the influence of the geometrical variation of the diffuser width between 2.7 and 3.6 mm, the diffuser outlet radius between 32 and 59 mm, and the volute A/R value between 0.4 and 0.67 on the centrifugal compressor stage performance. All investigated geometry variations are summarized in Table 3 including the nomenclature used for the result evaluation.
Diffuser and volute geometries.

The diffuser is a common radial diffuser with parallel walls and a pinch at 120% of the diffuser inlet radius. The volute’s cross-sectional area is of circular shape with a linear area increase. The sizes of the volute’s cross-sectional areas at different circumferential positions are calculated based on Aungier 16 (equation (9))

The cross-sectional area A is determined by the angular position ϕ, the sizing parameter SP, the radius of the centroid of the cross-sectional area Rc, the diffuser outlet width b3, and the flow angle at diffuser outlet α3. A cross-sectional view of the diffuser and volute is illustrated in Figure 6.

Cross-sectional view of the diffuser and volute geometry.
Results and discussion
Mechanical results
For the first step of the mechanical analysis, impeller natural frequencies for various rotational speeds between 0 and 230,000 r/min are evaluated. The results are depicted in Figure 7 by means of the Campbell diagram of the impeller. As the compressor is not equipped with either inlet guide vanes or diffuser vanes, only the first five multiples of the rotational speed (BPF 1–5) are considered as excitation frequencies. As can be clearly seen in Figure 7 (red circle), a potential resonance condition occurs between the fifth multiple of the rotational speed and the first natural frequency of the main blades at a rotational speed of 225,000 r/min. For this reason, the maximum tip speed of the compressor will be restricted to 554 m/s for the preliminary performance prediction, to prevent any possible failures during future experimental measurements.

Campbell diagram of the impeller.
However, the determination of impeller stresses will be performed at a tip speed of 566 m/s to ensure the mechanical integrity at the anticipated maximum tip speed. The requested von Mises stress limits for different geometrical regions of the impeller are summarized in Table 4. A plastic deformation is tolerated only inside the impeller bore, and for this reason, an exceedance of the material yield strength is acceptable, because the torque transmission takes place between the impeller back face and the shaft shoulder.
Stress limits for different locations of the impeller.

The stress distributions computed by means of steady-state structural mechanics simulations prove that the permissible stress limits are not exceeded. Figure 8 shows the von Mises stress at the impeller. It can be clearly seen that the permissible stress limit of 75% yield strength is not exceeded, either at the main blades or at the splitter blades. The stress magnitude at the blade root fillet radii and the hub surface does not exceed 90% of the yield strength as can be seen in Figures 8 and 9.

Stress distribution at the impeller.

Stress distribution at the main (left) and the splitter blade (right) pressure sides.
The stress distribution inside the impeller at the bore region is illustrated in Figure 10 by means of a cross-sectional view of the impeller geometry. The stress magnitude exceeds the yield strength; hence, plastic deformation can be expected in this section. Advantageously, this deformation will reduce these stresses; hence, it is assumed that exceeding the yield strength is not critical in this particular area. In addition, it can be seen that there is a sufficient distance between maximum bore stress and impeller back face.

Stress distribution at impeller cross section.
Performance results
The preliminary performance prediction of the compressor stage is performed by means of high-resolution numerical simulations. The limit for stable compressor operation is defined as an operating point where approximately 30% of the inlet area is blocked due to backflow at the shroud region. The development of such a flow pattern is illustrated in Figure 11 for a decreasing mass flow rate at design tip speed.
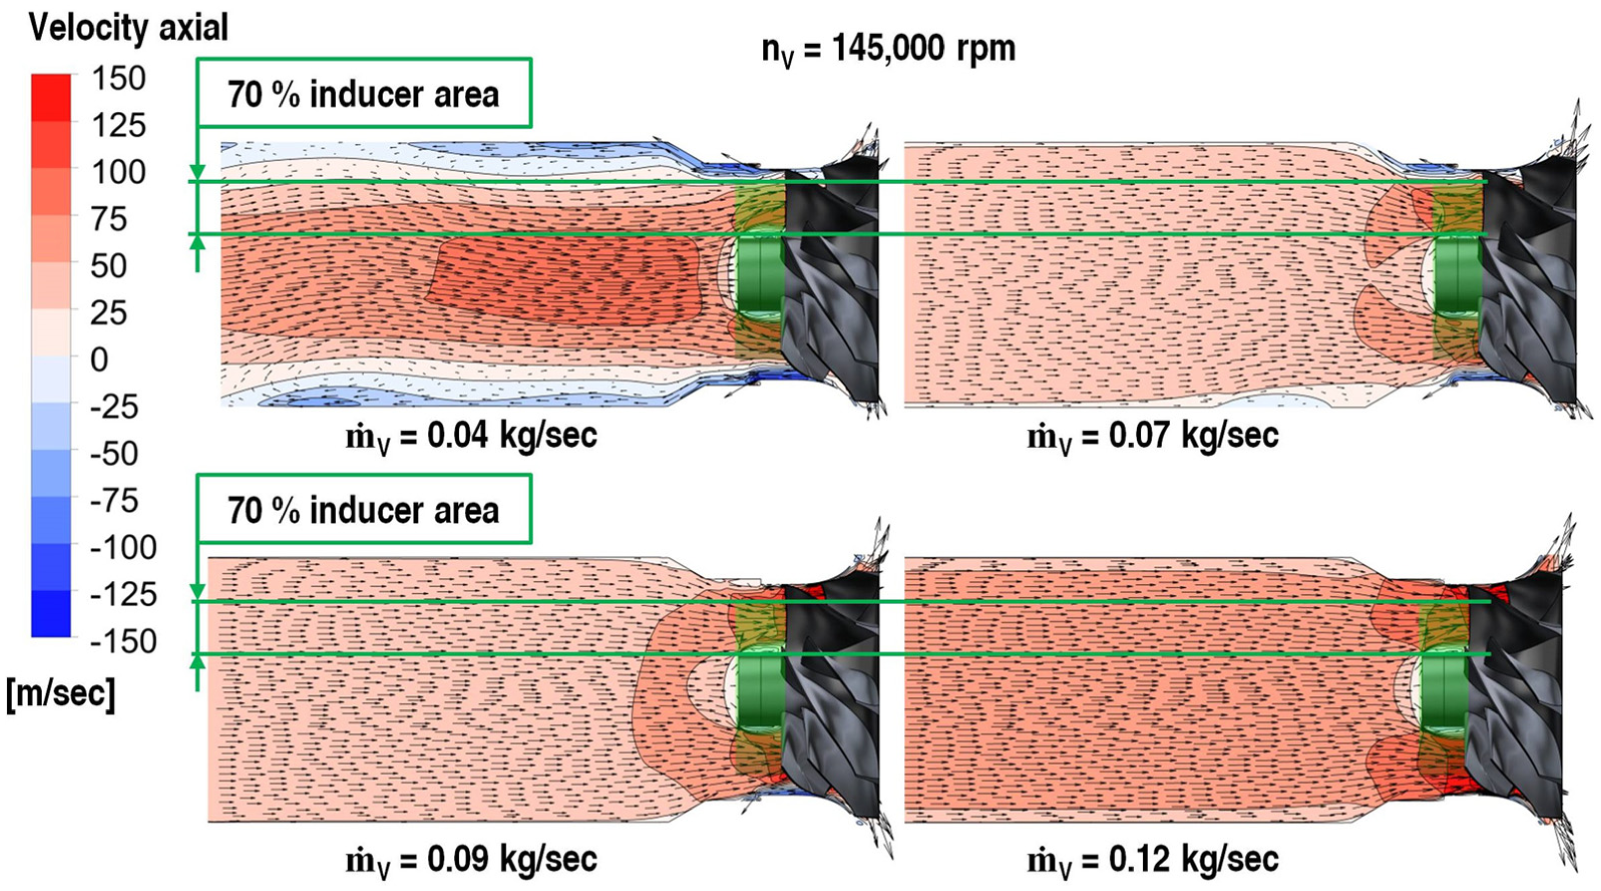
Backflow (blue) at the impeller inlet at different mass flow rates.
The large diameter ratio of the investigated compressor impeller leads to high inducer blade tip speeds. The resulting high relative Mach number causes an increasing impact of the misalignment between inflow direction and blade leading edge. At low mass flow rates, this leads to flow separation at the blade tip. As a result, fluid flows back from the diffuser, along the compressor shroud, to the impeller inlet. This reverse flow partially blocks the inducer area near the shroud. Additionally, the temperature increases in front of the impeller and thus the compressor outlet temperature, due to the mixing of low-temperature inflow and high-temperature reverse flow. As a result, the effective inducer flow area as well as stage efficiency decreases. Further reducing the mass flow rate by increasing the back pressure leads to rotating stall, where single-blade passages are completely blocked by reverse flow, and eventually to compressor surge, where the whole compressor flow periodically changes direction. A good description of these well-known phenomena can be found in Cumpsty. 15
The computed compressor performance maps for the final stage design (P0.8SP0.7DE1.5) are depicted in Figures 12 and 13. This design is chosen because it provides the best tradeoff between stage efficiency, operating range, and compressor housing size. The peak work coefficient of 0.48 is achieved for a flow coefficient of 0.08. At maximum flow coefficient (0.18), a stage work coefficient of 0.16 is achieved (Figure 12).
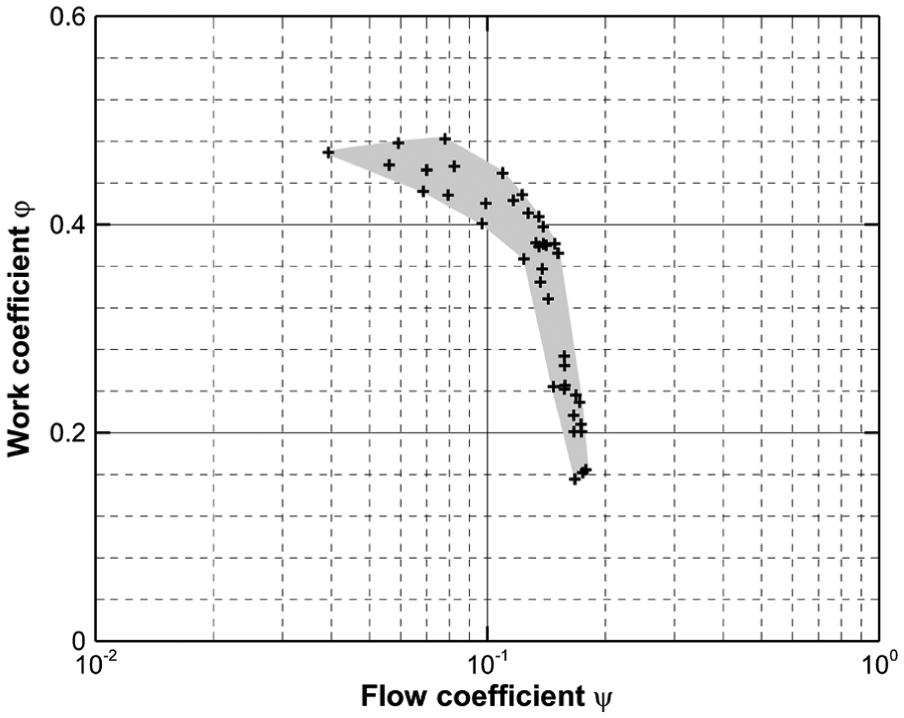
Performance map (work coefficient vs flow coefficient).

Compressor performance map (P0.8SP0.7DE1.5).
Figure 13 shows that the centrifugal compressor stage provides a comparatively wide operating range at stage pressure ratios below 2. With increasing rotational speeds and pressure ratios above 2, the mass flow range becomes progressively narrower. The peak pressure ratio is achieved at a mass flow rate of 0.17 kg/s at maximum tip speed. The area of compressor peak efficiency is located at mass flow rates between 0.11 and 0.13 kg/s at design tip speed. The compressor stage achieves a maximum mass flow rate of 0.18 kg/s at maximum tip speed.
Volute sizing parameter
The volute sizing parameter is defined as the ratio between the volute throat area and the diffuser outlet area. This ratio influences the mass flow rate at which the volute operates at maximum performance. This means that the total pressure loss reaches its minimum, and only a minor flow deceleration takes place inside the volute.
The influence of different volute sizing parameters for a diffuser area ratio of 1.1 is depicted in Figure 14 by means of compressor performance maps. For increasing sizing parameters, the total pressure ratio and stage efficiency increase with mass flow rate. This is a result of a decrease in total pressure losses due to a reduction in flow acceleration caused by the increase in cross-sectional area of the volute. For low mass flow rates, the opposite behavior can be observed. A small volute sizing parameter leads to a reduced flow deceleration and thus increased total pressure ratio and stage efficiency due to reduced total pressure losses.
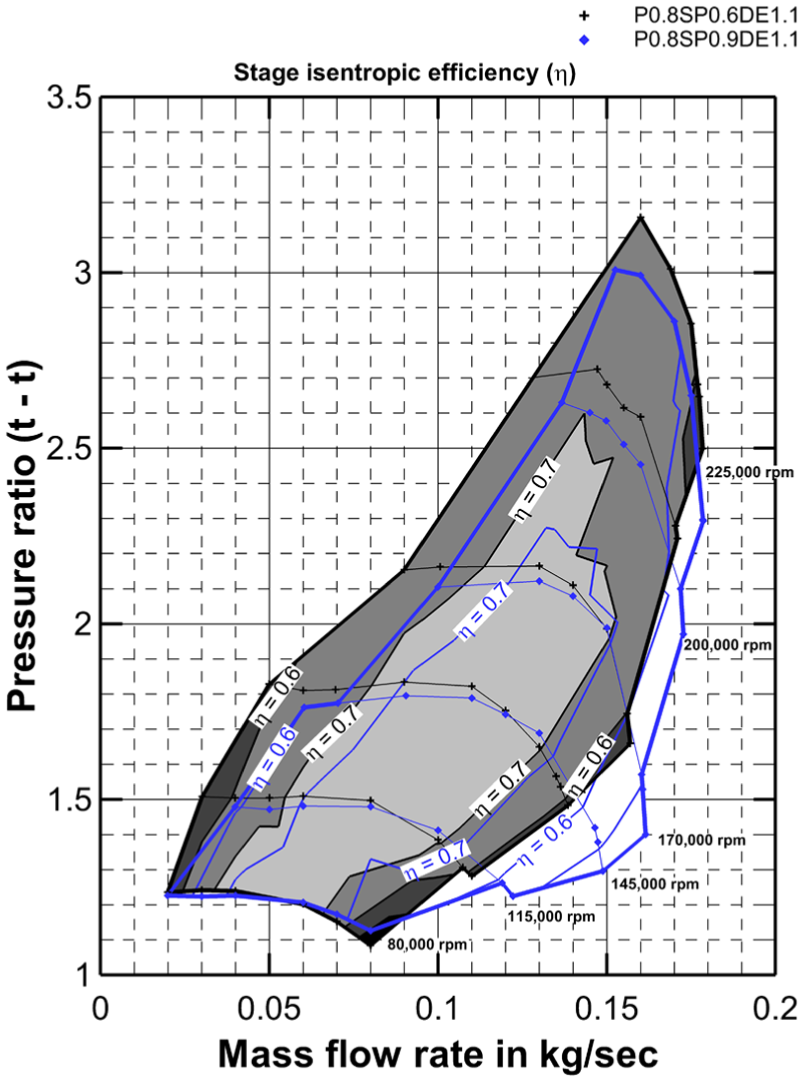
Stage performance maps for volute sizing parameters of 0.6 and 0.9.
This direct link between mass flow rate, volute sizing parameter, and volute performance will be explained using the dimensionless performance parameters CP (equation (10)) and CPL (equation (11)). The static pressure rise coefficient CP describes the amount of kinetic energy which is converted to static pressure inside a control volume. The total pressure loss coefficient CPL describes the amount of kinetic energy loss inside a control volume.


The magnitude of total pressure loss (CPL) and static pressure rise (CP) is illustrated by Figure 15 for the entire compressor performance map. This confirms the assumptions made by means of the performance map (Figure 14). Both performance parameters are seen to strongly depend on the sizing parameter. The small volute provides decreased losses between the line of peak efficiency and the surge line, while the large volute cross-sectional area shifts this area of low losses to high mass flow rates.

Volute static pressure rise coefficient and total pressure loss coefficient for volute sizing parameters of 0.6 and 0.9.
The static pressure rise coefficient in Figure 15 (left) shows that the small volute (black) provides positive CP values at low flow rates because the flow is decelerated inside the volute. Hence, the static pressure increases. In addition, the total pressure loss coefficient is approximately 10% points lower which can be deduced from Figure 15 (right). As a result, the stage total pressure ratio is higher for the small volute (P0.8SP0.6DE1.1). At the mass flow rate where the CP value reaches 0, both volutes achieve the same stage total pressure ratio. For the small volute, the flow accelerates (negative CP values) with further increase in stage mass flow. As a result, the pressure loss increases and is between 10% and 20% higher than the CP value of the large volute.
The CP values of the large volute (P0.8SP0.9DE1.1) are positive for the whole compressor operating range and reach 0 at compressor choke flow rate. This indicates that no flow acceleration takes place for the entire compressor operating range, and that a further area increase only causes increased losses due to flow separation inside the volute.
The influence of the diffuser upstream to the volute is illustrated in Figure 16 by means of the CP and CPL values of the diffuser. With a large volute downstream, the static pressure rise decreases for low mass flow rates, while at high-flow rates the static pressure rise is almost equal. In addition, there is only a minor influence on the total pressure loss of the diffuser. This clarifies that especially the part-load operation benefits from a small volute, as long as minor penalties regarding maximum flow rate are acceptable.

Diffuser static pressure rise coefficient and total pressure loss coefficient for volute sizing parameters of 0.6 and 0.9.
Diffuser area ratio
The diffuser area ratio (DE) is defined as the ratio between diffuser outlet and inlet area. This ratio defines the maximum ideal flow deceleration inside the diffuser. The larger the area ratio, the larger the ideal increase in static pressure. The comparison of the stage performance maps of the compressor stage with a DE value of 1.1 versus a DE value of 1.5 is depicted in Figure 17.

Stage performance maps for diffuser area ratios of 1.1 and 1.5.
From the performance map, it can be deduced that the increased static pressure rise of the large diffuser (DE = 1.5) leads to an increased stage pressure ratio for the whole compressor operating range. In addition, the stage efficiency increases at the line of peak efficiency and at lower mass flow rates. Compared to the small diffuser, the surge mass flow rate is larger, and the stage efficiency is reduced in the vicinity to the choke line.
Figure 18 shows the static pressure rise and the total pressure loss for two diffusers. It confirms that the static pressure rise for a diffuser area ratio of 1.5 is almost twice that of the diffuser area ratio of 1.1. The total pressure loss at the diffuser also increases with increasing area ratio but only by approximately 75%. The results show that a large diffuser area ratio is advantageous in terms of diffuser efficiency and disadvantageous in terms of diffuser operating stability.

Diffuser static pressure rise coefficient and total pressure loss coefficient for diffuser area ratios of 1.1 and 1.5.
As a result of the increased diffuser outlet pressure, the volute performance changes. The static pressure rise and the total pressure loss are reduced for almost all operating points, which lead to a minor increase of flow acceleration in the vicinity of the choke line (Figure 19). This is assumed to be the main cause for the decrease in stage efficiency in this area for the large diffuser area ratio.

Volute static pressure rise coefficient and total pressure loss coefficient for diffuser area ratios of 1.1 and 1.5.
The total pressure loss coefficient of the volute shows a minor increase with diffuser area ratio of 1.5 (Figure 19). However, as a result of the higher flow deceleration inside the large diffuser (DE = 1.5) compared to the small diffuser (DE = 1.1), the kinetic energy at the volute inlet is significantly reduced. The fact that the dimensionless pressure loss coefficient is normalized with this amount of kinetic energy leads to the conclusion that the absolute value of total pressure loss is actually reduced for the large diffuser.
The results show that a large diffuser improves stage efficiency and stage pressure ratio because the flow deceleration of a radial diffuser is more efficient than that of a volute. In addition, a reduced flow velocity at the inlet reduces the wall friction losses occurring inside the volute. Conversely, the large diffuser also causes a decreased operating stability.
Diffuser width ratio
The diffuser width ratio, respectively pinch ratio, defines the ratio of diffuser area increase downstream of the impeller. For this reason, a small diffuser pinch ratio reduces the gradient of static pressure rise. As a result, the diffuser becomes longer for a given area ratio. Such a diffuser is generally more robust in terms of flow separation but has the disadvantage of increased wall friction losses caused by the increased surface area.
The stage performance maps for a volute sizing parameter of 0.7 and a diffuser area ratio of 1.5 are depicted in Figure 20 for diffuser pinch ratios of 0.6 and 0.8. The reduction of the diffuser pinch ratio leads to an increased stage pressure ratio, an improved stage efficiency, and improved operating stability at low mass flow rates. The stage efficiency decreases at high mass flow rates, where the wall friction losses increase. This is especially critical at high rotational speeds where the longer diffuser (pinch ratio of 0.6) becomes instable.
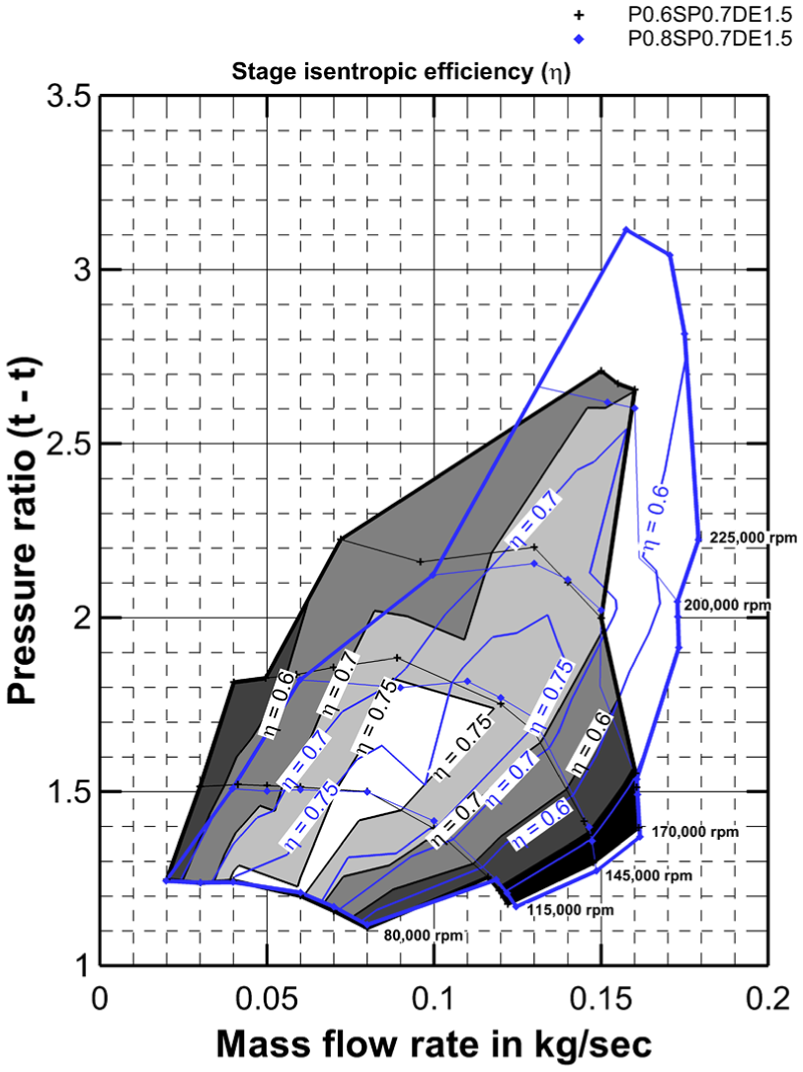
Stage performance maps for diffuser pinch ratios of 0.6 and 0.8.
The comparison of the static pressure rise and the total pressure loss of the different diffuser geometries (Figure 21) shows that the reduced diffuser pinch ratio causes a reduced static pressure rise of approximately 10% points for the whole compressor operating range. The total pressure losses increase by approximately 5% points at high mass flow rates.

Diffuser static pressure rise coefficient and total pressure loss coefficient for diffuser pinch ratios of 0.6 and 0.8.
The static pressure rise of the volute is significantly reduced by up to 40% points, and the total pressure loss is increased by up to 30% points for the short diffuser, as can be deduced from Figure 22. Especially, the negative CP values for almost all operating points lead to the conclusion that the volute cross-sectional area is too small for the short diffuser. However, the reduction in diffuser pinch ratio leads to an improved performance at part-load operation as well as improved stability near the surge line. The disadvantages of small pinch ratios are increased losses at high mass flow rates, which can also lead to reduced stage peak efficiency.
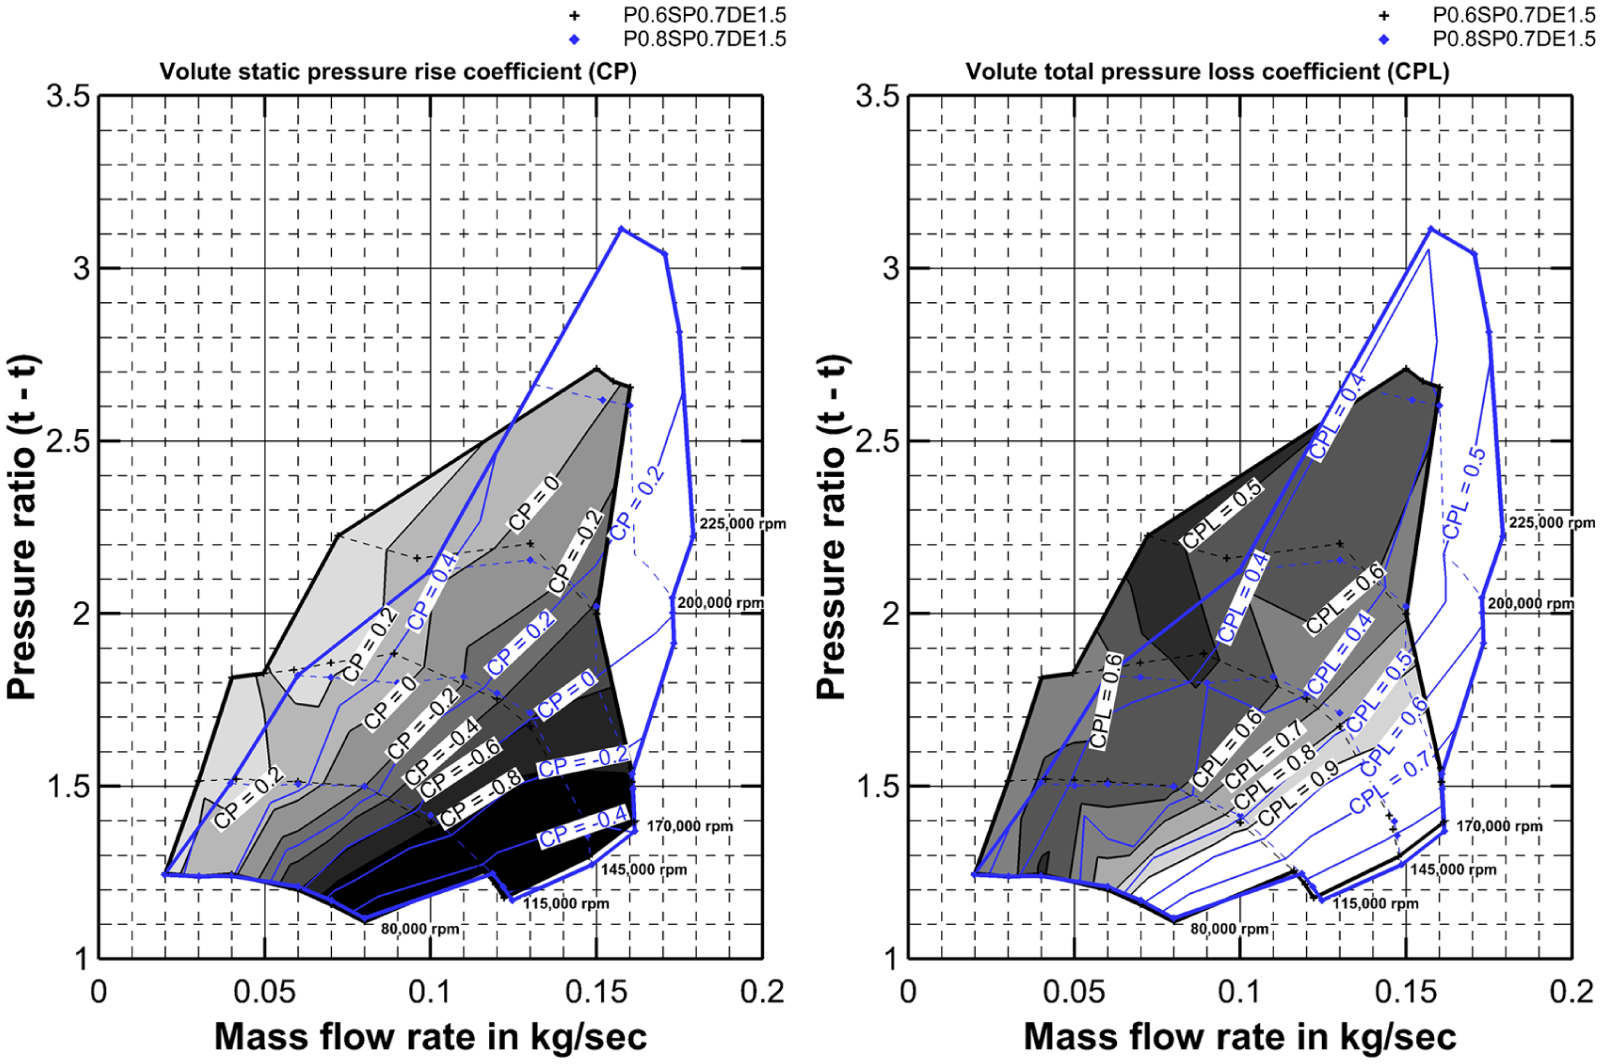
Volute static pressure rise coefficient and total pressure loss coefficient for diffuser pinch ratios of 0.6 and 0.8.
The results also show that for a diffuser with a small pinch ratio, the volute throat area should be increased to prevent flow acceleration inside the volute. The increased volute area will cause an increase in static pressure rise inside the volute. This can lead to penalties regarding operating stability at low flow rates which would reduce the benefit of the small diffuser pinch ratio.
Conclusion
A new high-flow centrifugal compressor impeller design with a tip diameter of 47 mm and a trim of 0.8 was presented. The compressor performance and mechanical integrity were investigated based on numerical simulations.
The numerical results of the impeller concept showed the capability of inertia and housing size reduction with a performance equivalent to a conventional impeller design, regarding mass flow range and peak efficiency. Based on numerical results, a peak pressure ratio of 3, a maximum mass flow rate of 0.18 kg/s, and a peak efficiency of 76% can be achieved with the current design.
Minor penalties of near surge operating stability at pressure ratios above 2 have been accepted. This limitation is caused by high inducer blade Mach numbers due to the large inlet diameter. As a result, smaller incidence angles cause a larger flow separation.
The geometry variation of the diffuser and volute leads to the following conclusions:
The volute sizing parameter should be chosen with regard to the desired operating range. Values between 0.6 and 0.7 for major part-load operation and values between 0.8 and 0.9 for major operation at maximum mass flow rate are recommended.
A large diffuser area ratio is good for stage efficiency and bad for compressor operating stability. With regard to the desired operating range, a diffuser area ratio of approximately 1.5 is recommended. This value should be increased for low-range and high-efficiency applications or decreased for high-range and medium-efficiency applications.
A small diffuser pinch ratio improves performance at part-load operation but decreases performance at high mass flow rates. For a small diffuser pinch ratio, an increase in the volute sizing parameter should be considered.
The next step in this ongoing investigation is the application of performance-extending devices such as variable inlet guide vanes and variable diffuser geometries. For these geometries, unsteady numerical simulations will be performed to improve the numerical accuracy near the surge line and gain a more detailed insight into the stall inception. Furthermore, a demonstrator stage will be manufactured to experimentally validate the numerical results.
Footnotes
Acknowledgements
The authors would like to acknowledge the contribution of Regionales Rechenzentrum für Niedersachsen (RRZN).
Academic Editor: Shoou-Jinn Chang
Declaration of conflicting interests
The author(s) declared no potential conflicts of interest with respect to the research, authorship, and/or publication of this article.
Funding
The author(s) received no financial support for the research, authorship, and/or publication of this article.