
Abstract
Pipe cooling is one of the most important measures of mass concrete temperature control, but pipe cooling has its advantages and disadvantages. Inappropriate pipe-cooling water temperature may result in excessive stress and crack. Considering the fact that concrete is a type of three-phase composite material and the sizes of cooling pipe and aggregate are basically on the same scale, the mesoscopic heterogeneity of concrete may have a great effect on the stress field surrounding the pipe. This article computes the pipe cooling–induced stress and damage and analyzes the differences between the homogeneous model and heterogeneous model based on mesoscopic mechanics. In this study, both linear elastic analysis and nonlinear damage analysis are performed; elastic modulus and creep are used as a function of concrete age; and several factors such as temperature difference, multistep cooling mode, and earlier cooling are also studied. The research results show that due to the mesoscopic heterogeneity characteristics of concrete, there is a great deal of difference between homogeneous model and heterogeneous model; pipe cooling can lead to large residual stress around the aggregate and produce a large range of damage, and previous homogeneous model indeed underestimates the effect of cooling-induced stress; using multistep cooling and early cooling mode can reduce this damage; the cooling-induced damage has significant influence on the anti-crack performance of concrete. In the final, based on the research results, the temperature difference between the concrete and pipe water of the second-phase cooling was recommended to be controlled at approximately 5°C.
Introduction
Artificial cooling of concrete by embedded pipe was first tested on the Owyhee Arch Dam Project in the United States. 1 In 1931, the United States Bureau of Reclamation conducted a field experiment of pipe cooling in the Owyhee Arch Dam. This experiment adopted river water for cooling and verified that pipe cooling can effectively control the inner–outer temperature difference of concrete. The experimental results obtained were satisfactory. Pipe cooling was then applied to another project, the Hoover Dam, 2 and was studied more systematically. The pipe-cooling method was verified to be an effective temperature control method. From then on, the Grand Coulee, 3 Shasta, 4 and Dworshak 5 projects of the United States all used this method. The utilization of this method has gradually spread worldwide. China first used artificial cooling technology-embedded cooling water pipes in an arch dam, that is, the XiangHongDian project, 6 in 1955. A wide range of applications have then begun in the ErTan, 5 Three Gorges, 7 and XiLuoDu 8 projects. The pipe-cooling method can not only be applied in such a large dam structure but also gradually be used in thin-wall concrete structures, such as sluices, 9 flood discharge tunnel, 10 and spillway. 11 Pipe cooling is currently one of the most important and commonly used methods in mass concrete temperature control.
Pipe cooling has its advantages and disadvantages. The advantages include that it can effectively reduce the maximum temperature in the concrete construction and make the dam body temperature drop to the target temperature in a relatively short period of time. The disadvantages include that it can easily produce local tensile stress around the pipe, and a sharp cooling can produce a large global tensile stress. Especially, at the second stage of pipe cooling in the concrete, the concrete has large elastic modulus and small creep, and the initial transient of cooling will cause cold hit on the concrete around the pipe. If the temperature difference between the concrete and pipe water (it is abbreviated to CPWTD in this article) is extremely large, the cold stress may make concrete crack. Therefore, the water temperature control is the key to use pipe-cooling measures. The Design Specification for Concrete Arch Dam (DL/T5346-2006) 12 states that the temperature difference between the cooling water and the dam concrete should not be more than 20°C–25°C. Previous studies about temperature difference control between the cooling water and concrete are limited. In 1997, Baoying 13 used the method of combining the finite element method and the fracture mechanics to study the allowable values of CPWTD of constrained and unconstrained concrete; the calculated cooling water temperature of the constraint-zone concrete was 20°C, and the water temperature of the unconstraint-zone concrete was 30°C. These results are close to the design specification limit. In 2009, Bofang et al.14–16 published a series of articles; gave the elastocreep stress calculation formula of pipe cooling; discussed the advantages and disadvantages of pipe cooling in concrete dam; put forward a new cooling mode with smaller temperature difference, earlier cooling, slower cooling than the traditional cooling mode that has large temperature difference, late cooling, and sharp cooling; and proposed that the CPWTD should be reduced from the previous range of 20°C–25°C to the range of 4°C–6°C.
Related researches to the aforementioned studies have also considered concrete as a homogeneous material. However, on the mesoscopic level, concrete is regarded as a multiphase composite material that consists of aggregate, mortar, and interface (interfacial transition zone (ITZ)). 17 Only if the concrete model size is three times greater than the maximum aggregate particle size, then concrete can be regarded as a homogeneous material. 18 The size of a cooling water pipe between 20 and 35 mm is almost equal to the medium aggregate size (the size of small aggregate is 5–20 mm, and the size of medium aggregate is 20–40 mm). Therefore, the analysis of the temperature and stress field of concrete surrounding the cooling water pipe based on the assumption of homogeneous material may be inappropriate. It is necessary to study this problem with the help of the concrete mesoscopic mechanics.
The main purpose of concrete mesoscopic mechanics is to consider the concrete as a composite material, analyze and study the concrete internal mechanism of failure process, and strive to build the relation between the microstructure characteristic and its macroscopic mechanical properties of concrete. After about 30 years of development, researchers have developed a variety of numerical simulation models, such as lattice model,19,20 random particle model, 21 random aggregate model,22,23 random parameter model, 24 rigid body spring network model, 25 and particle element model. 26 Today, mesoscopic mechanics has been recognized as a powerful and important tool in the field of concrete research.
Recently, Zhang et al. 27 presented an equivalent probabilistic model to analyze the damage and failure behavior of concrete cracks induced by a water-cooling pipe and proposed that the heterogeneity of concrete has significant influence on the pattern and failure progress of pipe cooling–induced crack in concrete. Li et al. 28 used particle flow method to simulate thermal crack propagation, studied influence of such cracks on thermal fields, and proposed that if the large temperature difference is too high, concrete cracks might occur.
Although these two scholars have done pioneering researches, there are still some issues that should be studied further, for example, the distribution of self-restraint stress and damage induced by pipe cooling, the difference between the homogeneous model and heterogeneous model, and especially the influence of the CPWTD and the multistep cooling. The emphasis of this research is on the study on the spatial and temporal distribution of self-restraint stress and damage of concrete induced by pipe cooling and a more reasonable solution to control pipe cooling. In this article, considering concrete as a multiphase composite material and visco-elastic material, the authors use mesoscopic mechanics and the coupled creep–damage model to investigate the CPWTD problem of the second-phase cooling, calculate the temperature field and the stress field at mesoscale, analyze a variety of CPWTDs effect and the cooling damage evolution process, and evaluate the cooling-induced stress and damage effects on concrete anti-crack performance by numerical simulation.
Computational model
Creep model
Because both the modulus of elasticity and unit creep of concrete vary with time, the incremental method is used, and the time τ is divided into a series of time increments Δτ1, Δτ2,…, Δτn. The strain increment of concrete under complex stress includes the elastic strain increment, creep strain increment, temperature strain increment, and autogenous shrinkage strain increment; thus, the total strain increment can be decomposed as follows

where
The elastic strain increment can be calculated by

where

where E∞ is the final elastic modulus of concrete (GPa), τ is the age of concrete, and α and β are the variation coefficients of the elastic modulus of concrete.
For plane stress problem, the [Q] matrix in equation (2) is given by

The creep strain increment


where C(tn, τ0) is expressed by the following model 29


where t is the time (day); τ is the loading age (day); and fs, gs, ps, rs, and γ are the creep parameters.
Equations (5) and (6) can be derived to the following equations in recursive format 30


For plane stress problem, the thermal strain increment is given by

where a is the coefficient of thermal expansion and ΔTn is the temperature increment.
Substituting equations (2) and (9) into equation (1), the relation between the stress increment vector and the strain increment vector is derived

where


Adopting equation (13), the element stiffness matrix [k]e, the nodal load increment


Collection of all the nodal load and stiffness matrix yields the global equilibrium equation as follows
where
Solution of equilibrium equation (20) yields the nodal displacement, then the stress increment can be computed by equation (13), and then the total stress at time tn can be obtained by summing all Δσi

Coupled creep–damage model
From Lemaitre’s hypothesis of strain equivalence, 31 the relation between the effective stress increment and Cauchy stress increment can be expressed as

where
Substituting


Equation (26) is the final constitutive equation of the couple creep–damage model. By comparing equations (13) and (26), it can be found that damage not only reduces the modulus of elasticity but also increases unit creep.
Damage evolution model
The damage evolution model used in this study is a scalar damage model, without considering the compression damage. The softening section of the stress–strain curve is supposed to be an exponential curve, and the concrete damage evolution equation is expressed as 32

where ε0 is the strain of peak stress (ε0 = ft/E), ft is the tensile strength, E is the elastic modulus, ω is the softening coefficient which is related to the fracture energy of concrete, and
The effective strain is defined as the sum of instantaneous damaged elastic strain and a certain fraction of creep strain 33

where εe is the first principal elastic strain, the εc is the first principal creep strain, and θ is a coefficient.
The falling section of the stress–strain curve should be modified based on the characteristic length lt to reduce the influence of the mesh size on the analysis results. The softening coefficient of constitutive curve should meet

where lt is the characteristic length of the fracture zone (for the plane problem, the square root of the area of element is taken; for the spatial problem, the cube root of the volume of element is taken).
Verification analysis
In this study, all finite element simulation analyses were conducted within SAPTIS software, which was developed by Zhang 34 and it can be utilized to simulate various problems on the temperature, flow, deformation, and stress fields of concrete structures. 35 The proposed models in this research have been integrated into this software. This section will illustrate the accuracy validation of the proposed models in SAPTIS.
Thermal stress test
In this section, in order to verify the accuracy of the creep model, one thermal stress test which was performed by Ji
36
has been simulated. The specimen is 100 mm × 500 mm. The volume ratio of aggregate is 0.62. The calculating model is shown in Figure 1. A uniform strain load (temperature–stress test machine (TSTM) strain) on the right side and normal displacement constraint condition on the left side are applied. According to the experiment data, the concrete modulus is

The calculating model of thermal stress test.

Temperature, shrinkage strain, and TSTM strain.
Creep parameters of each phase (10−6/MPa).

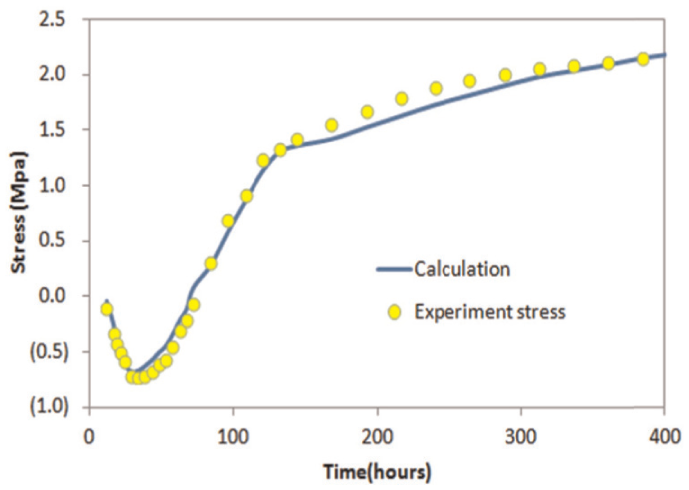
Calculation stress and experiment stress.
Creep fracture test
In order to validate the proposed coupled creep–damage model. The uniaxial compression test under sustained loads which was conducted by Rusch 37 has also been simulated. In experiment, the load was applied at age 56 days of concrete. The calculating model is shown in Figure 4(a). A uniform load on the top of the model and normal displacement constraint condition at the bottom are applied. The volume ratio of aggregate in the calculating model is 0.68. According to the experiment data, the concrete modulus is 31 GPa, and the Poisson’s ratio of concrete is 0.15. The creep of concrete at 56th day age is

The creep fracture model and the simulation results: (a) the calculating model, (b) the failure state of sustain 0.9fc load, (c) the failure state of sustain 0.85fc load, and (d) the failure state of sustain 0.80fc load.
It is assumed that the elastic modulus of the aggregate is 50 Gpa, and the calculation parameters of the mortar are obtained by the inversion method. The modulus of mortar is 12.6 GPa, and the fracture energy is 120 N/m. The coefficient θ in equation (28) is set as 0.15; the creep of mortar at 56th day age is

The numerical simulations were conducted by increasing the surface load with a constant load rate until a certain fraction of the strength and then sustain it. Figure 4(b) and (c) shows the final failure states of concrete under different levels of sustained load. The comparison between the numerical result and test result is shown in Figure 5. It shows that the coupled creep–damage model has good accuracy, and it can be well applied to simulate the concrete creep behavior.

Strain evolution of uniaxial compression test under sustained loads.
Mesoscale model of cooling pipe
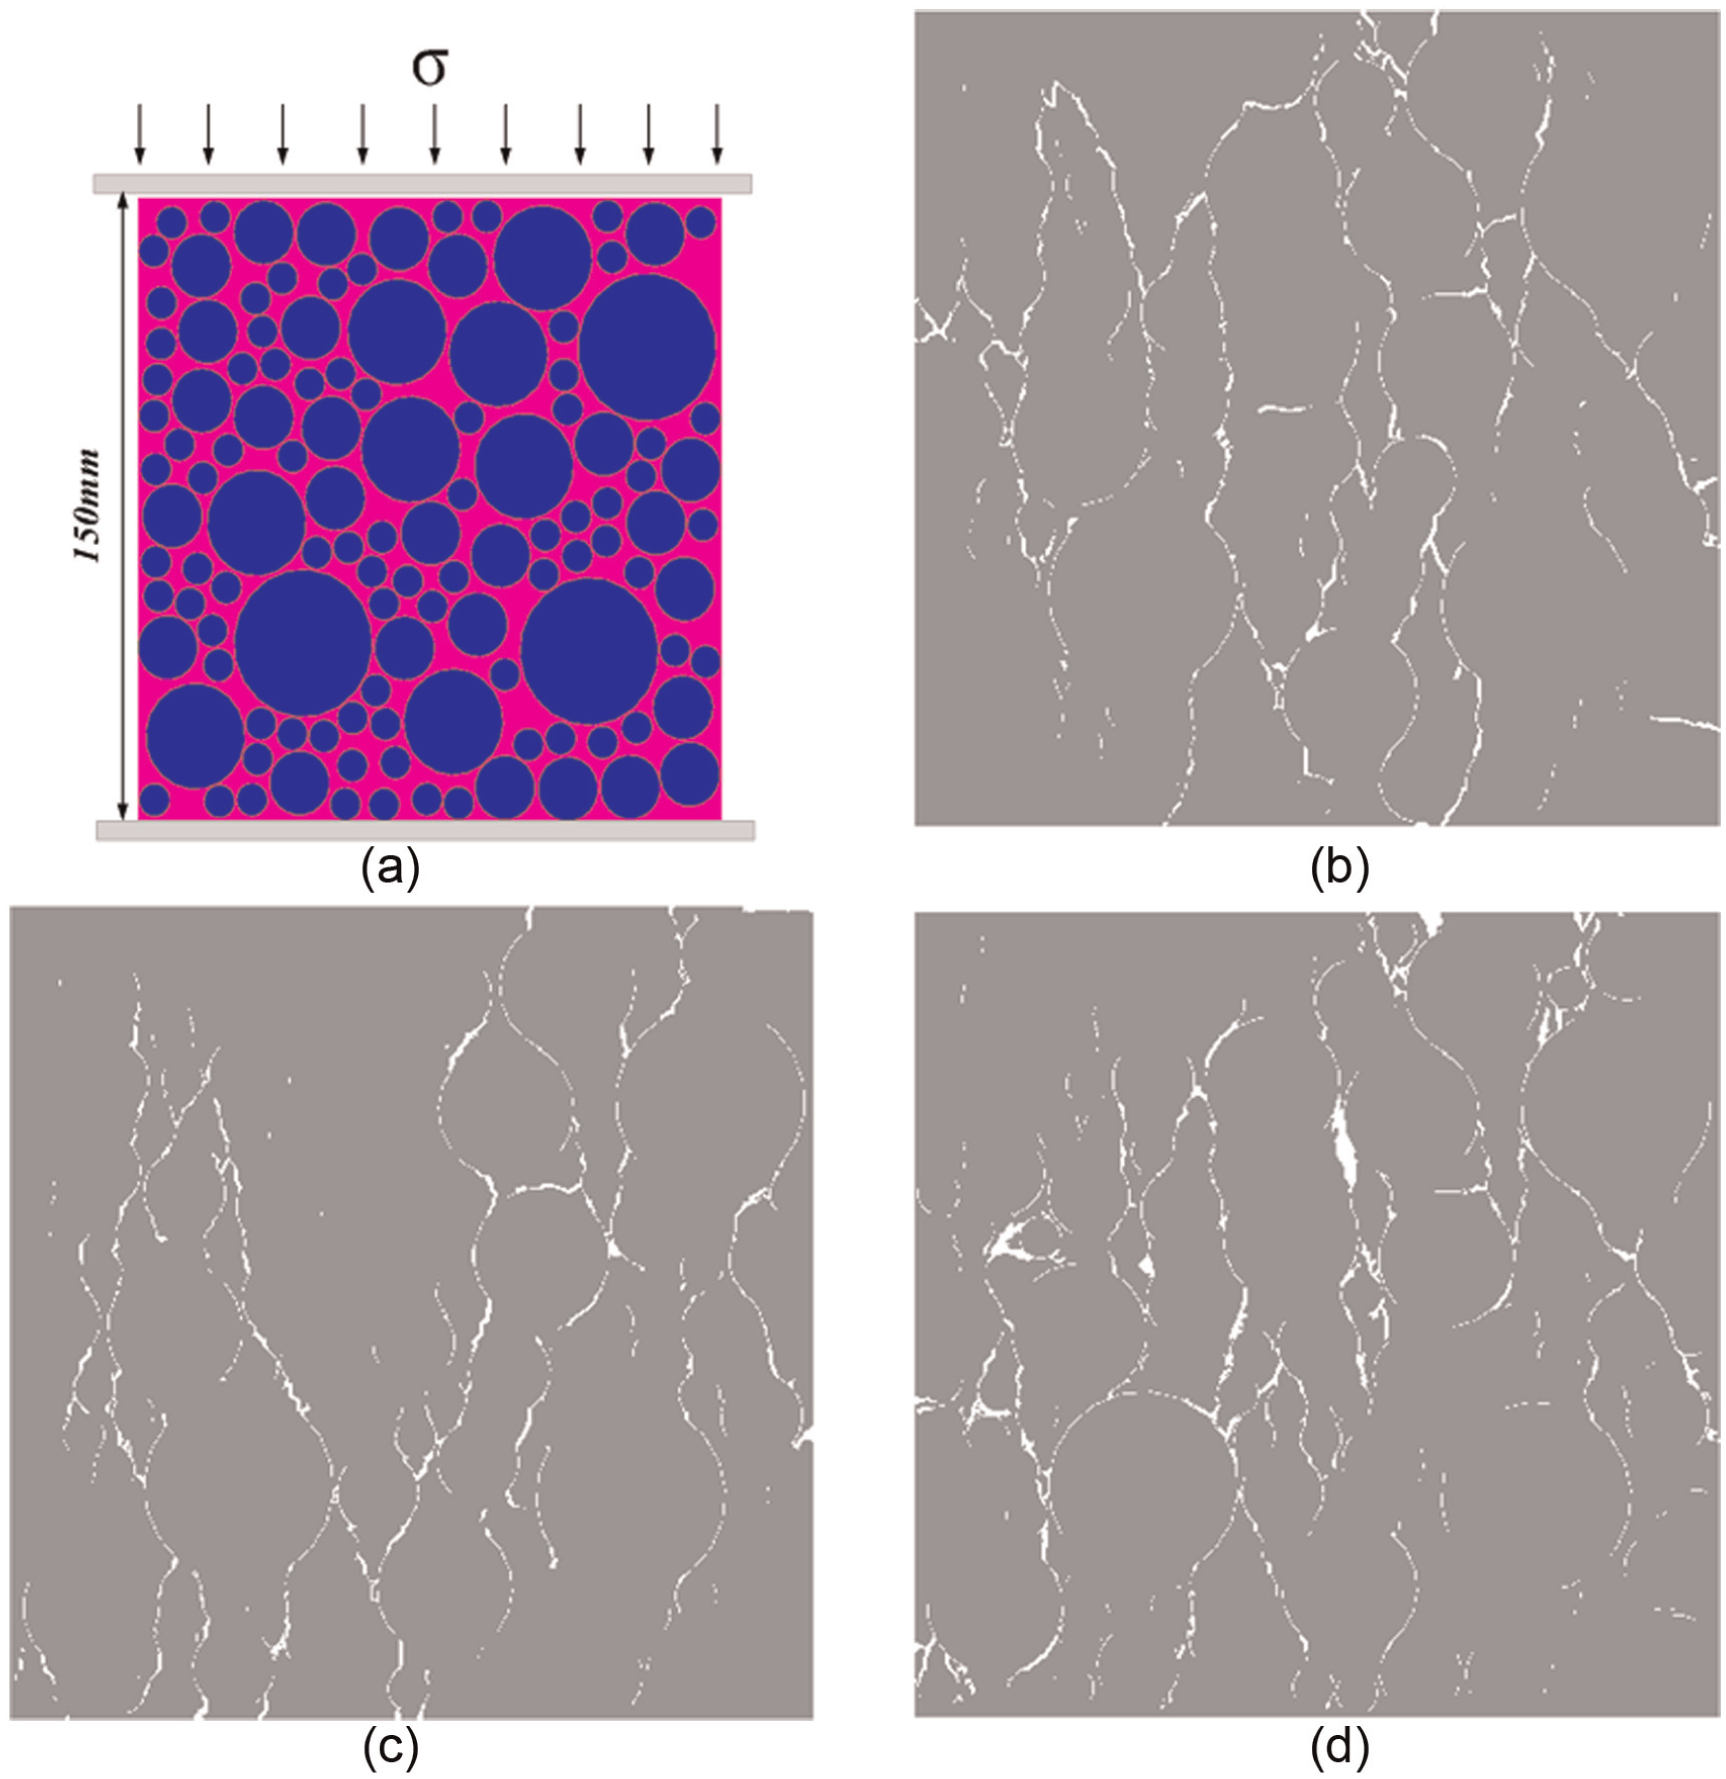
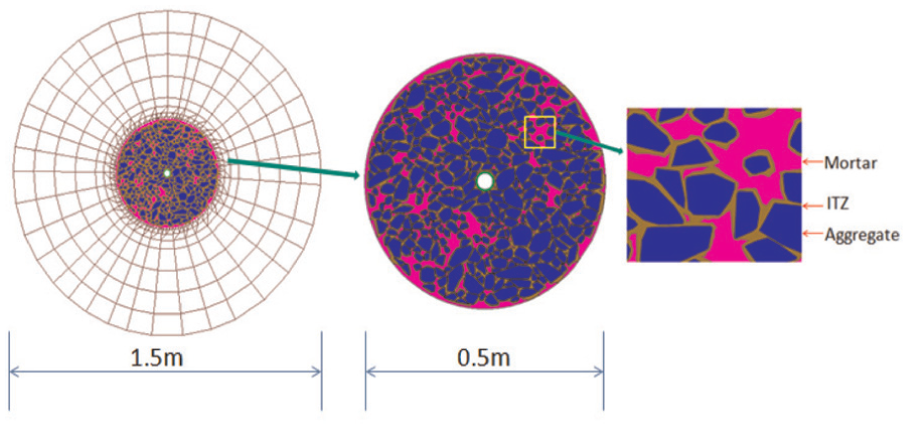
Pipes are generally arranged in the form of a hexagon in the cross section as shown in Figure 6. Thus, the computing model can be an approximated set for the axisymmetric cylinder (three-dimensional (3D)) or a disk (two-dimensional (2D)) to analyze single cooling pipe. 30 In this study, the computing model is a plane disk, which is calculated as a plane stress problem. The disk diameter is set as 1.5 m, the pipe outer diameter is 20 mm, and the pipe thickness is 2 mm. This study does not process the entire disk as a mesoscopic model to reduce the computing scale but processes the concrete within the diameter of 0.5 m as a heterogeneous material and 0.5 m outside concrete as a homogeneous material.

Hexagonal arrangement of cooling pipes (S1 and S2 are, respectively, horizontal and vertical spacing of the pipe).
In the heterogeneity region, the aggregate distribution is packed by the DDATOOL 38 program, which can simulate aggregate falling, mixing, and contacting based on Discontinuous Deformation Analysis (DDA) theory. 39 The generation process of random aggregate model is shown in Figure 7.
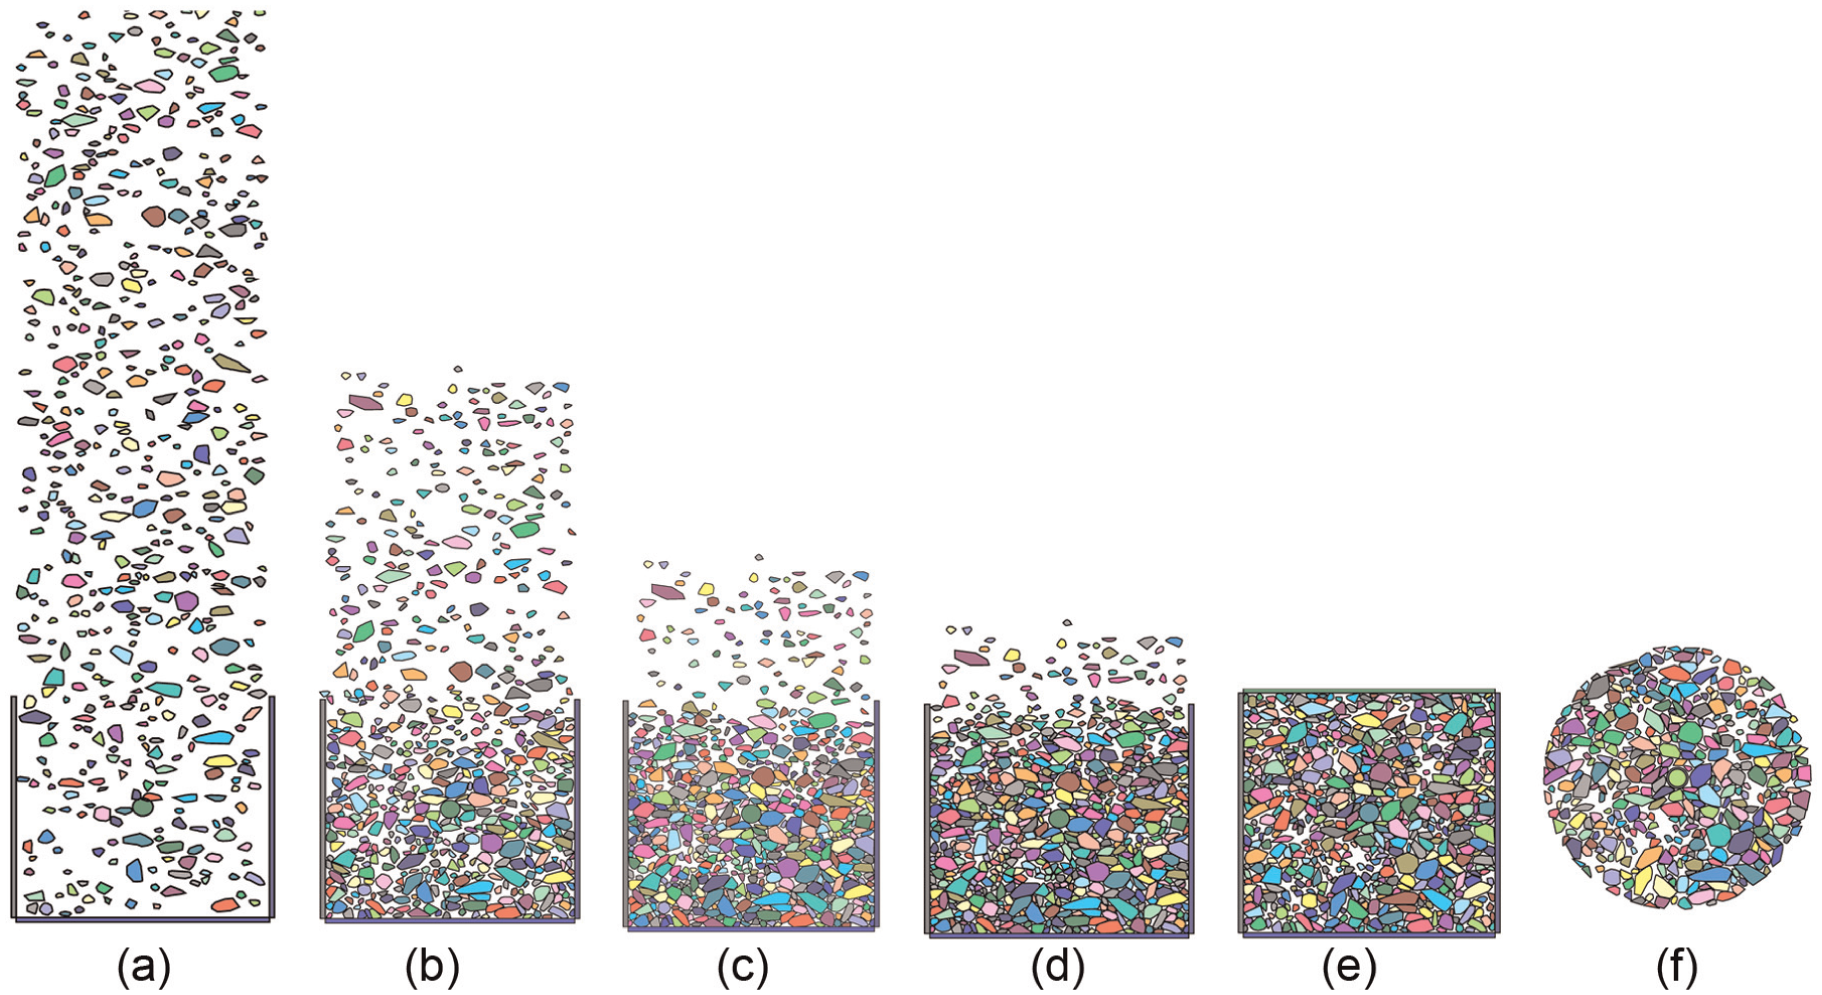
The generation process of a random aggregate model: (a–d) aggregate falling, (e) aggregate vibration, and (f) disk cutting.
Concrete is set as the two-graded concrete, and the aggregate area proportion is 0.6. The entire model has a total of 355 aggregate particles, of which the middle-sized aggregate (d = 20–40 mm) is 78 grains, and the small-sized aggregate (d = 5–20 mm) is 277.
The entire disk comprises a total of 70,749 elements and 72,882 nodes. The element type is triangular inside the diameter of 0.5 m and quadrilateral outside the diameter of 0.5. The finite element model is shown in Figure 8. An ITZ exists between aggregate and mortar. It is commonly observed that the thickness of the ITZ is about 20–40 µm.40,41 If the size of ITZ elements is controlled at this level, the mesh work will be tough. In order to reduce the difficulty, the size of ITZ elements has been controlled at the same level as the mortar elements (1–4 mm) and directly set from the aggregate adjacent elements.
Computing model.
The corresponding homogeneous model (it will be denoted as homo-model in the following parts) is also analyzed to compare with the analysis result of the heterogeneous model (it will be denoted as hete-model in the following parts). The homo-model and hete-model use the same finite element mesh but different material parameters. In the homo-model, all elements are assigned to the same material parameters.
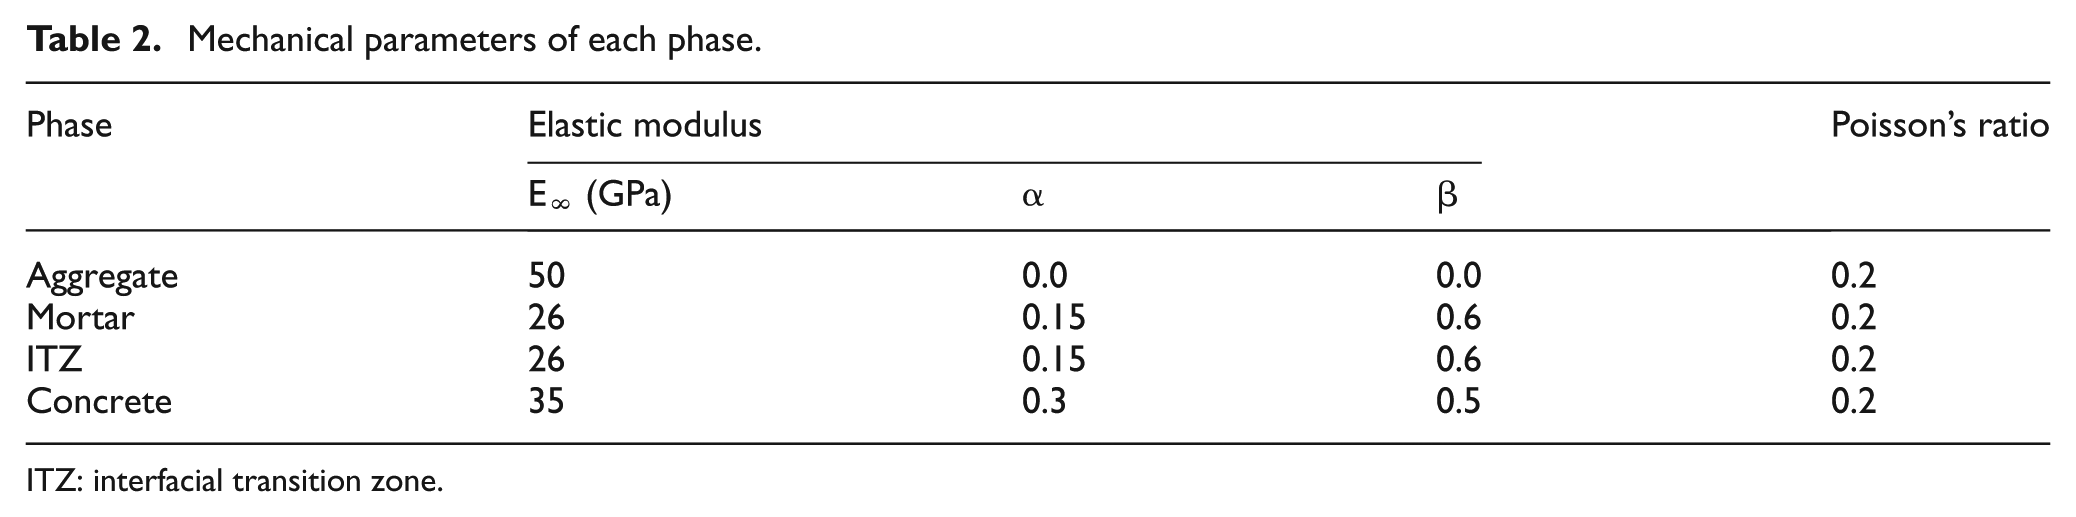
In the two models, mortar, ITZ, and concrete elastic modulus all consider the effect of age. The elastic modulus is expressed in equation (3). ITZ is generally regarded as the weak zone of concrete. Several researches indicated that ITZ strength is only about 40%–90% of mortar and is dependent on the aggregate type, aggregate smoothness, and water–cement ratio. 42 The ITZ strength is set as 70% of mortar in this study. As the size of ITZ elements is same as that of mortar elements and in order to reduce the difficulty of parameters inversion, the other parameters of ITZ are set to be the same as those of mortar. The several specific parameters are listed in Tables 2 and 3. The unit creep is expressed in equation (7). The aggregate unit creep is 0. Other material creep parameters are shown in Table 4. The concrete property parameters are quoted from the experiment data of Xiluodu Arch Project. 43 The mortar and ITZ property parameters are obtained by the parameter reversion. The coefficient θ of equation (28) is set as 0.15.
Mechanical parameters of each phase.
ITZ: interfacial transition zone.
Thermal and strength parameters of each phase.

ITZ: interfacial transition zone.
Creep parameters of each phase (10−6/MPa).

ITZ: interfacial transition zone.
Linear elastic analysis
Comparison of temperature
The initial temperature of concrete is set as 30°C, and the cooling water temperature is 15°C. Since the second-phase cooling usually starts at the late stage of concrete, the cooling time is set from 90 to 150 days. During this period, there is barely hydration heat. Therefore, the adiabatic temperature rise is not considered in this study. The boundary condition of outer circle is set as adiabatic boundary, and the inner circle is set as the first kind of boundary condition, as shown in Figure 9. The temperature fields of the homo-model and hete-model are computed. Figure 10 presents the variation of the mean temperature of the homo-model and hete-model with age, and Figure 11 shows the comparison of temperature distribution along the x-axis (as shown in Figure 9) between the homo-model and the hete-model. The results show that the temperatures of the homo-model and hete-model have a small difference. The numerical results of this section indicated that the heterogeneity effect on the concrete temperature field around the cooling pipe can be ignored.

The thermal boundary condition of the model.

Mean temperature curve of the homo-model and hete-model.

Temperature comparison between the homo-model and the hete-model.
Comparison of stress
Under the condition of no external constraints, the stress caused by pipe cooling is mainly attributed to two reasons. The first one is the temperature gradient around the pipe. The second one is the different material properties of aggregate and mortar.
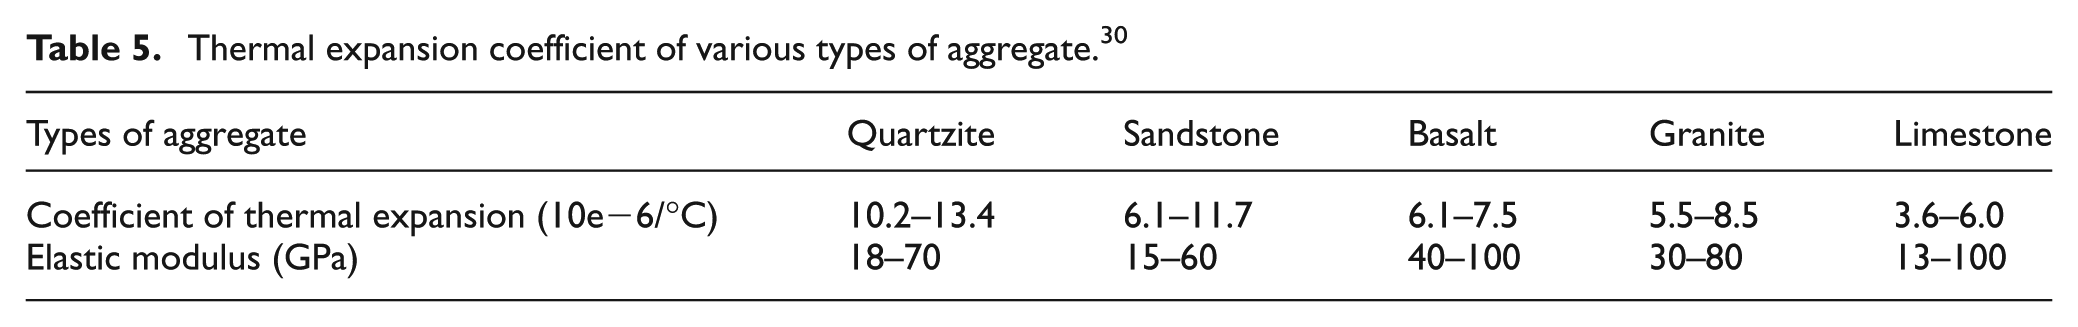
The material property difference between aggregate and mortar is also ascribed to two aspects. One is their difference in thermal expansion coefficient. The thermal expansion coefficient of mortar is between 11.0 × 10⁻⁶/°C and 20.0 × 10⁻⁶/°C, 30 which is generally higher than that of aggregate (see Table 5). The other is their difference in elastic modulus. The elastic modulus of aggregate (see Table 5) is greater than that of mortar in general.
Thermal expansion coefficient of various types of aggregate. 30
Due to the different thermal expansion coefficients and elastic moduli of aggregate and mortar, even in a uniform temperature field, the deformation of the mortar and aggregate will not synchronize each other. The deformation of mortar is greater than that of aggregate; thus, the deformation will be bound to make tensile stress in mortar and compressive stress in aggregate. Such stress due to the aggregate constraint is called aggregate constraint stress in this study, and the stress caused by the temperature gradient around the pipe is named as temperature gradient stress.
The temperature gradient stress and the aggregate constraint stress have several differences. The temperature gradient stress will disappear as the temperature gradient disappears, but the aggregate constraint stress does not disappear as the temperature gradient disappears. After pipe cooling, the concrete temperature even becomes uniform; the temperature gradient stress becomes zero, but the aggregate constraint will remain large. The aggregate constraint stress is due to the heterogeneity of concrete. Hence, there are both temperature gradient stress and aggregate constraint stress in the hete-model, whereas there is only temperature gradient stress in the homo-model.
The CPWTD of 15°C is set as an example to calculate the cooling stress field of the homo-model and hete-model. The cooling time is from 90th day age to 120th day age.
Figure 12 shows the circumferential stress distribution along the x-axis for the homo-model (in this study, given no specifications, all stress is circumferential stress), and Figure 13 presents the stress distribution of the hete-model. Comparison of Figures 12 and 13 indicates that the stress distribution curve is smooth in the homo-model but fluctuated in the hete-model. It is clear that this local convexity of curve of the hete-model is caused by the concrete mesoscopic heterogeneity.

Stress distribution of the homo-model.

Stress distribution of the hete-model.
From Figures 12 and 13, the comparison of the stress distributions of the homo-model and hete-model implies that the stress difference at the beginning of the pipe cooling is less than the stress difference at the end of pipe cooling. At the early stage of the pipe cooling, the temperature gradient is the main cause of stress. Given that the temperature differences between homo-model and hete-model are small, the early stress difference is small. At the end of cooling, the aggregate restraint becomes the main cause of stress. Hence, the stress of the homo-model tends to be zero, but the hete-model retains a larger residual stress, as shown in Figure 14

Maximum stress process line comparison of the homo-model and hete-model.
Subtracting the homo-model stress field from the hete-model stress field, the residual stress field can indicate the intensity of the aggregate restraint stress field to some extent. Figure 15 shows the maximum stress development of the residual stress field. It also indicates that the aggregate restraint stress is small in the early stage and large at later stage and, finally, can reach about 2.0 MPa.

Maximum stress process line of the residual stress field.
Effect of different CPWTDs
The CPWTDs are set to 20°C, 17°C, 15°C, 13°C, 10°C, and 5°C, and the cooling time is from 90th day age to 120th day age. The corresponding cooling stresses are calculated. Tables 6 and 7 provide the maximum stress and various stress zone depths of the homo-model and hete-model (in this article, the stress zone depth is the maximum distance from pipe to the zone of a specific tensile stress level). The stress zone depth of the hete-model is determined according to the 100%, 50%, and 0% of the ITZ strength of 2.4 MPa. The stress zone depth of the homo-model is determined according to the 100%, 50%, and 0% of the concrete strength of 3.0 MPa. These two tables indicate that different CPWTDs lead to different maximum stresses. The maximum stress is proportional to the CPWTD, and the homogeneous and heterogeneous maximum stresses are almost the same.
Zone depth of the tensile stress of the homo-model.

CPWTD: temperature difference between the concrete and pipe water.
Zone depth of the tensile stress of the hete-model.
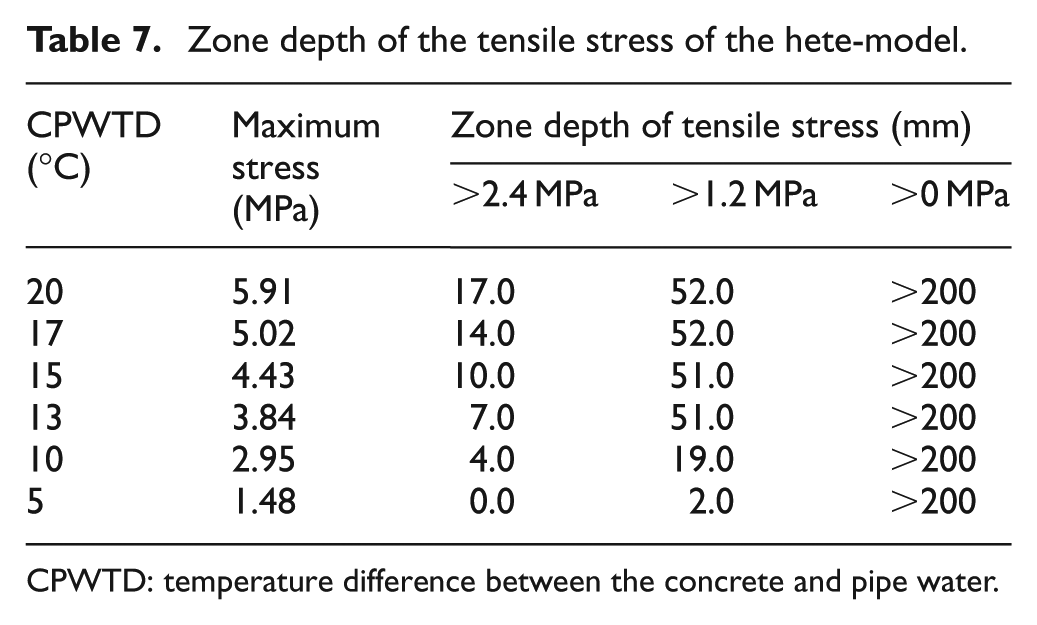
CPWTD: temperature difference between the concrete and pipe water.
From Figures 16 and 17, it can be seen that in both homo-model and hete-model, the maximum stress occurs near the pipe, and although the cooling stress is the tensile stress in a large range, the range of high levels of stress (50%) is smaller. The depth of the homo-model (>1.5 MPa) is between 0 and 48 mm, which is only 0–2 times of the pipe diameter. The depth of the hete-model (>1.2 MPa) is between 0 and 52 mm, which is basically the same as that of the homo-model.

Stress distribution for different CPWTDs (homo-model, at 90.5th day age).

Stress distribution for different CPWTDs (hete-model, at 90.5th day age).
Effect of multistep cooling
High CPWTD can produce large tensile stress around the cooling pipe. Therefore, Bofang 16 suggested using a new mode of cooling, which has smaller temperature difference, earlier cooling, and slower cooling, to replace the traditional mode, which has a large temperature difference, late cooling, and rapid cooling. This section evaluates the effect of multistep cooling on concrete stress. Three cases are set as follows:
One-step case: t (t is the concrete age) = 90–150 days, Tw (Tw is the cooling water temperature) = 10°C;
Two-step case: t = 90–120 days, Tw = 20°C; t = 120–150 days, Tw = 10°C;
Three-step case: t = 90–110 days, Tw = 24°C; t = 110–130 days, Tw = 17°C; t = 130–150 days, Tw = 10°C.
The concrete initial temperature of each case is 30°C, and the creep isn’t be considered in the constitutive model. Figure 18 shows the mean concrete temperature of each case. It indicates that the temperature drop rate of each case is different, the rate of one-step case is largest, and the rate of three-step case is smallest in these three cases. From Figures 19 and 20, multistep cooling can significantly reduce the peak stress but insignificantly influences the final residual stress.

Mean temperature curve of each case.

Peak stress curve of each case (homo-model).

Peak stress curve of each case (hete-model).
This result shows that without considering the creep, the later residual stress is slightly affected by the cooling path and is highly related to the foundation temperature difference, which is the difference between the final and initial temperatures of concrete.
Damage analysis
The preceding calculation is the linear elastic analysis, without considering the crack propagation in the high-stress area. Although the depth of the high-stress zone around pipe is small, given that the concrete is quasi-brittle material, when a point stress excesses tensile strength and starts to crack, crack is likely to unstably and rapidly extend beyond the high-stress zone and may form some harmful cracks. Based on the coupled creep–damage model, this part aims to simulate the concrete cracks around the cooling pipe. The principle of the damage model is shown in section “Computational model.”
Damage analysis of different CPWTDs
The initiation and evolution of damage under different temperatures of the homo-model and hete-model are studied. A total of six cases of different CPWTDs (20°C, 17°C, 15°C, 13°C, 10°C, and 5°C) are calculated. The cooling period of each case is from 90th day age to 120th day age. The concrete initial temperature is 30°C.
Figure 21 shows the damage distribution of the homo-model. The calculation result indicates that after cooling for half of a day, the concrete reaches maximum damage and then remains in an unchanged state. The damage state on the 120th day is the same as the 90.5th day condition. This result shows that in the homo-model, the damage is determined by the maximum stress of initial stage of pipe cooling. With the reduction of cooling-induced stress, the damage does not increase further.
Damage distribution of the homo-model (between 90.5th day age and 120th day age): (a) CPWTD = 20°C (dep = 28 mm), (b) CPWTD = 17°C (dep = 20 mm), (c) CPWTD = 15°C (dep = 15 mm), (d) CPWTD = 13°C (dep = 11 mm), (e) CPWTD = 10°C (dep = 0 mm), and (f) CPWTD = 5°C (dep = 0 mm).
Figure 22 presents the damage distribution of the hete-model. The damage range of the hete-model is greater than that of the homo-model. For example, in the case of CPWTD = 20°C, the damage depth of the homo-model is 28 mm; by contrast, the damage depth of the hete-model is 81 mm, which is approximately three times of that of the homo-model.

Damage distribution of the hete-model (on the 90.5th day age): (a) CPWTD = 20°C (dep = 81 mm), (b) CPWTD = 17°C (dep = 56 mm), (c) CPWTD = 15°C (dep = 40 mm), (d) CPWTD = 13°C (dep = 27 mm), (e) CPWTD = 10°C (dep = 12 mm), and (f) CPWTD = 5°C (dep = 0 mm).
Figure 23 shows the damage distribution on the 120th day age (with cooling for 30 days). For some CPWTDs (e.g. 20°C and 17°C), the later damage may increase further and expand to a wider range. It is clear that this phenomenon is caused by the residual stress of the late age, and the residual stress is the aggregate constraint stress mentioned above.
Damage distribution of the hete-model (on the 120th day age): (a) CPWTD = 20°C (dep = 230 mm), (b) CPWTD = 17°C (dep = 226 mm), (c) CPWTD = 15°C (dep = 46 mm), (d) CPWTD = 13°C (dep = 27 mm), (e) CPWTD = 10°C (dep = 12 mm), and (f) CPWTD = 5°C (dep = 0 mm).
Therefore, the mesoscopic heterogeneity characteristic of concrete has an obvious influence on the damage of the concrete near the cooling pipe. This influence is mainly caused by two factors: one is weaken strength of ITZ and the other is the aggregate constraint stress in the hete-model. These two factors are not considered in the homo-model. Through a series of above calculation results, it can be concluded that the negative effect of high CPWTD has indeed been underestimated in most of the previous analyses of pipe cooling in which the homo-models are used and the heterogeneous characteristics of concrete are ignored.
Damage comparison of different multistep cooling modes
For unconstrained concrete, the damage caused by pipe cooling is mainly associated with two aspects. On one hand, the damage is resulted from the temperature gradient stress in the early stage of pipe cooling. On the other hand, the damage is due to the aggregate constraint stress caused by the different properties between aggregate and mortar.
The three cases of step cooling mode of section “Effect of multistep cooling” are deeply studied based on damage calculation. Figure 24 shows the damage distribution of different multistep cooling modes. The result of the homo-model shows that the multistep cooling can significantly reduce the cooling-induced damage, and the result of the hete-model shows that the multistep cooling can reduce the cooling-induced damage to some extent. In addition, the result of the hete-model shows that the multistep cooling has no obvious effect on the decreasing width of damage zone.

Damage distribution of different step cooling (a–c for the hete-model and d–f for the homo-model): (a) one-step cooling (Dmax = 0.86), (b) two-step cooling (Dmax = 0.60), (c) three-step cooling (Dmax = 0.54), (d) one-step cooling (Dmax = 0.68), (e) two-step cooling (Dmax = 0), and (f) three-step cooling (Dmax = 0).
The preceding analysis and calculation of multistep cooling do not consider the creep effect. In fact, concrete is a creep material. Under constant deformation for a long time, concrete stress will present relaxation. In addition, the smaller the age of concrete, the greater the creep. We can utilize this characteristic of concrete to reduce the aggregate constraint stress.
The following three cases are considered:
Age-90 case: t = 90–110 days, Tw = 24°C; t = 110–130 days, Tw = 17°C; t = 130–150 days, Tw = 10°C;
Age-60 case: t = 60–90 days, Tw = 24°C; t = 90–120 days, Tw = 17°C; t = 120–150 days, Tw = 10°C;
Age-30 case: t = 30–70 days, Tw = 24°C; t = 70–110 days, Tw = 17°C; t = 110–150 days, Tw = 10°C.
The damage of the three cases is shown in Figure 25. The calculation results imply that earlier cooling can obviously reduce the degree and range of damage.

Damage distribution of different step cooling considering creep influences: (a) age-90 case (Dmax = 0.86), (b) age-60 case (Dmax = 0.40), and (c) age-30 case (Dmax = 0.33).
Influence of cooling damage on anti-crack performance
Although pipe cooling leads to a certain amount of damage around the pipe, the damage influence on the concrete performance remains unknown. In this part, a computational model is established, as shown in Figure 26(a). The computing model is a 1.5 × 1.5-m rectangle. The mesoscopic disk model of 0.5 m diameter is located in the center of the rectangle. The top of the model presents a uniform load, and the bottom exhibits a normal restrained condition. The stress and damage fields from the above result are input as initial condition and then calculate every step mechanical response of model with gradually increasing top load.

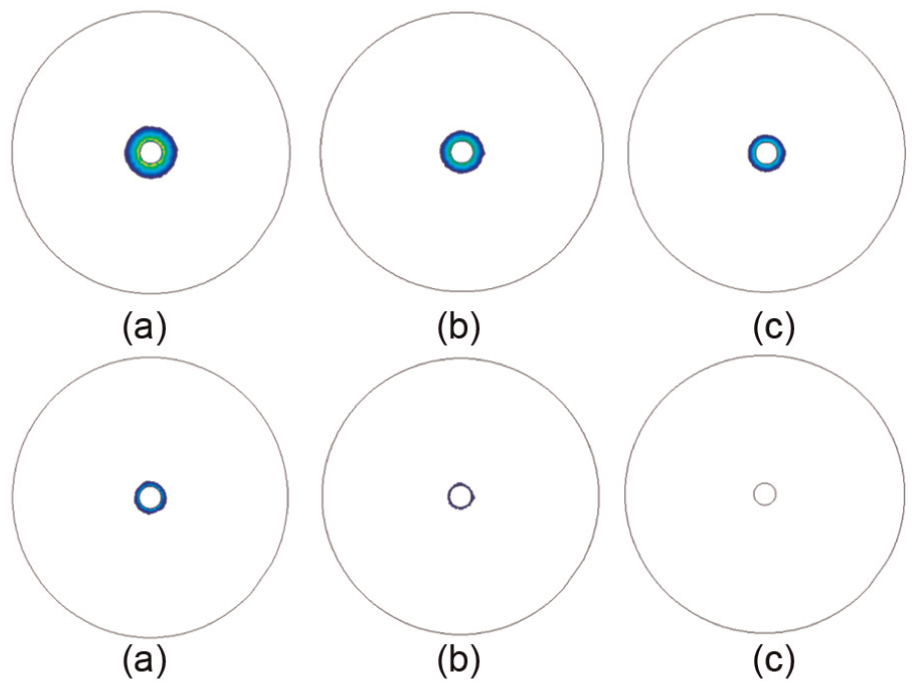
Concrete-cracking process around pipe under outside load (CPWTD = 15°C): (a) load model, (b) P = 0.5 MPa, (c) P = 0.7 MPa, (d) P = 1.0 MPa, (e) P = 1.3 MPa, and (f) P = 1.5 MPa.
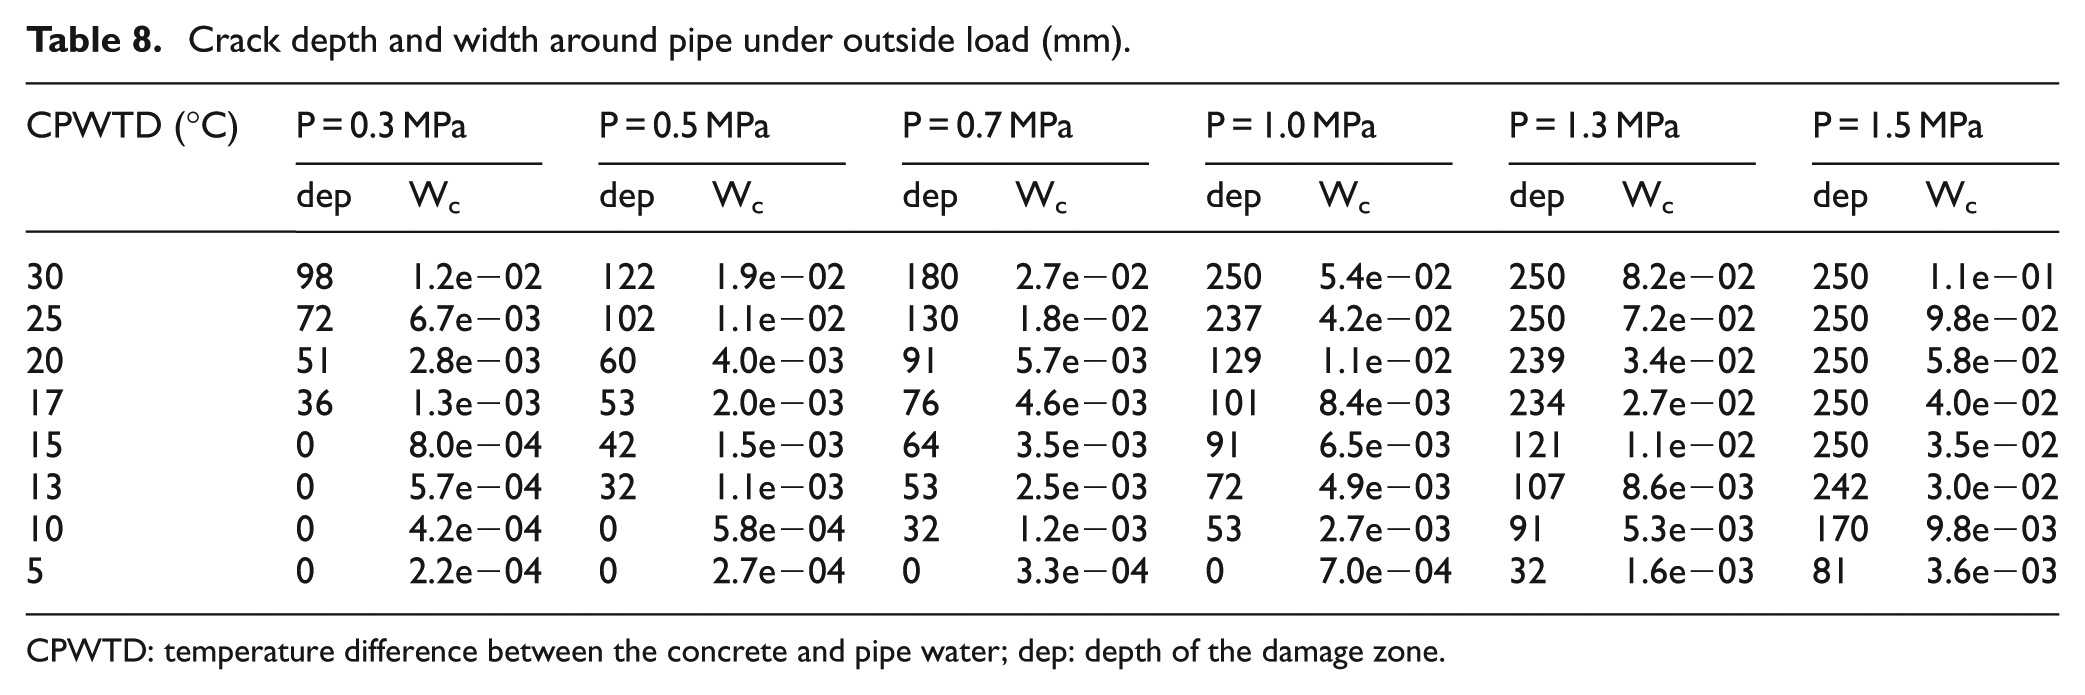
The purpose of this calculation is to study the influence of cooling damage on the anti-crack capacity of concrete. Figure 26(b)(f) shows the concrete crack propagation process when the CPWTD = 15°C. Figure 27 and Figure 28 shows the concrete crack propagation process when the CPWTD = 5°C and 20°C respectively. It can be seen that cracks start from the pipe and extend through ITZ and toward the direction away from the pipe. The comparison result of Figure 27 and Figure 28 indicates that high CPWTD leads to more harmful cracks.

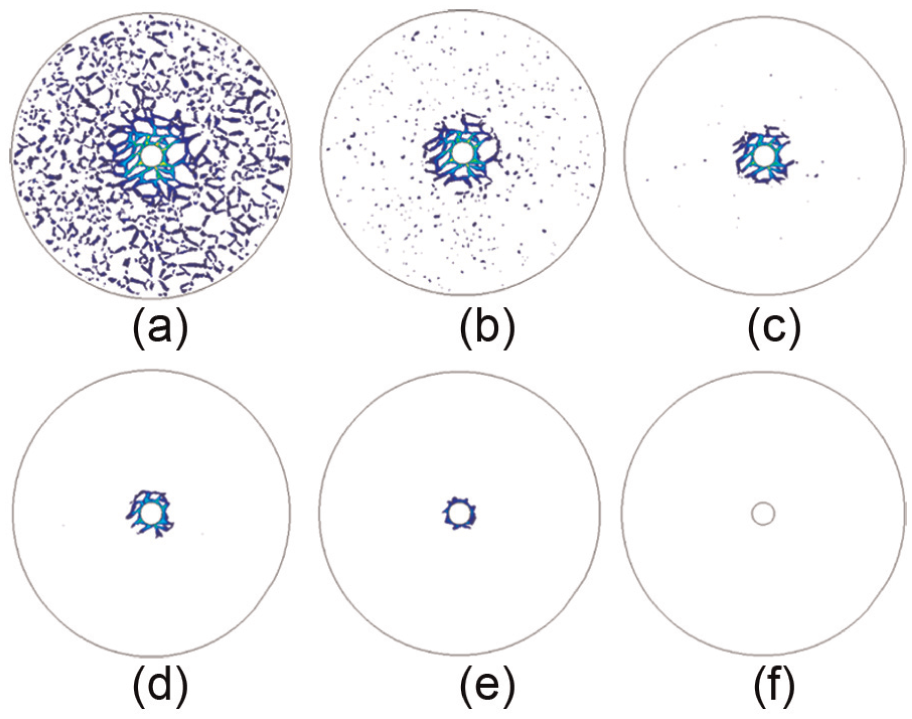
Concrete-cracking process around pipe under outside load (CPWTD = 5°C): (a) P = 0.3 MPa, (b) P = 0.5 MPa, (c) P = 0.7 MPa, (d) P = 1.0 MPa, (e) P = 1.3 MPa, and (f) P = 1.5 MPa.

Concrete-cracking process around pipe under outside load (CPWTD = 20°C): (a) P = 0.3 MPa, (b) P = 0.5 MPa, (c) P = 0.7 MPa, (d) P = 1.0 MPa, (e) P = 1.3 MPa, and (f) P = 1.5 MPa.
In order to analyze to the degree of the cracks, the depth and width are calculated in this part. The depth of cracks is determined by the maximum distance from the cooling pipe to the nodes where damage equals to 1.0. The width of cracks is calculated by the formula as follows

where Wc is the mean width of cracks; εt is the mean tensile strain of element; lt is the square root of the area of element; V(D = 1) is the area of the all elements where damage equals to 1.0.
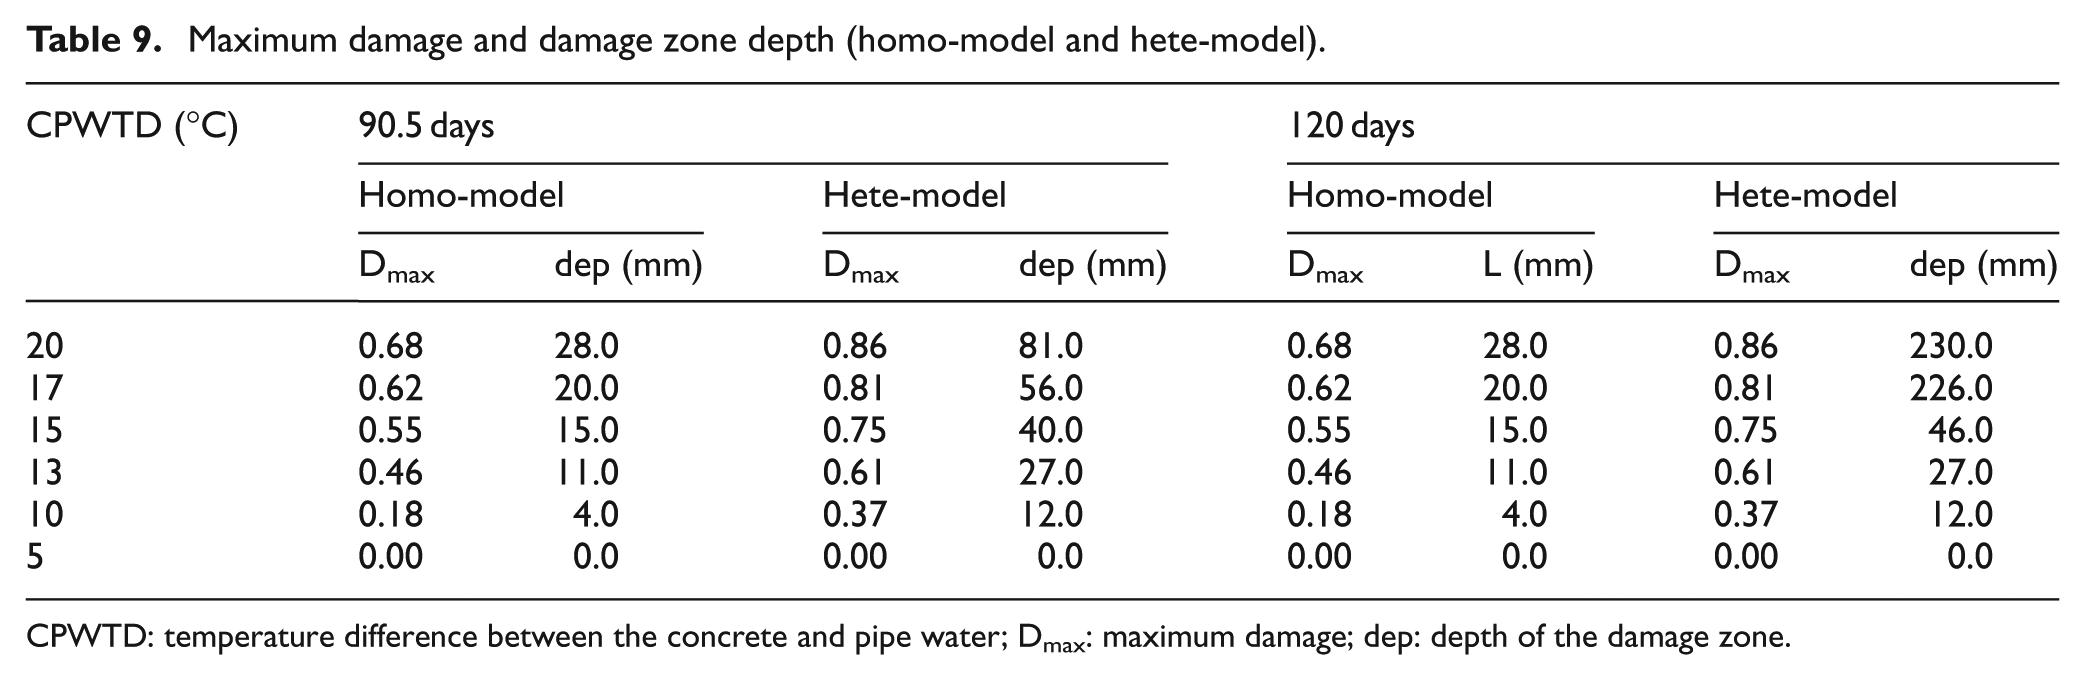
Table 8 lists the cracks depth and width under the combination of every CPWTD and every load levels. High CPWTD produces larger crack than that produced by low CPWTD at the same outer load. For instance, under the same 1.0 MPa load, the depth of the CPWTD = 20°C model amounts to 129 mm, but the CPWTD = 5°C model does not present cracks. Therefore, the influence of cooling damage on the anti-crack performance of concrete is unfavorable. Considering the fact that the maximum tensile stress of concrete dam can reach to the range from 1.4 to 1.7 MPa, 44 it is recommended that special attention should be paid on the crack under this level of external load. From Table 9, it can be drawn a conclusion that the CPWTD should be small and 5°C is appropriate. This value is consistent with Zhu’s value.
Crack depth and width around pipe under outside load (mm).
CPWTD: temperature difference between the concrete and pipe water; dep: depth of the damage zone.
Maximum damage and damage zone depth (homo-model and hete-model).
CPWTD: temperature difference between the concrete and pipe water; Dmax: maximum damage; dep: depth of the damage zone.
Conclusion
Based on meso-mechanics and finite element method, this study evaluates the influence of pipe cooling on the thermal stress of concrete and its factors, such as the CPWTD and the number of cooling steps. The conclusions are as follows: (1) the influence of the mesoscopic heterogeneity of concrete on the temperature field is insignificant. The influence on the stress field is also insignificant at the beginning of pipe cooling but remarkable at the end of pipe cooling. (2) Although the depth of high tensile stress (>50% of tensile strength) caused by pipe cooling is small, the depth of low tensile stress (>0 MPa) is great, especially in the late age. (3) Creep is good for decreasing damage and can effectively reduce the stress and damage caused by water pipe cooling. (4) The stress and the damage induced by pipe cooling have significant influence on the anti-crack performance of concrete, and the CPWTD should better be controlled at about 5°C or so.
Footnotes
Academic Editor: Mohammad Talha
Declaration of conflicting interests
The author(s) declared no potential conflicts of interest with respect to the research, authorship, and/or publication of this article.
Funding
The author(s) disclosed receipt of the following financial support for the research, authorship, and/or publication of this article: The research was supported by the National Key Basic Research Program of China (grant no. 2013CB036406, 2013CB035904), the National Key Research and Development Project of China (grant no. 2016YFB0201000), the National Natural Science Foundation of China (grant no. 51579252, 51439005), the Special Scientific Research Project of the State Key Laboratory of Simulation and Regulation of Water Cycle in River Basin and the Special Scientific Research Project of the China Institute of Water Resources and Hydropower Research (grant no. SS0145B392016).