
Abstract
The disposal of industrial effluents into the environment is an issue that has attracted attention of researchers and engineers with particular reference for produced water originating from the petroleum industry. Separation process using ceramic membranes has been an alternative used to obey requirements of environmental agencies in Brazil related to disposal of oil and grease. Accordingly, we have studied numerically the fluid flow into a separation module with tubular membrane. The conservation equations for mass, linear momentum, and mass transport in conjunction with the re-normalization group k-ε turbulence model were resolved with aid of the ANSYS CFX 12 commercial package. Results of the streamlines, vector velocity, pressure, velocity, and concentration fields are presented and analyzed. It was concluded that the proposed mathematical model predicts the behavior of the flow within the separation module and that increasing the level of turbulence and putting an impermeable section into the inlet region of the membrane reduce the effect of the polarization layer.
Introduction
The growing concern for the environment has encouraged the development of mechanisms for water treatments, being water resources most affected by both solid and liquid contaminants. 1
The disposal of water contaminated with oil originating from oil and gas exploration and production activities is a growing problem in the oil industry. Produced water must be treated before it returns to the environment. According to the specifications regulated by environmental control Brazilian agency, the oil and grease content in effluents may not exceed 20 mg/L. 2
The produced water may be defined as any water present in an oil reservoir. During the production, water phase flows with crude oil and/or natural gas to the surface. This water is usually composed of a mixture of gaseous or liquid hydrocarbons, dissolved solids (carbonates, sulfates, sodium chloride, potassium chloride, calcium chloride, and magnesium chloride), and suspended solids (sand, slurry, clay, etc.). Dispersed oil can be considered as an important pollutant because of its toxic effects, impacting strongly around the disposal area. The contaminant concentration depends on different factors, such as oil density, interfacial tension between oil/water phases, the type and efficiency of chemical treatment, and the type, size, and efficiency of the physical separation equipment. 3
The main contribution of produced water in the extraction process consists of an artificial mechanism of oil production, used when the oil reservoir reduce the internal energy and is not able to produce anymore. Therefore, liquid water or water vapor injections are used to increase the pressure in the reservoir and provide the fluid displacement toward the producing well. 4
The water associated with the oil causes several problems in the production, transportation, and refining stages. In the transport and production, we can mention the need for oversizing of installations and higher energy consumption. In the refining stage, if calcium chloride and magnesium are dissolved in water, then the formation of hydrochloric acid by effect of heat, causing premature corrosion in the equipments, may occur. 5
The methods currently used to treat oily water employ physicochemical methods and has been onerous, and in complex and heterogeneous situations present poor efficiency. Among these techniques, decantation, centrifugal separation, flotation, filtration, and so on stand out.
Processes involving filtration, especially those using membranes as filter media, have stood out due to several characteristics that lead them to have better cost/benefit ratio, simplicity of operation, low energy cost, long life, and good quality of the permeate throughout the process.
By the 1970s, in union with the classic separation processes arises a new class of processes using synthetic membranes with selective barrier. These membranes arise in an attempt to represent the existing natural membranes, with characteristics of selectivity and permeability. 6
Membrane cross-flow filtration processes have been widely used by industrial sector for years in a broad range of applications, due to cost and mode of operation (no phase change, isothermal process and can be applied to separate solute particles of different sizes). 7
Liu et al. 8 mention that the performance of most membrane systems which use pressure as the driving force is severely hampered by concentration polarization and membrane fouling, which restricts productivity by reducing the permeate stream. To mitigate these adverse effects, turbulence promoters are widely used to improve the hydrodynamic conditions over the membrane surface and improve the membrane modules performance.
Several theoretical studies have been reported in the literature employing computational fluid dynamics (CFD) as a tool for the study of membrane separation processes. The goal is to explain the concentration polarization layer which is responsible for the permeate flux limitation. For example, Darcovich et al. 9 and Geraldes et al. 10 have used membrane with the shape of a flat plate; Serra et al. 11 and Serra and Wiesner 12 used circular membranes; and Bellhouse et al., 13 Pak et al., 14 and Alves et al. 15 used tubular membranes. Souza 1 used a separation module equipped with tubular ceramic membrane, where the contaminated water is introduced into the device through a rectangular inlet at the module bottom and perpendicular to the membrane surface. The fluid flow rate was controlled so the laminar flow regime within the separation module was assured. The filtrate leaves the device over the inner face of the tubular membrane and the concentrate out through the upper rectangular outlet (Figure 1). Souza 1 found that the thickness of the annular space formed between the outer wall of the ceramic membrane and the module wall affects the solute rejection coefficient, which increases significantly with the reduction in the annular space.

Geometric representation of the separation module.
Several experimental and numerical two-phase flow works are related to laminar flow regime, applied to polymer membranes. Then, as a complement to the research area, this article aims to study two-phase (oil and water) flow into a separation module with tubular membrane via CFD. The study contributes to the understanding of the phenomenon of formation of the polarization layer by concentration at turbulent flow regime, in the annular space between the membrane and the wall of the module, where the inner tube is a ceramic membrane (Figure 1).
Model description
In order to describe the water and oil fluid flow inside the separation module (tubular membrane), a mathematical model was used. This model is composed by the mass and momentum (Navier–Stokes) conservation equations and mass transport equation. The idea is to determine the performance of the device and to predict the behavior of the concentration, velocity, and pressures inside the equipment.
Mathematical model
To study the water–oil separation process, using a shell/tubular membrane microfiltration module, the following considerations were assumed:
Viscosity and density are constant and equal to the pure solvent fluid;
The solute diffusion coefficient is considered constant;
Incompressible, isothermal, and steady-state flow;
Local permeation rate is determined according to the resistance-in-series theory;
The concentration layer is assumed to be homogeneous and the Carmen–Kozeny equation is valid.
With these considerations, the mass (equation (1)) and momentum (equation (9)) conservation equations can be written as follows:
Mass conservation equation

where
Momentum equation

where p is the pressure, and

where
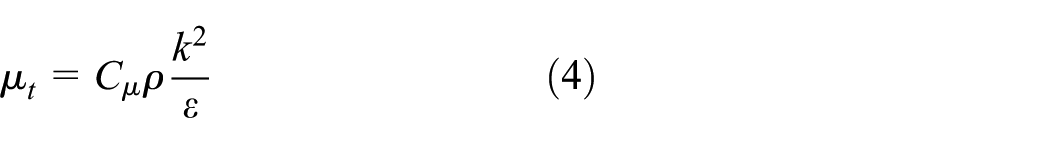
where
The RNG k-ε model is applied commonly to flows with high Reynolds number. This model is composed by the following expressions for turbulent kinetic (equation (5)) and dissipation (equation (6))


where the coefficient Cε1RNG (equation (7)) is given by

where
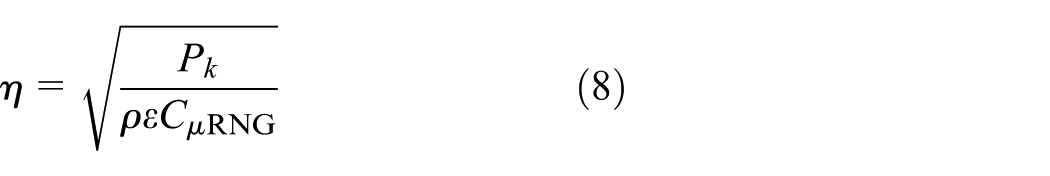
where Pk is the production term by shear effect (equation (9)) given by
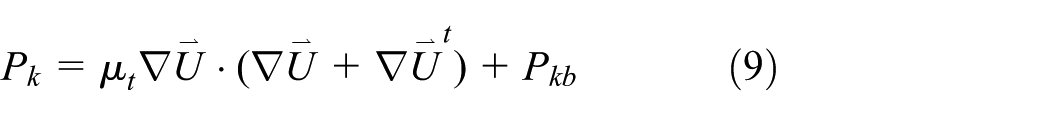
where Pkb is the fluctuation production term (equation (10)), determined as follows
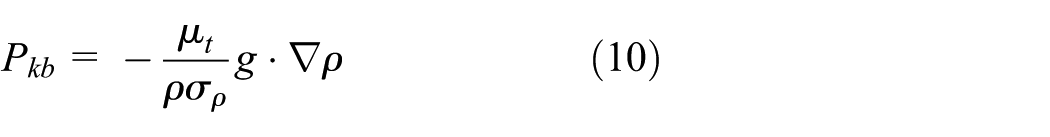
where g is the acceleration gravity, ρ is the specific mass, and σµ is the turbulent Prandtl number.
The values of constants Cε2RNG, CµRNG, βRNG,
Values of model parameters RNG k-ε used in the simulations.

RNG: re-normalization group.
The mass transport equation (equation (11)) is given by

where C represents the solute concentration (oil) and DAB is the mass diffusivity of the solute considered constant for a fixed Schmidt number (Sc). This parameter is determined by equation (12)

Boundary conditions
For a well-posed modeling, boundary conditions must be specified correctly. Further to perform the analyses, additional considerations have been taken: the feed fluid enters in the module for one rectangular side input, the concentrate stream leaves at the top of the device, the flux of concentration through the membrane occurs from outside to inside one, and the flux of permeate is collected from the inside of the tubular membrane. In the following, we cite the boundary condition used in this work:
Inlet conditions (equation (13))

where V0 is the input velocity which is obtained by equation (14)

where dh is the hydraulic diameter and Re is the Reynolds number.
Output concentrate condition (equation (15))

where Pex is the outer membrane pressure equal to 1 atm.
The output conditions of the filtrate (permeate) are given by equation (16). It was considered here, according to Damak et al. 7 These authors reported that in the steady-state regime, there is no accumulation of particles on the liquid–porous media interface, that is, solute particles are practically 100% rejected by the membrane, then

where Uw is the permeate velocity (equation (17)), which is the velocity at which the fluid passes through the membrane. This parameter is determined using a resistance-in-series model, defined by

where Rm is the membrane resistance, defined as the inverse of the permeability given by equation (18)

In equation (17), ΔP is the transmembrane pressure (equation (19)) defined as the difference between the average pressure of the permeate,

and Rp is the resistance due to concentration polarization defined by equation (20)

where

where dp is the average diameter of the solute particles, assumed equal to 80 µm and
To determine the variation in the thickness of concentration, polarization boundary layer

where d is the diameter of the hull
The permeation Reynolds number can be calculated by

In equation (17),

where
Device walls conditions:
Device walls are impermeable with non-slip condition (U = V = W = 0).
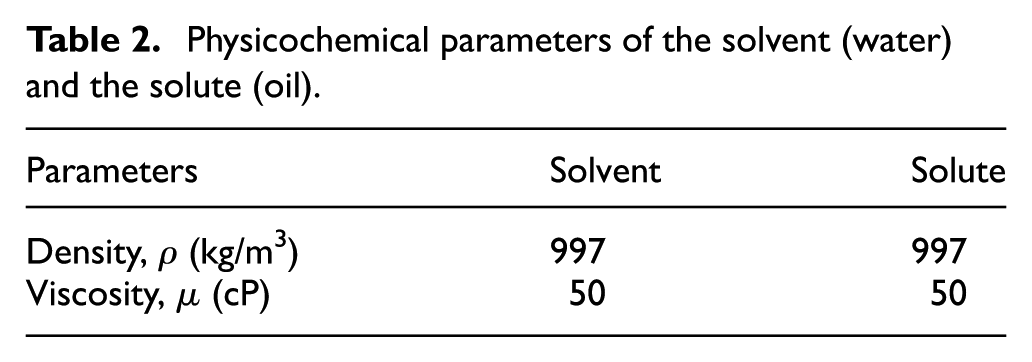
In Table 2, the values of the physicochemical properties of the solvent and solute used in the simulation are shown.
Physicochemical parameters of the solvent (water) and the solute (oil).
The filtrate leaves the device over the tubular membrane inner face and the concentrate out through the upper rectangular outlet (Figure 1). Souza 1 found that the annular space thickness formed between the ceramic membrane outer wall and the module wall affects the solute rejection coefficient, which has increased significantly with the reduction in the annular space.
Description of the geometry and grid of the simulated separation module
The water/oil separation process by microfiltration consists of a pipe diameter, involving a tubular membrane with internal diameter Di. The module has an inlet and a rectangular outlet whose dimensions are shown in Table 3.
Geometric dimensions of the separation module.

For obtain more precise results, to reduce the mesh points and to minimize computational time, resulting in a more efficient simulation process was used hexahedral mesh, built by the blocking process (Figure 2). After refinement, the mesh consists of 35,370 elements.

Three-dimensional structured mesh of the separation module.
Simulated cases
In the simulations, we consider fixed values of the average diameter of oil droplet, dp, 80 µm, permeated Reynolds number
Simulation conditions used in this work.
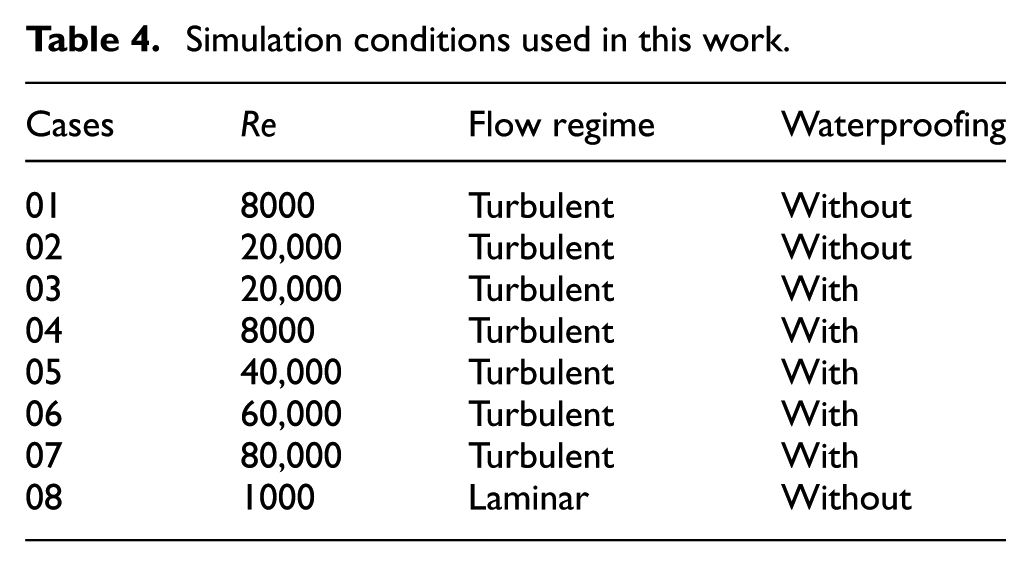
Aiming to minimize the risks in the operation, we studied waterproofing in the direct impact region of the feed stream, introducing, for example, a metallic ring of the same diameter of the membrane, since the direct impact of fluid could result, over time, in wear, cracks, or even breakup.
Simulations were performed using the computational package ANSYS CFX 12.0, using a Quad-Core Server Processor Intel Dual Xeon E5430 2.66 GHz with 16 GB RAM.
Results and discussion
To study the flow behavior in the microfiltration module (shell/tubular membrane) in the laminar and turbulent regimes, simulations were performed in ANSYS CFX 12.1 software. The analysis was done by means of streamlines, pressure, velocity, and concentration fields.
Hydrodynamic analysis without waterproofing
Figure 3 depicts the streamlines inside the module operating in the laminar (a) and turbulent (b) regimes (cases 2 and 8). From the analysis of Figure 3, we can see chaotic behavior of the fluid inside the module when operating in the turbulent regime as (Figure 3(b) compared with the case showed in Figure 3(a) due to increased feed rate. These results indicate a three-dimensional behavior of the flow, characterized by the onset recirculation zones within the permeation module. This situation affects strongly the performance of the separation module.

Streamlines on the separation module without waterproofing and operating in the (a) laminar flow regime (Re = 1000) and (b) turbulent flow regime (Re = 20,000; cases 2 and 8).
Figure 4 shows the velocity field on the longitudinal plane YZ for the separation module assuming input velocity equals to 0.627 and 12.537 m/s to ensure, respectively, laminar and turbulent flow regimes. Higher velocity gradients have been observed, as expected, in the case where the flow regime is turbulent (Figure 4(b)). Furthermore, it is possible to see recirculation zones in the module base and opposite to the feed stream.

Velocity field in the YZ plane inside the module operating in the (a) laminar and (b) turbulent regimes without waterproofing (cases 2 and 8).
The pressure field analysis was performed in three transverse planes along the separation module (0.02, 0.075, and 0.13 m), as illustrated in Figure 5 for the cases 2 and 8. It can be seen that the increased velocity in the input section provides a pressure increase as shown in Figure 4(a) (0.627 m/s) and (b) (12.537 m/s), providing, respectively, the laminar and turbulent flow regimes. Figure 5(a) and (b) also presents the details of the pressure field on the XY planes in a new color scale. A pressure variation is observed at different planes, which is related to fluid behavior in the separation module. In general, pressure gradients at these planes, but with smaller variations, are observed. Similar behavior was observed by Rahimi et al., 16 Ahmed et al., 17 and Souza. 1

Pressure field in the XY plane at z = 0.02, 0.075, and 0.13 m inside the module operating without waterproofing: (a) laminar regime (Re = 1000) and (b) turbulent regime (Re = 20,000; cases 2 and 8).
Figure 6 shows the concentration field on the YZ longitudinal plane inside the module for the situations presented in Figure 4 (cases 2 and 8). From the analysis of this figure, we can see the influence of the inlet velocity in the oil behavior within the separation module. The results in Figure 6(a) refer to the laminar flow regime. It is possible to see that the highest concentration gradients occur near the membrane surface leading to a concentration polarization, which results in the presence of a resistance to flow through the membrane. In Figure 6(b), we have a turbulent flow regime. From the analysis of this figure, the formation of a polarized layer is not observed. So, the turbulent flow is responsible for the formation of the solute concentration more uniform as compared with that observed in the case where the laminar flow regime was used.

Concentration field in the YZ plane inside the module operating without waterproofing: (a) laminar regime (Re = 1000) and (b) turbulent regime (Re = 20,000; cases 2 and 8).
Hydrodynamic analysis including waterproofing
The separation module operating in turbulent regime provides a more homogeneous concentration distribution within the separation module. This situation may result in penetration of the solute into the membrane due to the direct impact of the fluid on the membrane surface induced by the geometric shape of the input section. Aiming to solve this problem, the region of the membrane where direct impact of the fluid occurs was considered impermeable (waterproofing).
Figure 7 illustrates the streamlines inside the separation modules with and without waterproofing membrane for the case of turbulent flow (cases 1 and 4). The flow lines behavior indicates similar behavior of the fluid within the separation module. However, we can see few differences in the behavior of the flow lines for the case with waterproofing (Figure 7(b)).
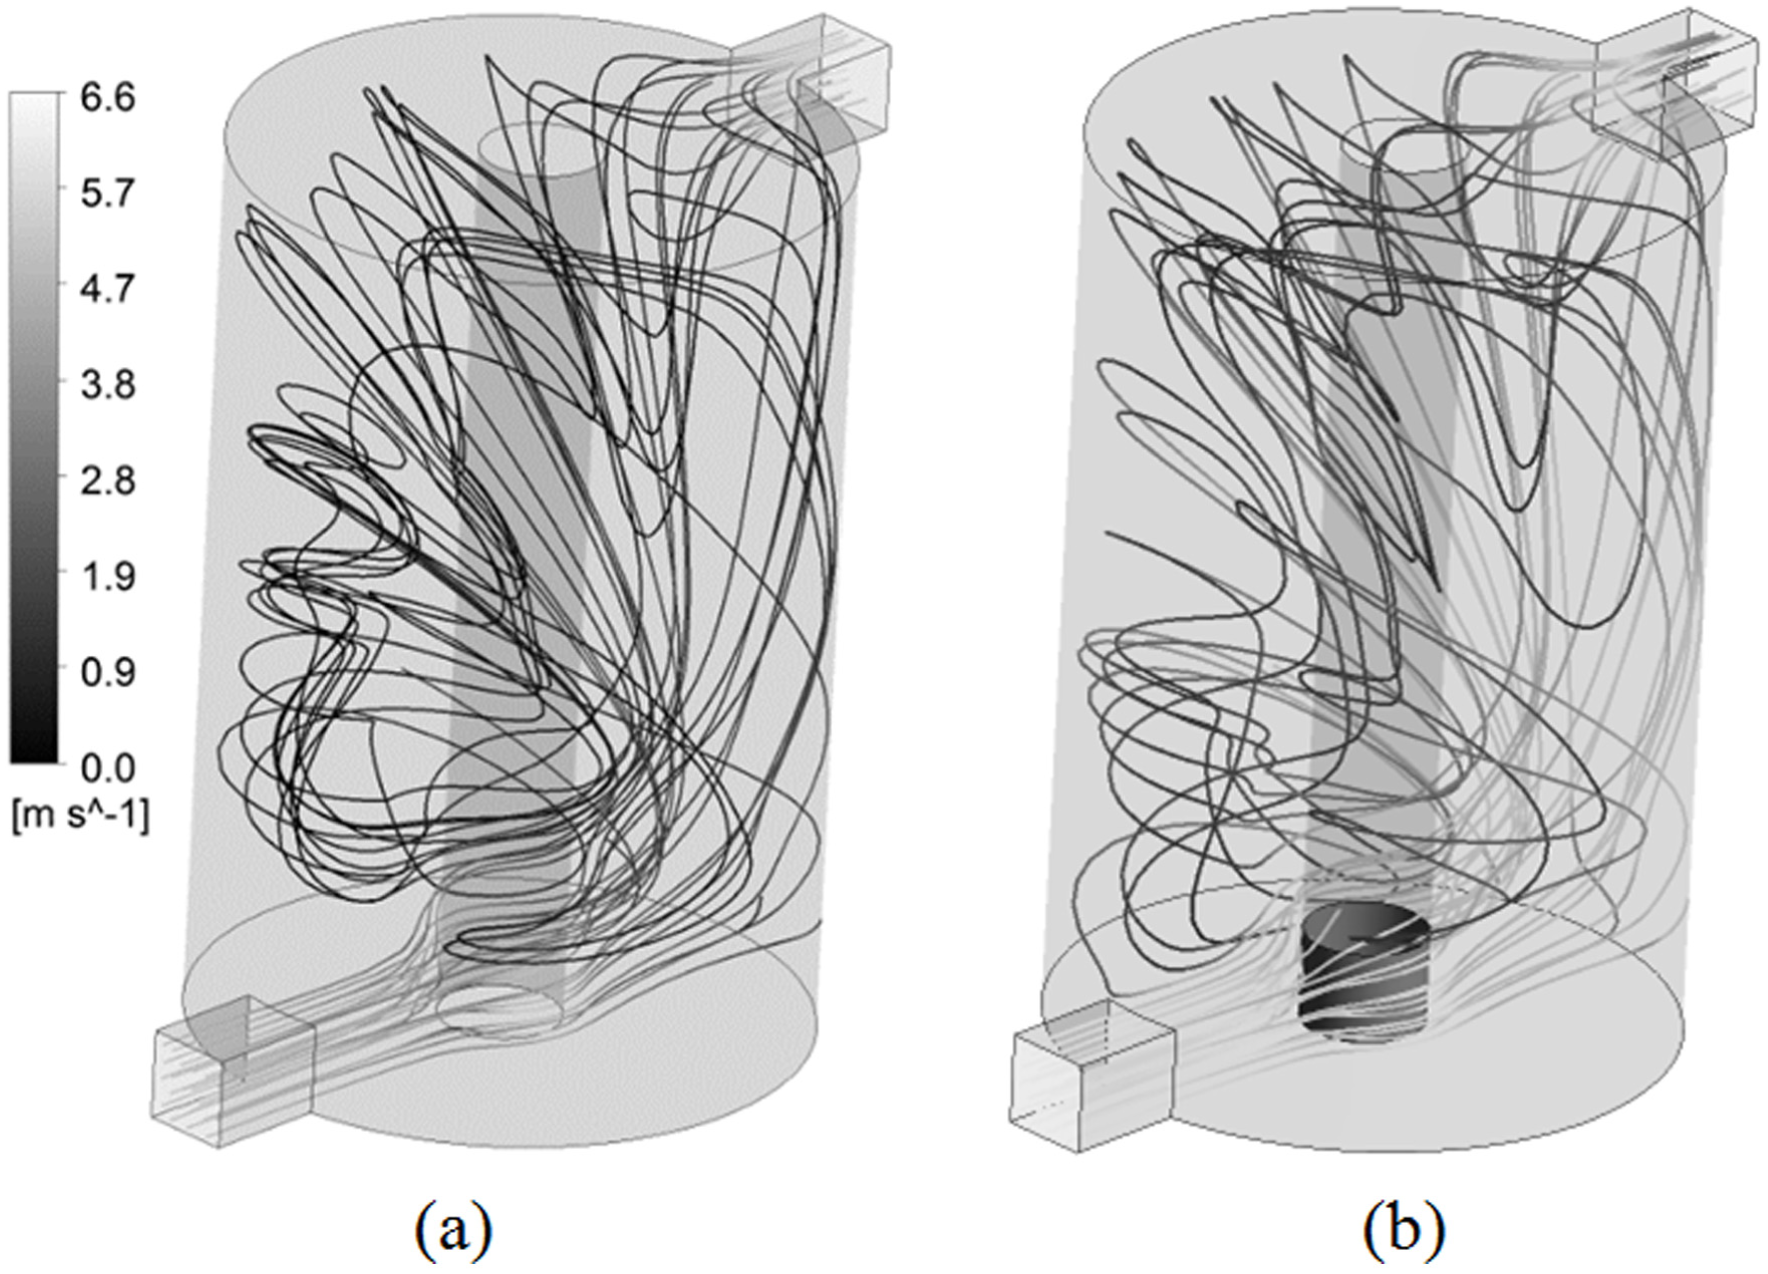
Streamlines on the separation module for the cases (a) without waterproofing and (b) with waterproofing (cases 1 and 4).
The small discrepancy in the flow lines behavior can be verified by analyzing the pressure field on three XY transverse planes (0.02, 0.075, and 0.13 m) shown in Figure 8. We can see the effect of the presence of the waterproof section into the separation module. The results in Figure 8(b) indicate a small difference in pressure distribution on the XY plane, which is expected since this change in the module configuration causes a speed increase in the entry region, as illustrated in Figure 9, provoked for reduced filter area. As a consequence, we have reduction in the filtrate flux and an increase in the internal local pressure in the separation module.

Pressure field inside the separation module at the XY planes (z = 0.02, 0.075, and 0.13 m): (a) module without waterproofing and (b) module with waterproofing.
Figure 9 shows the velocity field on the longitudinal XY plane inside the separation modules with and without waterproofing. From the analysis of Figure 9, we can observe higher velocity gradients in the entrance and exit regions of the module, and that the waterproofing of the fluid impact region does not substantially affect the fluid flow behavior, in view of the low permeability of the ceramic membrane.

Velocity field inside the separation module: (a) without waterproofing and (b) with waterproofing (cases 1 and 4).
This fluid behavior induced by waterproofing of the membrane provides changes in solute concentration distribution inside the separation module. It can be seen analyzing the concentration distribution of oil at the YZ longitudinal plane in the modules with and without waterproofing (Figure 10), for two Reynolds numbers.

Concentration field in the YZ plane: (a) module without waterproofing (Re = 8000) and (b) module without waterproofing (Re = 20,000).
It is noted that the waterproofing leads to greater oil dispersion within the membrane, which can avoid problems of breaking and saturation of the membrane in the section in direct contact with the feed stream, and to reduce the effect of concentration polarization in the membrane surface as compared to the case where separator module is without waterproofing. This effect is more evident increasing feed flow rate, which provides a higher level of turbulence within the separation module. Therefore, we have a more effective module (Figure 10(b)).
Figure 11 illustrates the behavior of the oil concentration in the longitudinal position in different angular positions (0°, 90°, 180°, and 270°) at the surface of the membrane (with and without waterproofing). The concentration distribution of this component is clearly affected by the waterproofing in the separation module placed in the input region for all angular positions.
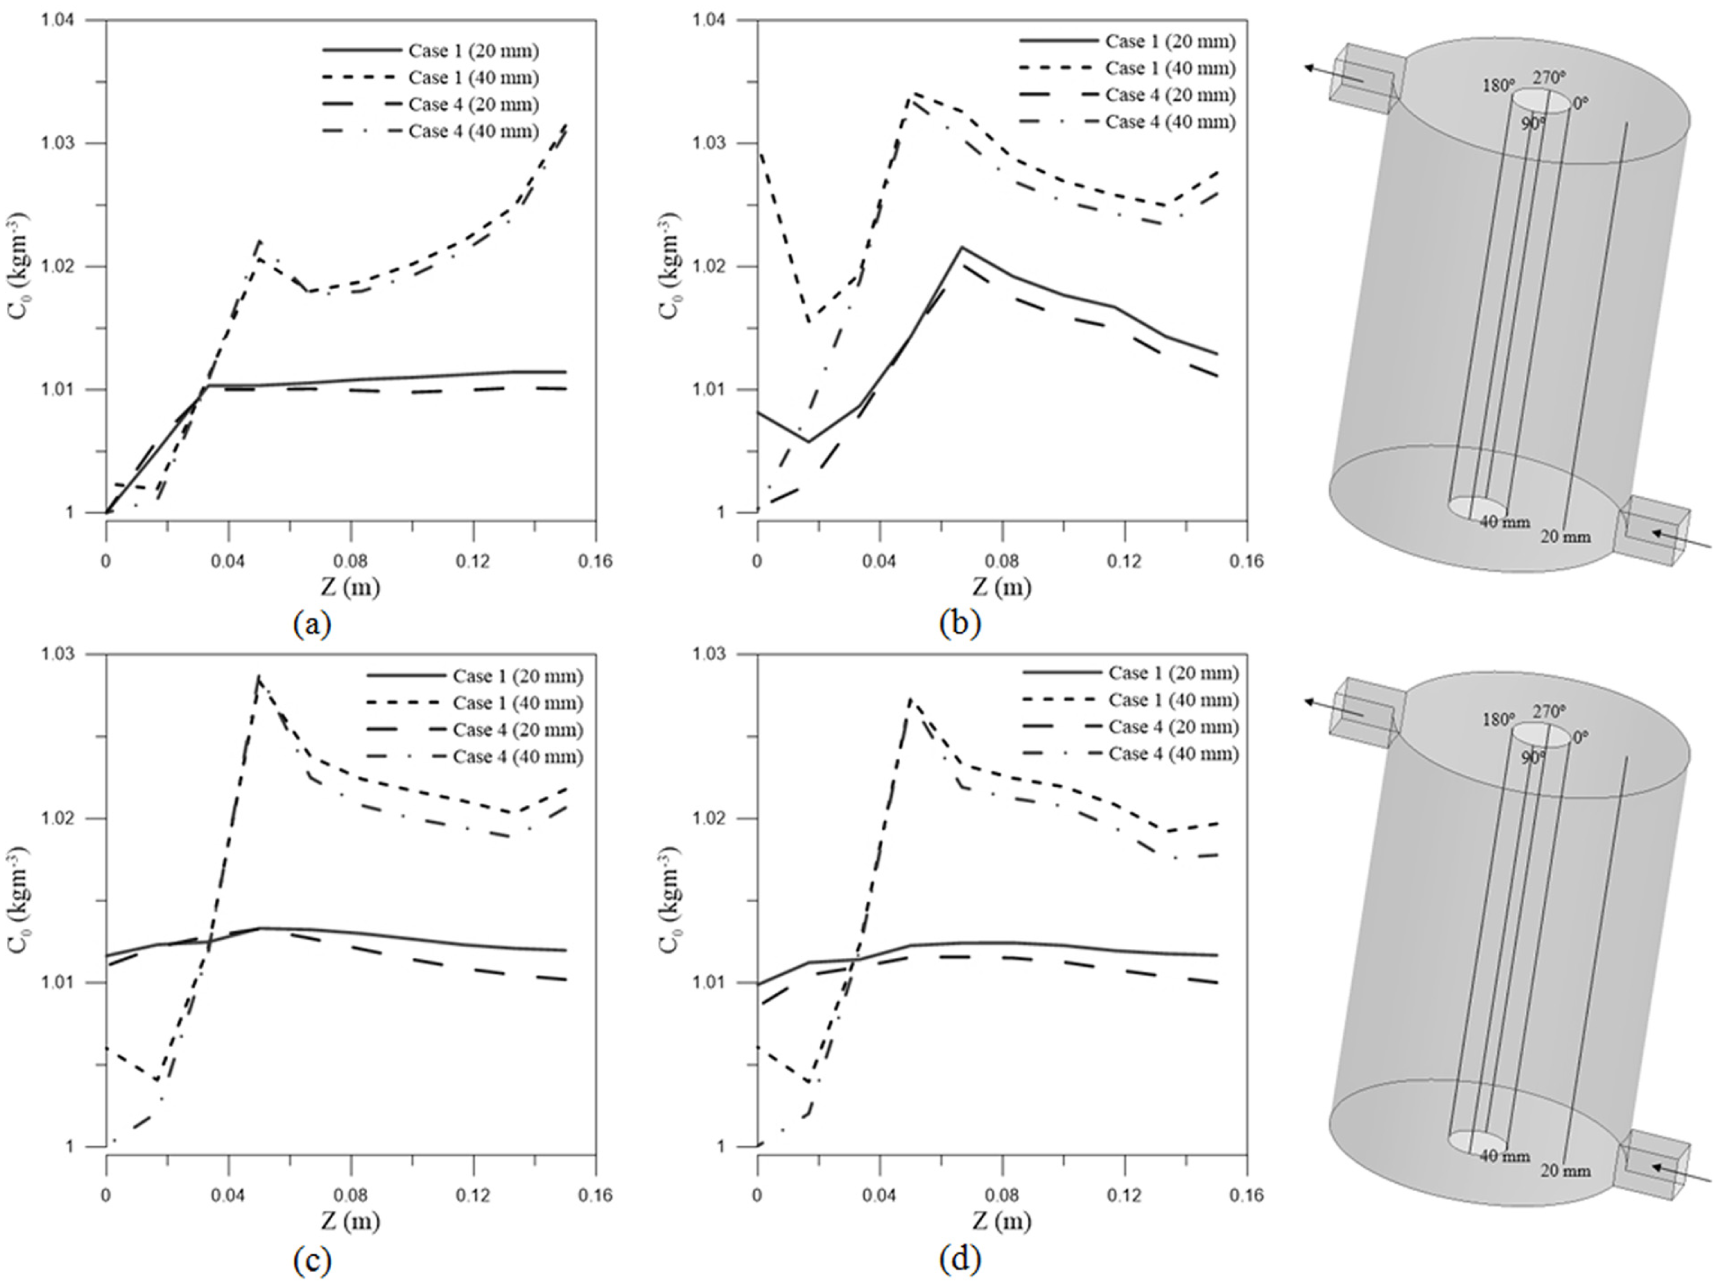
Concentration profile at the angular positions: (a) 0°, (b) 180°, (c) 90°, and (d) 270°. Case 1 corresponds to the separation module without waterproofing and Case 4, the separation module with waterproofing.
Figure 11(a) and (b) shows the concentration profile for cases 1 and 4 in the angular positions 0° and 180°, respectively. We can see that higher concentrations of oil were found when the module contains waterproofing. Figure 11(c) and (d) (angular positions 90° and 270°) illustrates the similar behavior.
Plotting the pressure profiles in the angular positions 0°, 90°, 180°, and 270° along the Z-axis inside the separation module with and without waterproofing, regarding cases 1 and 4 (Figure 12), we can observe pressure variations in the first 0.04 m along the separation module, due to the stagnation pressure in the modules in both physical situations (with and without waterproofing). This fact can be observed in Figure 13, in terms of the velocity vector fields.

Pressure profile at the angular positions: (a) 0°, (b) 180°, (c) 90°, and (d) 270°. Case 1 corresponds to the separation module without waterproofing and case 4, the separation module with waterproofing.

Velocity vector inside the module (Z = 0.00615 m): (a) separation module without waterproofing (case 1) and(b) separation module with waterproofing (case 4).
Figures 14 and 15 show the pressure profile along the membrane surface at the angular positions 0°, 90°, 180°, and 270° for different values of Reynolds number (20,000, 40,000, 60,000, and 80,000) (cases 3, 5, 6, and 7). From the analysis of Figures 14 and 15, higher pressures are observed in the position 0°, due to the perpendicular impact of the feed stream with the membrane. Figure 15 shows the same for the positions 90° and 270°. There is a reduction in pressure at the inlet region (Z < 0.04 m), due to the reduction in the impact force of the fluid.
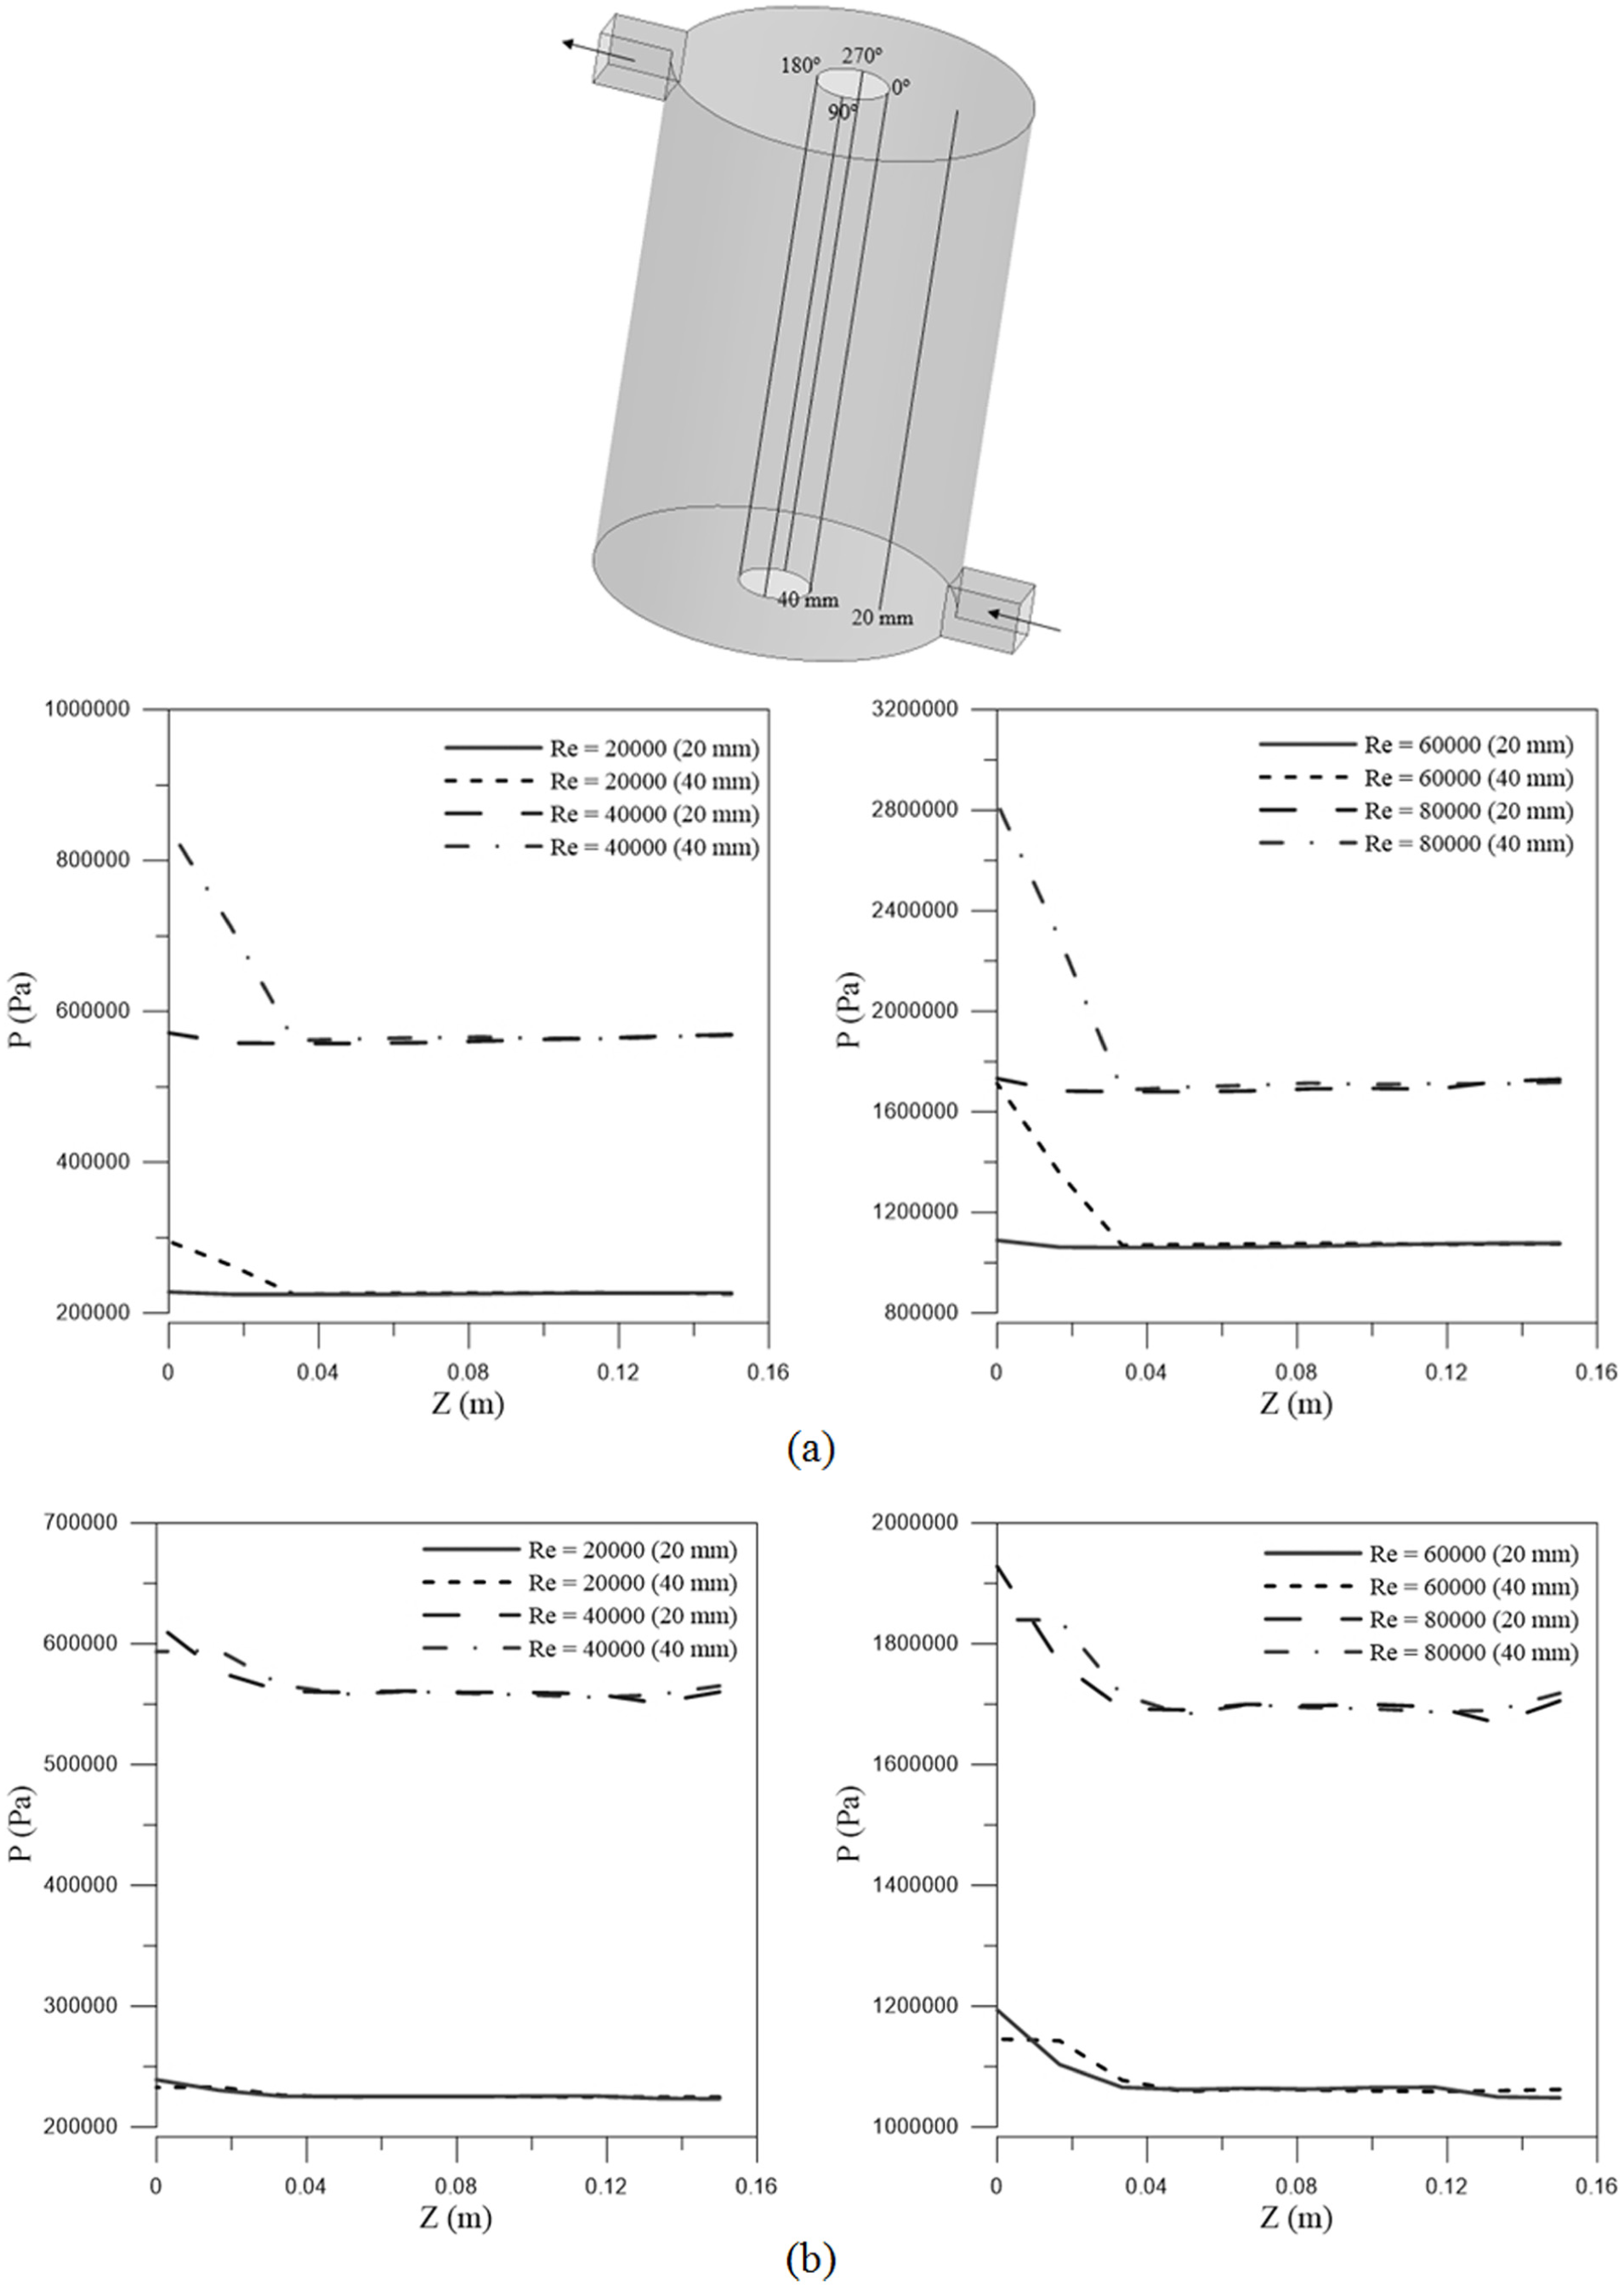
Pressure profile inside the module in the angular positions: (a) 0° and (b) 180° for different Reynolds numbers (cases 3, 5, 6, and 7).
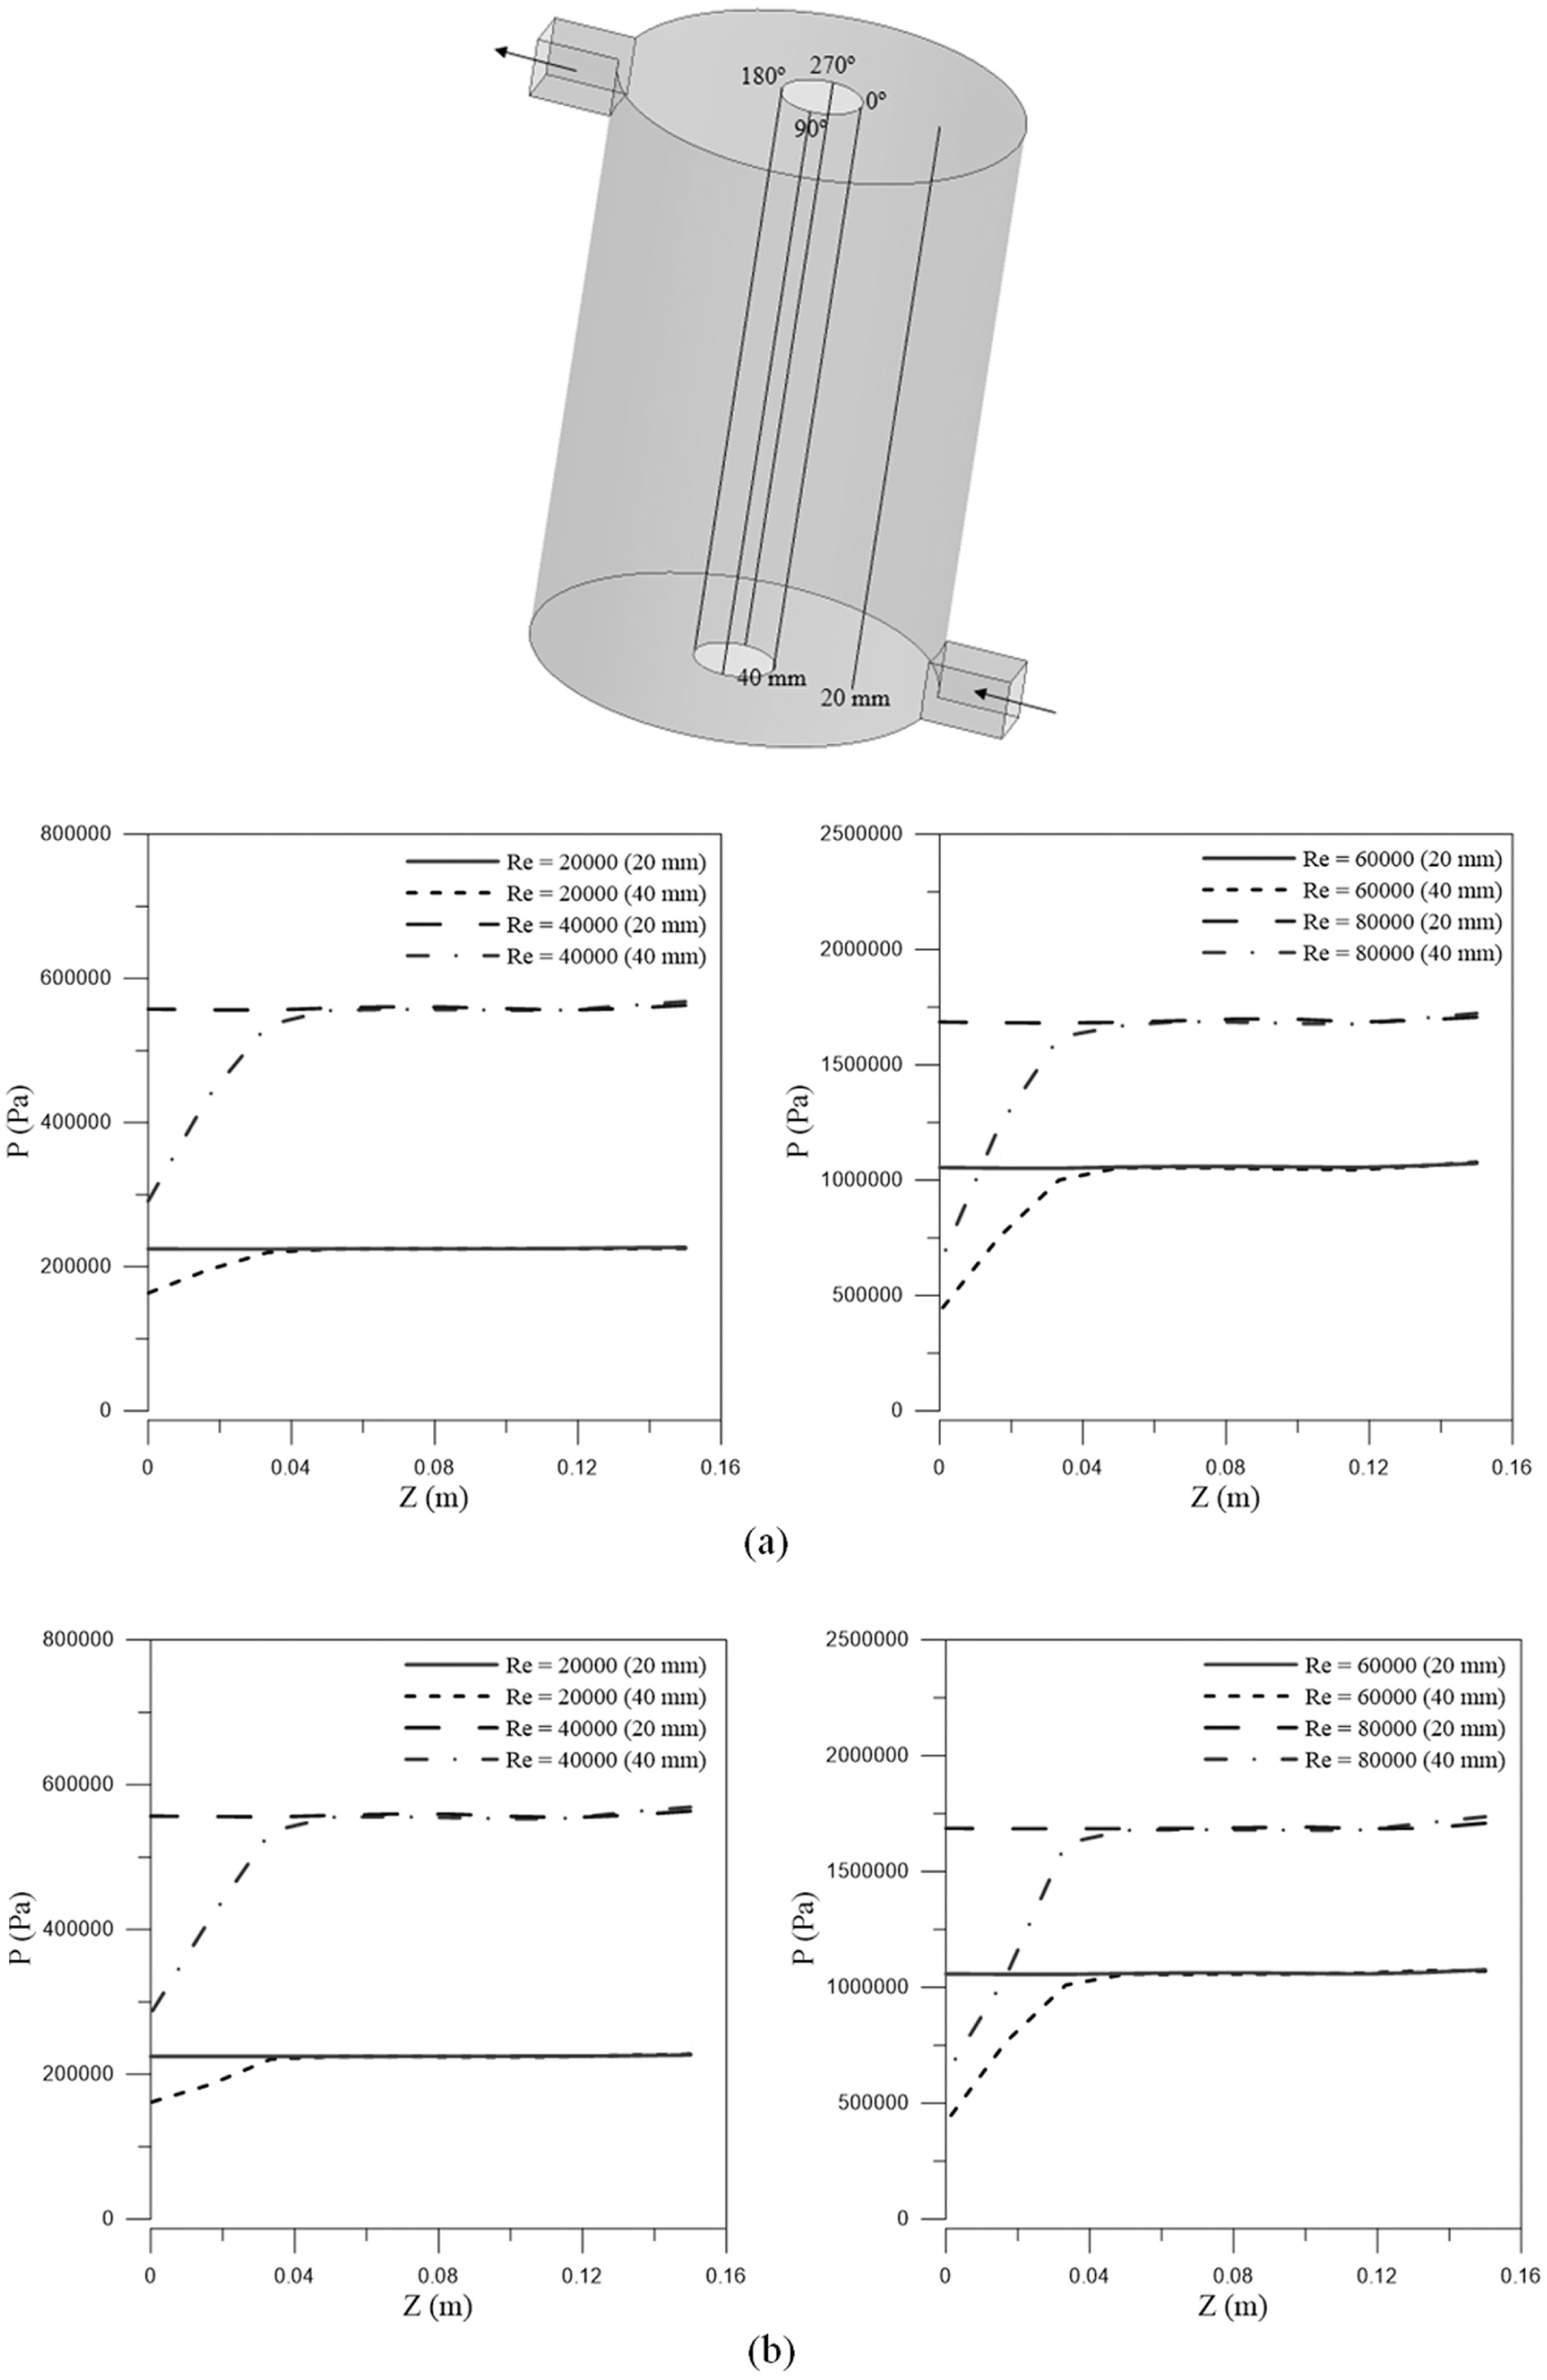
Pressure profile inside the module in the angular positions: (a) 90° and (b) 270° for different Reynolds numbers (cases 3, 5, 6, and 7).
Figures 16 and 17 depict the velocity vector field on the XY transverse plane situated in the inlet region of the separation module for different values of Reynolds numbers (20,000, 40,000, 60,000, and 80,000). We can observe similar behavior of the fluid flow around the membrane, leading to the appearance of recirculation zones and, consequently, increasing pressure inside the separation module, as shown in Figure 14.
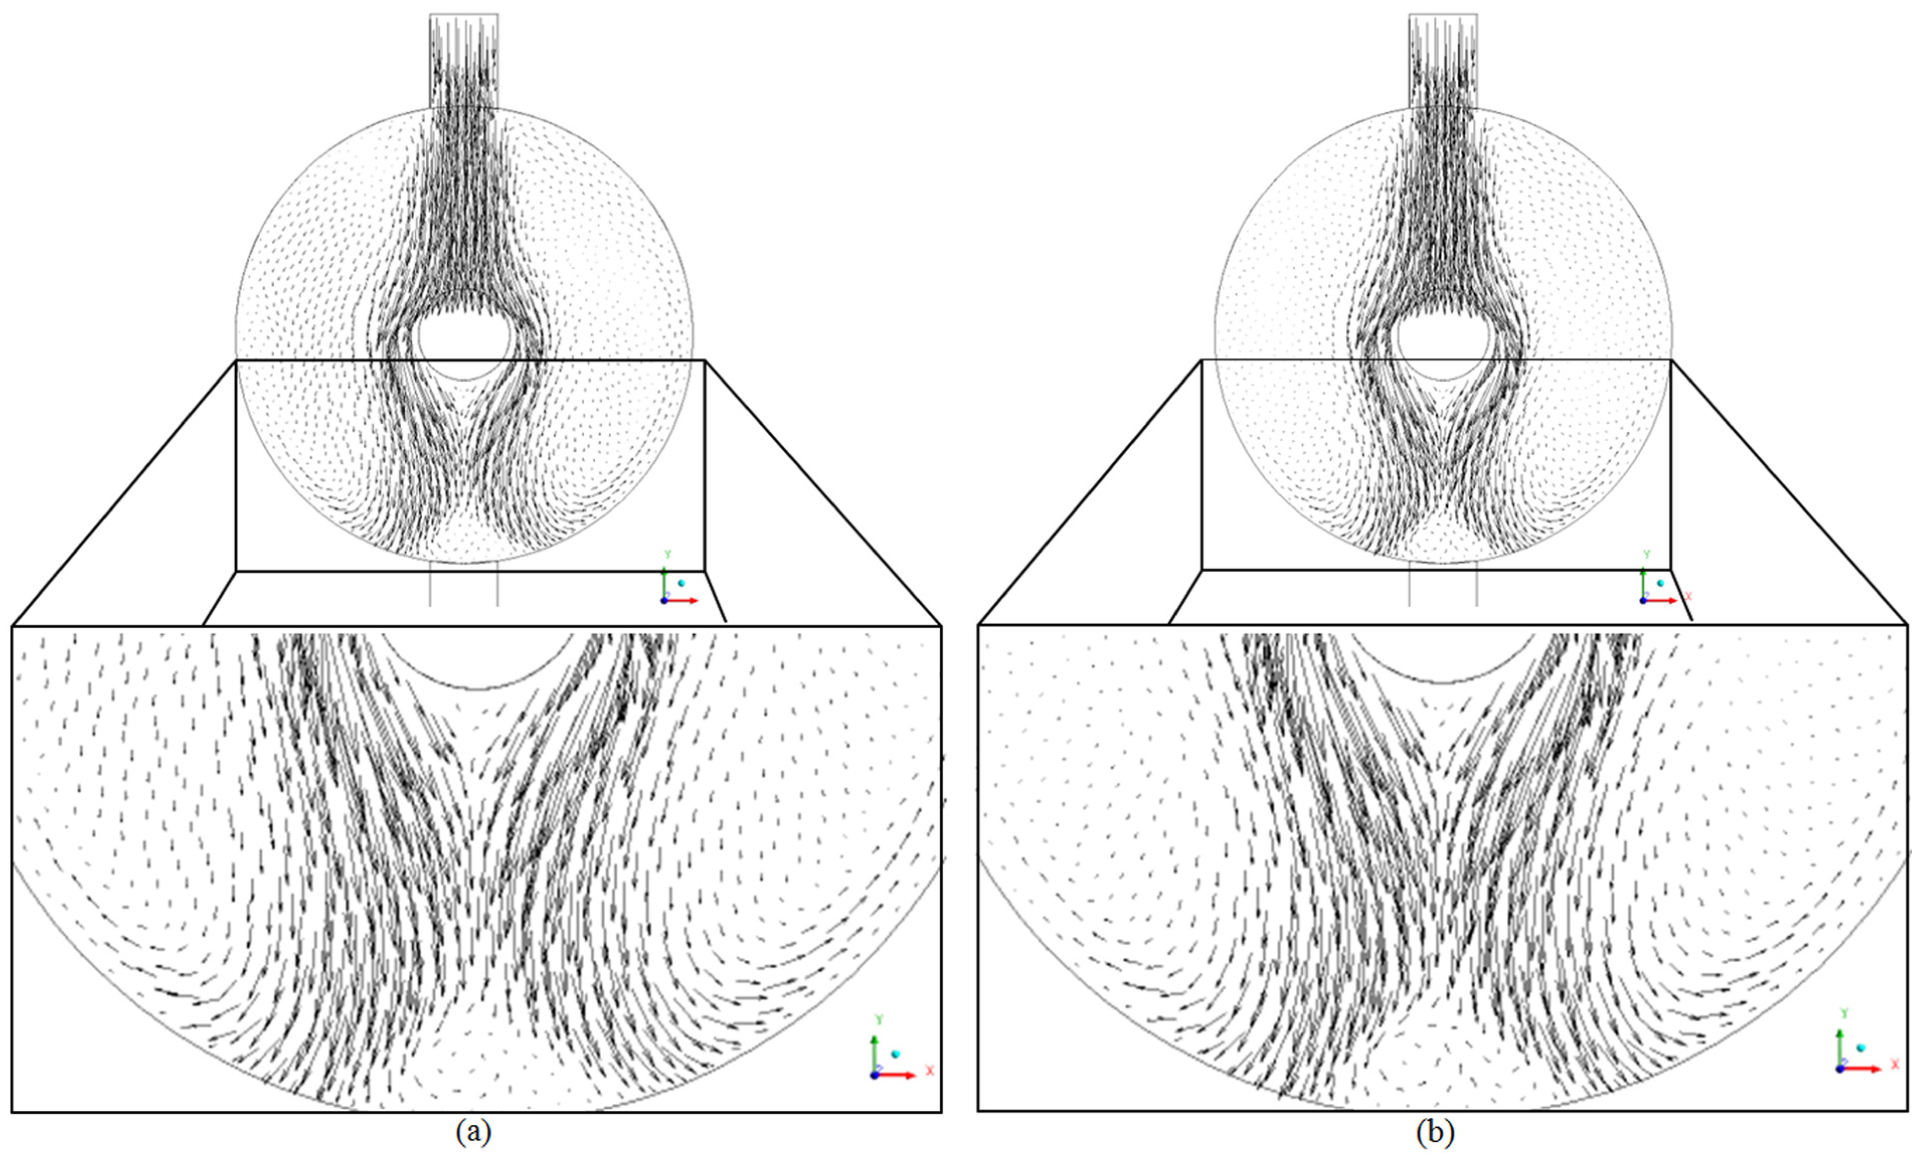
Velocity vector field inside the module: (a) Re = 20,000 and (b) Re = 40,000 (Z = 0.00615 m) (cases 3 and 5).

Velocity vector field inside the module: (a) Re = 60,000 and (b) Re = 80,000 (Z = 0.00615 m) (cases 6 and 7).
Figures 18–21 show the concentration profiles at the angular positions 0°, 90°, 180°, and 270°, respectively, along the separation module for different Reynolds numbers (20,000, 40,000, 60,000, and 80,000) (cases 3, 5, 6, and 7). Comparing Figures 18 and 20 (concentration profile at 0° and 180°), higher concentrations are observed at the angular position 180° because of the flow around the membrane. Figures 19 and 21 refer to the positions 90° and 270°, respectively. From the analysis of these figures, we can see similar results, that is, increased oil concentration with increasing Reynolds number. Ahmed et al. 18 report that increasing the level of turbulence in the fluid mixture can provoke the disruption of the concentration boundary layer and lower deposition of particles at the membrane surface, which increase the shelf life.

Concentration profile inside the module at the angular position 0° for different Reynolds numbers (cases 3, 5, 6, and 7).

Concentration profile inside the module at the angular position 90° for different Reynolds numbers (cases 3, 5, 6, and 7).

Concentration profile inside the module at the angular position 180° for different Reynolds numbers (cases 3, 5, 6, and 7).

Concentration profile inside the module at the angular position 270° for different Reynolds numbers (cases 3, 5, 6, and 7).
Conclusion
In this work, a numerical study about water/oil separation process by ceramic membrane was realized using CFD. Based on the numerical simulation results of the two-phase flow through the module, we can conclude that the mathematical model predicts with good precision the flow behavior inside the separation module and has provided an understanding of the fluid dynamics inside the device.
The flow regime within the separation module affects the fluid dynamic behavior of the water/oil mixture. By increasing the turbulence level within the separation module provides higher solute concentration, thus reducing the polarization layer effect. Furthermore, the impermeable section introduction in the membrane inlet region provides reduction in the permeation area and concentration polarization layer thickness and provokes higher solute concentration within the separation module. Therefore, controlling the flow regime plays important role for a more efficient separation module, where practically there is no accumulation of particle on the liquid–porous media interface, this device being able to be applied in the most varied processes.
Footnotes
Acknowledgements
The authors would like to thank CNPQ, CAPES, FINEP (Brazilian Research Agencies), and Petrobras S/A for the financial support to this research and the authors cited in the text which help in the improvement.
Academic Editor: Kun Huang
Declaration of conflicting interests
The author(s) declared no potential conflicts of interest with respect to the research, authorship, and/or publication of this article.
Funding
The author(s) disclosed receipt of the following financial support for the research, authorship, and/or publication of this article: The author(s) received financial support for the research and publication of this article.