
Abstract
Flexure hinge mechanism plays a key part in realization of terminal nano-positioning. The performance of flexure hinge mechanism is determined by its positioning design. Based on the actual working conditions, its finite element model is built and calculated in ANSYS. Moreover, change trends of deformation and natural frequency with positioning design parameters are revealed. And sensitivity analysis is performed for exploration response to these parameters. These parameters are used to build four objective functions. To solve it conveniently, the multi-objective optimization problem is transferred to the form of single-objective function with constraints. An optimal mechanism is obtained by an optimization method combining ANSYS with MATLAB. Finite element numerical simulation has been carried out to demonstrate the superiority of the optimal flexure hinge mechanism, and the superiority can be further verified by experiment. Measurements and tests have been conducted at varying accelerations, velocities, and displacements, to quantify and characterize the amount of acceleration responses obtained from flexure hinge mechanism before and after optimization. Both time- and frequency-domain analyses of experimental data show that the optimal flexure hinge mechanism has superior effectiveness. It will provide a basic for realizing high acceleration and high precision positioning of macro–micro motion platform.
Keywords
Introduction
Flexure hinge mechanism is generally used to obtain terminal nano-positioning using flexure hinges. 1 With the outstanding features of no friction losses, no backlash, no need for lubrication, ease of fabrication, and virtually no assembly, 2 flexure hinge mechanism can best achieve ultra-positioning in one dimension. Therefore, it could be employed to achieve a variety of application requirements in a variety of fields including microelectronic manufacture, nano-scale science and technology, optical and photon engineering, and so on.3–5
In order to obtain high performance, flexure hinge mechanism is usually studied by building accuracy prediction model and so on. The accuracy error is verified by simulation and experiment. Kang and Gweon presented an analytic model of cartwheel flexure. The model error was <10%, and its prediction accuracy relative to finite element method (FEM) simulations is satisfactory. 6 Long et al. focused on error analysis of stiffness in right-angle flexure hinged double-parallel four-bar mechanism. It is concluded that the length ratio is between 6 and 25, and the thickness is >6 in the design. 7 Li et al. proposed a power-function-shaped flexure hinge. The closed-form compliance equations of the flexure hinge were derived to design the power-function-shaped flexure hinges and could achieve higher motion accuracy than the commonly used circular flexure hinge and V-shaped flexure hinge. 8 Qin et al. established the linear and angular compliance models for a class of statically indeterminate symmetric (SIS) flexure structures. An error model was established and incorporated into the analytical compliance models to function as an error compensator. Utilizing the error compensator, the modeling accuracy of the compliance models could be improved, which was validated by the experimental results on a flexure-based mechanism. 9 Lobontiu formulated a matrix method for modeling the quasi-static response of planar serial flexure hinge mechanisms. The method was illustrated by a displacement–amplification mechanism with right circularly corner-filleted flexure hinges. 10 Chen et al. obtained generalized equations for both the bending and the tension stress concentration factors for two generalized models, the conic model and the elliptic-arc-fillet model. The empirical equations were tractable and easy to be employed in the design and optimization of flexure-based mechanisms. The case studies of the bridge-type displacement amplifiers demonstrated the effectiveness of the generalized equations for predicting the maximum stresses in flexure-based mechanisms. 11 Meng et al. investigated the existing stiffness equations for corner-filleted flexure hinges. A total of three empirical stiffness equations for corner-filleted flexure hinges were formulated based on finite element analysis (FEA) results for the purpose of overcoming these investigated limitations. A total of three comparisons made with the existing compliance/stiffness equations and FEA results indicated that the proposed empirical stiffness equations enlarge the range of rate of thickness to length and ensure the accuracy for each empirical stiffness equation under large deformation. The errors were within 6% when compared to FEA results. 12 Dao and Huang focused on analysis and optimization for a rectangular leaf flexure hinge by employing pseudo-rigid-body model (PRBM) and the principle of virtual work. Multi-objective structural optimization was carried out using the fuzzy logic based on Taguchi method. An input rotational angle was the most significant parameter with contribution of 44.2544%. The fatigue analysis determined that the mechanism could reach approximately 1 million life cycles before failure. 13 This article presents simple yet accurate approximations that capture the effects of load-stiffening and elastokinematic nonlinearities in beams. A general analytical framework is developed that enables a designer to parametrically predict the performance characteristics, such as mobility, over-constraint, stiffness variation, and error motions, of beam-based flexure mechanisms without resorting to tedious numerical or computational methods. 14 This article deals with nonlinear analytical models of a class of compound multi-beam parallelogram mechanisms (CBPMs) along with the static characteristic analysis. It is shown that the analytical primary motion model agrees with both the FEA model and the testing result very well, but the analytical parasitic motion model deviates from the FEA model over the large primary motion/force. 15 In order to accurately model compliant mechanism utilizing plate flexures, this article investigates a quantitative equivalent modulus using nonlinear FEA to reflect coupled factors in affecting the modeling accuracy of two typical distributed compliance mechanisms. It has been shown that all parameters have influences on the equivalent modulus with different degrees, that the presence of large load-stiffening effect makes the equivalent modulus significantly deviate from the planar assumptions in two ideal scenarios, and that a plate modulus assumption is more reasonable for a very large out-of-plane thickness if the beam length is large. 16 Extended nonlinear analytical modeling and analysis of compound parallelogram mechanisms are conducted in this article to consider the effect of the initial internal axial force. A physical preloading system to control the initial internal axial force is presented, and testing results of the object CBPM are compared with the theoretical ones. 17
These researches have more attention on flexure hinge model building and its model error and prediction accuracy analysis. Some designs of flexure hinge have also been proposed and further optimized to obtain a structural optimization design. However, the positioning design of flexure hinge is interestingly investigated and usually ignored in performance of flexure hinge mechanism. This article will concentrate on the positioning design of flexure hinge and optimize the design by an optimization method combining ANSYS and MATLAB. The superior effectiveness of the optimal flexure hinge mechanism is validated by finite element numerical simulation and experiment.
Properties of flexure hinge mechanism
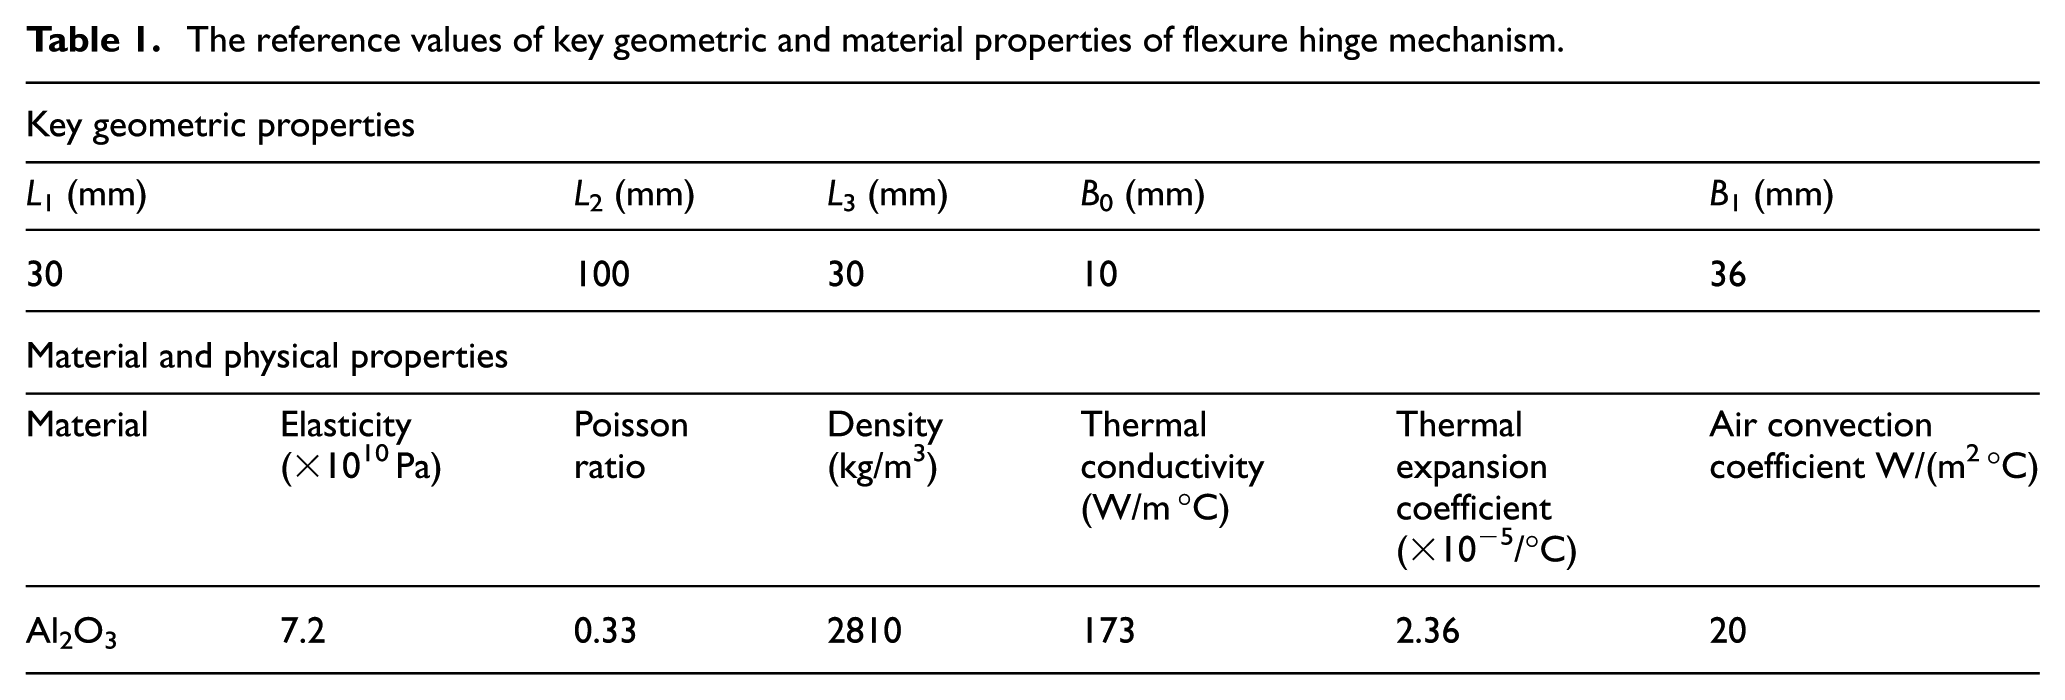
Flexure hinge mechanism plays a key part in realization of terminal nano-positioning at high acceleration in macro–micro motion platform, as shown in Figure 1(a). It determines high acceleration and ultra-precision positioning motion. Therefore, it is of great significance for performance improvement to design the flexure hinge mechanism. In this article, two-axis parallel flexure hinges are proposed in flexure hinge mechanism. They are placed symmetrically with respect to neutral axis of the horizontal beam. The positioning space of flexure hinge is determined by the positioning design parameters, as shown in Figure 1(b). The parameters L1, L2, and L3 pinpoint the location of flexure hinge in the X direction. The location of the flexure hinge in the Y direction is pinpointed by the parameter B1. The related positioning dimensions of flexure hinges are shown in Table 1. The hole distance of a two-axis parallel flexure hinge is 6.5 mm wide and has a hole radius of 3.5 mm. Their thickness is 14 mm. The material of the whole flexure hinge mechanism is duralumin with properties listed in Table 1.

(b) The positioning space of flexure hinge in the (a) macro–micro motion platform.
The reference values of key geometric and material properties of flexure hinge mechanism.
Under the actual working condition, the deformation is produced by driving force and temperature loads affect precision positioning.18,19 Moreover, resonance caused by high acceleration motion must be considered for system stability.19,20 Especially, in the X direction, the natural frequency of flexure hinge mechanism must stay away from driving frequency (<1000 Hz). 3 Therefore, the deformations in mechanical and thermal–structural coupling analysis as well as natural frequency in modal analysis are performed for both static and dynamic load cases.
Mechanical analysis
Flexure hinge mechanism is proposed to achieve the design objective comprising a minimized loss of positioning stroke and retaining stiffness in all directions in the range of operating frequency. It should be considered that flexure hinge mechanism is controlled in a linear motion. However, the Y-axis and Z-axis influences are not subject to active control. Therefore, high stiffness is needed to resist the high acceleration disturbance in these two directions. Additionally, the deformations of X–Z twisting and X–Y torsion are possibly induced. These unknown deformations would reduce the final position precision. 5
Based on the above discussions, static analysis deformation of the whole flexure hinge mechanism is calculated and studied by FEM. The three-dimensional (3D) model of flexure hinge mechanism is built in ANSYS12.1. The element type is SOLID92, and other relevant material properties are shown in Table 1. The boundary condition is shown in Figure 2(a). Finite element model of flexure hinge mechanism was analyzed to obtain the deformations and stress distribution. Their change trends with different loads are also revealed. The results indicate that the maximum deformation is 23 µm, while the housing part does not have significant deformation, as shown in Figure 2(b). Moreover, flexure hinge portion of the mechanism is studied. The stiffness in the X-axis direction is calculated as about 30 N/µm, which means that the motion stroke in the linear-motion direction can be preserved at ∼100 µm. The practical motion stroke relies on the preload and the output force of the piezoelectric stack actuator in operating conditions. The maximum stress is about 46.5 MPa, as shown in Figure 2(c), which is far less than the yield strength of 469 MPa. 21 Therefore, the flexure hinge mechanism is safe and reliable. Under the same condition, the change trends of deformation and stress distribution of flexure hinge mechanism can be obtained by changing the loads. The results show that the maximum deformation and stress increase with the loads, respectively, as shown in Figure 2(d).

Mechanical analysis: (a) boundary condition, (b) deformation distribution, (c) stress distribution, and (d) changing trend of deformation and stress with the temperature.
Thermal–mechanical coupling deformation
Thermal–structural coupling is another important factor to lead to a deformation, when temperature load is applied on flexure hinge mechanism. 19 The temperature comes from transfer of connection frame which is affected by temperature rise of voice coil motor (VCM) in high speed. In this article, the left plane of flexure hinge mechanism is driven by the maximum temperature load T = 40°C and completely constrained, as shown in Figure 3(a). The finite element model was built and meshed free by ANSYS Parametric Design Language (APDL) in ANSYS 12.1. The element type is SOLID87, and other relevant parameters are shown in Table 1.

Thermal–mechanical coupling analysis: (a) boundary condition, (b) deformation distribution, (c) stress distribution, and (d) changing trend of deformation and stress with the temperature.
The deformations and stress distribution of flexure hinge mechanism were obtained by finite element. Their change trends with different loads are also revealed. The results indicate that the maximum thermal–structural coupling deformation is 109 µm which appears on the right-end plane of flexure hinge mechanism, as shown in Figure 3(b). The maximum thermal stress of flexure hinge mechanism is 83.7 MPa which presents on the left-end plane of flexure hinge mechanism, as shown in Figure 3(c). It is far less than the yield strength of 469 MPa. 21 Therefore, the flexure hinge mechanism is safe and reliable. Under the same condition, the change trends of deformation and stress distribution of connection mechanism can be obtained by changing the temperature load. The result is shown in Figure 3(d). It is easy to find that the maximum deformation and stress increase with the loads, respectively.
Modal analysis
Modal analysis of flexure hinge mechanism is further carried out. The natural frequencies and the vibration modes must be considered and controlled to avoid the resonance with the machine body. Table 2 shows the frequencies and vibration model of the first six-order modes. The fifth-order mode is essentially in the linear-motion direction, with a natural frequency at 1452 Hz, as shown in Figure 4. Although the fifth-order natural frequency of flexure hinge mechanism stays away from driving frequency of VCM (<1000 Hz) in the X direction, 3 more higher frequency is beneficial to improve the performance of flexure hinge mechanism.
First six-order modes.


The fifth vibration mode.
Change trends with positioning design parameters
Flexure hinge mechanism determines high acceleration and ultra-precision positioning motion. It is of great significance for performance improvement to design the flexure hinge mechanism. The positioning space of flexure hinge is determined by the positioning design parameters L1, L2, L3, and B1. Based on the finite element model, the influence characteristics of deformation, stress, and natural frequency with these parameters of flexure hinge mechanism were explored. Their change trends are obtained and analyzed. Furthermore, their sensitivity has been calculated for exploration of the model response to these parameters.
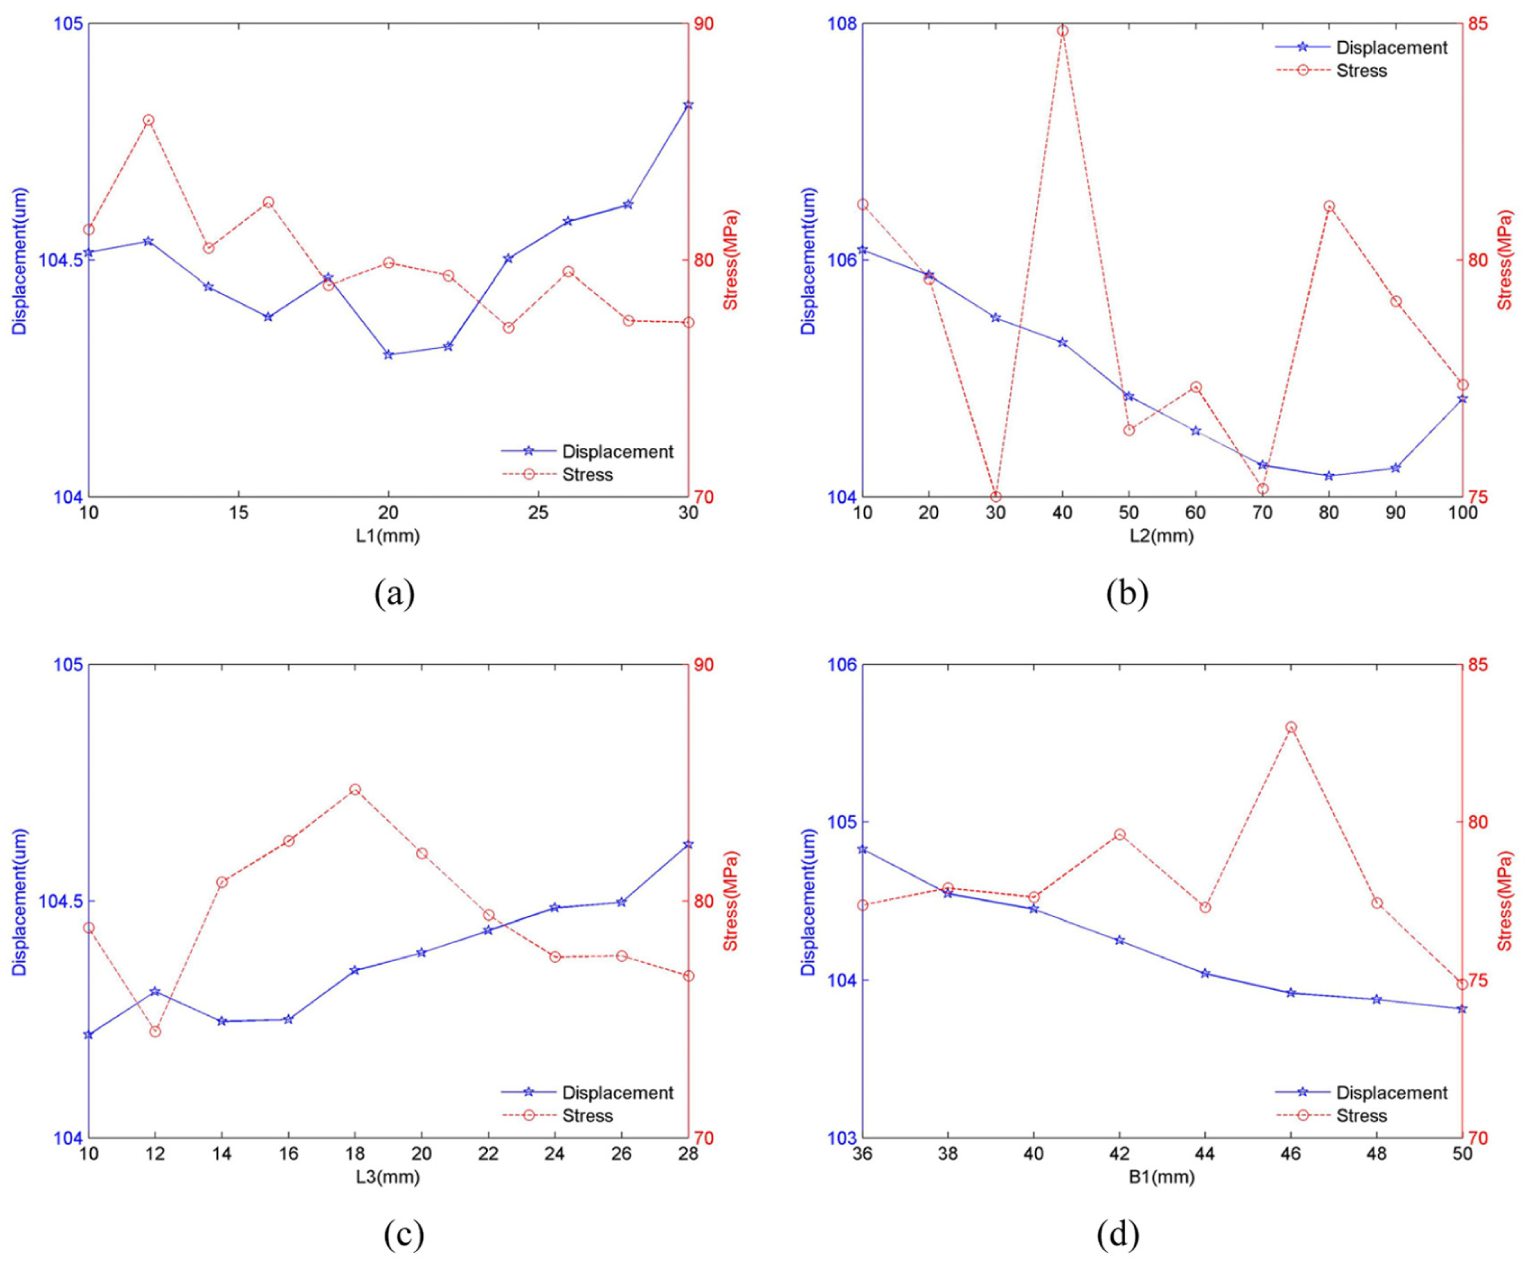
Change trends of deformation, stress, and frequency with positioning design parameters of flexure hinge mechanism can be obtained by calculation of ANSYS as shown in Figure 5. When L1, L2, and L3 increase, their stresses decrease slowly. The decrease in deformation with L3 is more slowly than with L1 and L2, respectively, as shown in Figure 5(a)–(c). The deformation and stress increase with B1, respectively, as shown in Figure 5(d). The thermal–structural coupling deformation decreases with L2 and B1, respectively, as shown in Figure 6(b), and (d). When L1, L2, and L3 increase, their deformations increase as shown in Figure 6(a)–(c). Their stresses change slowly with the decrease in deformation with L1, L2, L3, and B1, respectively, as shown in Figure 6. The frequency decreases with B1, L1, L2, and L3, respectively, as shown in Figure 7. All stresses of flexure hinge mechanism are far less than the yield strength. That is, the flexure hinge mechanism is safe and reliable. In the next section, the stresses will not be studied, and the sensitivity analysis of deformation and natural frequency will be further studied.

Change trend of deformation and stress with (a) L1, (b) L2, (c) L3, and (d) B1.
Change trend of thermal–structural coupling deformation and stress with (a) L1, (b) L2, (c) L3, and (d) B1.

Change trend of frequency with (a) L1, (b) L2, (c) L3, and (d) B1.
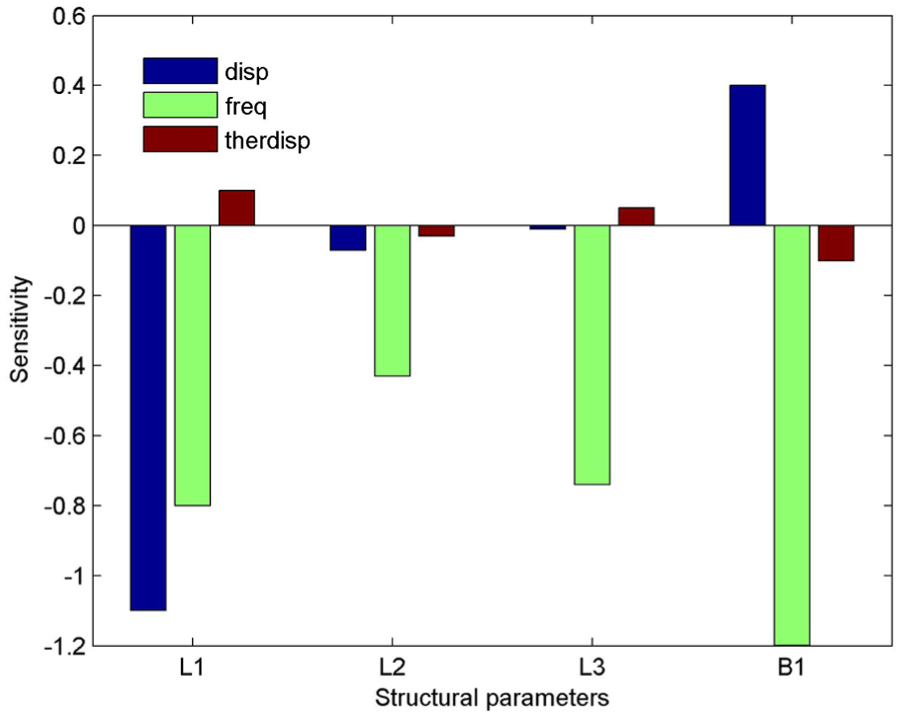
When influence characteristics of deformation and frequency with positioning design parameters of flexure hinge mechanism have been explored, their amount is quantified by sensitivity analysis method. The method makes the finite element program as a black box, and the sensitivity of a parameter can be obtained by twice finite element calculation. 22 Given positioning design parameters, when the parameter changes, deformation and frequency are calculated by ANSYS, and the sensitivity of the parameter can be obtained.
Based on the above sensitivity method, sensitivity of deformation and frequency with positioning parameters are obtained in Figure 8. The result suggests that sensitivities of frequency with L1, L2, L3, and B1 are very high. The sensitivities of mechanical deformation with L1 and B1 are higher than with others. The sensitivities of thermal–structural coupling deformation with positioning parameters are considerately low. Obviously, thermal–structural coupling deformation of flexure hinge mechanism is not affected by the temperature. That is, the positioning precision of flexure hinge mechanism can ignore the effect of the temperature.
Sensitivity analysis.
Optimization
Under the actual working condition, flexure hinge mechanism is subject to high acceleration and high speed. Many factors including driving force, temperature, and natural frequency affect the performance of flexure hinge mechanism. Therefore, it is not sufficient to take only one objective into account. In this article, the above three factors were discussed. In this section, the three objects of a flexure hinge mechanism optimization will be defined.
Objective
Total mass
The lightweight of flexure hinge mechanism is an advantage for the high acceleration implementation. 19 Once there is a given group of positioning design parameters represented by xn, the total mass can be described by the norm of M as follows

The deformation at key point
Node deformation depends on driving force and temperature load. When a group of positioning design parameters is given, by employing finite element model, the flexure hinge mechanism deformation as well as the node deformation can be computed by ANSYS. The deformation includes the minimum and maximum values at the maximum deformation point in mechanical and thermal–structural coupling analysis, respectively. They are defined as criteria for maximum and minimum flexure hinge mechanism deformation which are described by the norm of f1 and f2, respectively, as follows


Natural frequency
Resonance must be avoided for the realization of nano-positioning. Especially, the natural frequency of flexure hinge mechanism must stay away from driving frequency of VCM. When given positioning design parameters are represented, the first six-order frequency can be calculated by ANSYS, and the fifth-order frequency should be as high as possible to avoid the resonance in the X direction. The maximum fifth-order frequency is defined as a criterion by the form of f3 as follows

Based on the above analysis, four objective functions have been obtained. They are functions of positioning design parameters x1, x2,…, xn. Then multi-objective optimization has been established. In order to solve it conveniently, the multi-objective optimization problem is usually transferred to the form of single-objective function with constraints according to Stephen and Lieven. 23 A lightweight flexure hinge mechanism is more important to realize high acceleration. 19 Therefore, the total mass of the flexure hinge mechanism is recognized as the single objective function, and others are defined as constraints.
Based on the above analysis, the optimization model of flexure hinge mechanism is listed as follows

where σmax is the maximum stress and [σ] is allowable stress.
Flexure hinge mechanism is a complex model, and its theoretical model is not easily built. Therefore, finite element model can be employed to solve this problem properly. The functions f1, f2, and f3 can be calculated in ANSYS. However, optimization algorithms in ANSYS have their limitations, for example, local search ability of first order and global search ability of sub-problem is poor. Genetic algorithm (GA), as an intelligent optimization algorithm, has strong global search ability to solve most problems efficiently and accurately with other conventional optimization algorithms.19,24
Based on the above work, an optimal flexure hinge mechanism will be calculated in ANSYS and obtained by GA in MATLAB. The specific optimization process is shown in Figure 9.

Flow diagram of optimization.
The optimization process of MATLAB invoking ANSYS is as follows:
Step 1: determine initial values and their ranges of positioning design parameters of flexure hinges;
Step 2: encode every positioning design parameter;
Step 3: generate a binary random population;
Step 4: select excellent individuals from the binary population;
Step 5: recombine partial chromosome of the individual;
Step 6: variation;
Step 7: decode the new individuals and obtain new positioning design parameters;
Step 8: invoke ANSYS and obtain total mass M;
Step 9: mechanical analysis, thermal–structural coupling analysis, and modal analysis;
Step 10: calculate the maximum deformation f1, minimum thermal–structural coupling deformation f2, and the fifth frequency f3;
Step 11: generate multi-objective function F (f1, f2, f3, M);
Step 12: convert into single-objective function M (f1, f2, f3);
Step 13: find the minimum mass and put it out. If not, return to step 4.
Based on the work done, an optimal flexure hinge mechanism can be obtained. Convergence trend of objective function by GA is shown in Figure 9. The rate and accuracy of convergence have greatly improved by combining ANSYS with MATLAB. The best positioning variables are as follows: L1 is 25 mm, L2 is 73 mm, L3 is 25 mm, and B1 is 40 mm. The mechanical deformation, thermal–structural coupling deformation, and the fifth-order frequency of the optimal flexure hinge mechanism are shown in Figure 10. The mechanical deformation and frequency have been improved by 8.7% and 8.5%, respectively, after optimization. Because of low sensitivity of temperature, the thermal–structural coupling deformation does not change obviously, as shown in Table 3.

Convergence trend of objective function.
Comparison before and after optimization.

Finite element numerical simulation
In order to verify the superior effectiveness, the finite element model of the optimal flexure hinge mechanism was built in ANSYS 12.1 and had been subjected to transient load analysis and frequency response analysis. Acceleration responses were picked up at the appropriate node O, and the left plane of flexure hinge mechanism was constrained in Figure 11. The material of the flexure hinge mechanism is duralumin with properties listed in Table 1. For modeling, 3D SOLID92 element type was used for the flexure hinge mechanism. Analysis was performed for both static and dynamic load cases.

Boundary condition of transient load analysis and frequency response analysis.
Transient response analysis
The flexure hinge mechanism could be driven to obtain high acceleration by VCM. And dynamic analysis of the flexure hinge mechanism model was carried out. For the varying accelerations applied in the flexure hinge mechanism along the X direction, the nodal O response of the flexure hinge mechanism before and after optimization was analyzed. When the flexure hinge mechanism was applied on an acceleration of 1g m/s2, their maximum transient responses are 1.45293 × 10⁻⁵ and 1.31205 × 10⁻⁵ m/s2 as shown in Figure 12(a) and (b), respectively. It can be noted that maximum transient acceleration response is reduced by 9.7% because of optimization.

Transient acceleration response (a) before and (b) after optimization.
Frequency response analysis
In order to characterize the behavior of the optimal flexure hinge mechanism at different frequencies, the flexure hinge mechanism before and after optimization was subjected to frequency response analysis. An input load of 1000 N with frequency varying from 0 to 2500 Hz was applied on plane AB of the flexure hinge mechanism before and after optimization. Acceleration is set to zero. The first peak response occurs at the first mode of 1452 Hz as shown in Figure 13(a) before optimization. The first mode has improved to 1576 Hz because of optimization as shown in Figure 13(b). The higher natural frequency of flexure hinge mechanism in the X direction, the more easily can the flexure hinge mechanism avoid resonance with other bodies.

Frequency response (a) before and (b) after optimization.
The above observations indicate that optimal flexure hinge mechanism has better effectiveness in transient load analysis and frequency response analysis.
Description of experimental setup
In order to verify the superior performance of the optimal flexure hinge mechanism, the prototypes of flexure hinge mechanism before and after optimization were manufactured and installed in macro–micro motion platform to, respectively, perform tests as shown in Figure 14. Flexure hinge mechanism is driven by VCM in macro–micro motion platform. Data acquisition system is used to collect and analyze data.

Illustration of the flexure hinge mechanism measurement system.
Acceleration response in varying accelerations
In order to measure the acceleration response, the above setup was instrumented with acceleration sensor at the test point as shown in Figure 15. Time-domain data in a displacement of 5 mm at speed of 0.1 m/s were recorded. These data were processed by MATLAB to obtain frequency domain and time domain consistently with varying accelerations. The frequency responses of different acceleration plots of flexure hinge mechanism before and after optimization measured are shown in Figure 16(a) and (b), respectively. The time domain of flexure hinge mechanism before and after optimization at the acceleration of 2g m/s2 (g = 9.8) has been obtained in Figure 19(a) and (b), respectively.

Illustration of the measurement.

Acceleration frequency response (a) before and (b) after optimization in varying accelerations.
Acceleration response in varying velocities
In the same condition of section “Acceleration response in varying accelerations,” the acceleration responses in varying velocities were measured. During the displacement of 10 mm at the acceleration of 1g m/s2, the frequency responses of different velocities plots of flexure hinge mechanism before and after optimization are shown in Figure 17(a) and (b), respectively. The time domain of flexure hinge mechanism before and after optimization at the velocity of 0.4 m/s has been given in Figure 20(a) and (b), respectively.
Acceleration frequency response (a) before and (b) after optimization in varying velocities.
Acceleration response in varying displacements
The acceleration responses in varying displacements were also measured under the same condition of section “Acceleration response in varying accelerations.” During the speed of 0.1 m/s at the acceleration of 1g m/s2, the frequency responses of different displacement plots of flexure hinge mechanism before and after optimization measured are shown in Figure 18(a) and (b), respectively. The time domain of flexure hinge mechanism before and after optimization at the displacement of 10 mm has been obtained in Figure 21(a) and (b), respectively.

Acceleration frequency response (a) before and (b) after optimization in varying displacements.
Results and analysis
The data of acceleration responses in varying accelerations are obtained by the above experiment. The test results of flexure hinge mechanism before and after optimization are analyzed both in frequency domain and in time domain in the following.
Frequency-domain results
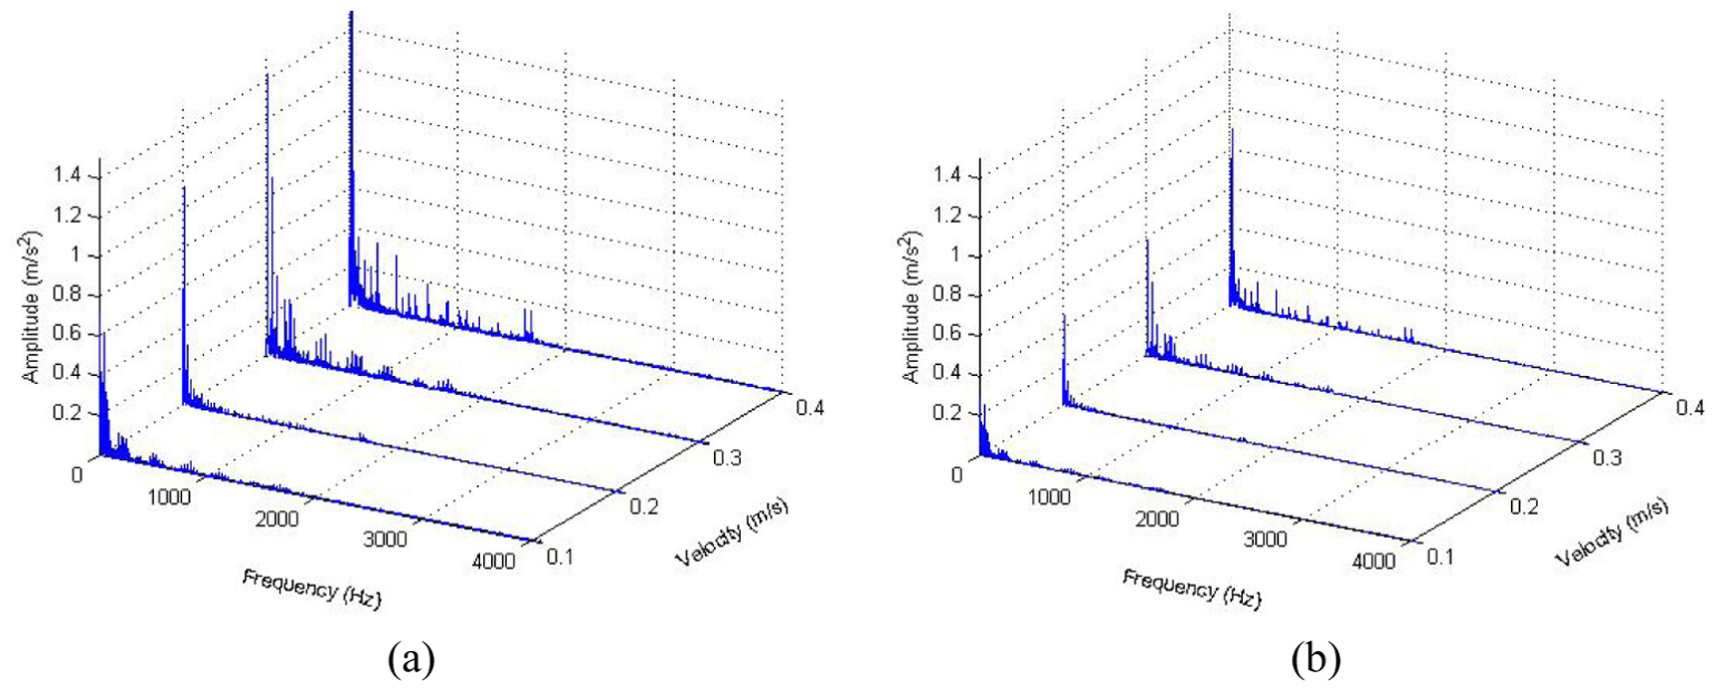
In order to best visualize the frequency content of flexure hinge mechanism before and after optimization, the time histories would be transformed to frequency response to create a 3D plot, as shown in Figure 16. The varying accelerations are plotted along the x-axis. The frequency of the signals and the amplitude of acceleration are plotted along the y-axis and z-axis, respectively. A slice of y–z plane of 3D plot is recognized as results at a single acceleration. 25 In this form, it is easy to uncover the identification of disturbance trends across both frequency and acceleration through plotting the data. The frequency-domain results of flexure hinge mechanism before and after optimization are compared, and the results are discussed in detail in the following.
3D plots corresponding to varying accelerations are shown in Figure 16. Figure 16(a) and (b) depicts the frequency response of acceleration of flexure hinge mechanism before and after optimization, respectively. It is observed that the plots of flexure hinge mechanism before optimization in Figure 16(a) are plotted in the scale of 1 m/s2. The plots appear a bit concentration populated with some peaks of low, medium, and high magnitudes below the frequency of 2000 Hz. Under the same scale, the response of acceleration of flexure hinge mechanism after optimization is plotted. It could be found that the magnitude of response corresponding to different frequencies and accelerations presents a considerable reduction as shown in Figure 16(b). In order to further obtain what each of the medium and high peaks has in terms of their magnitude, frequencies, and accelerations, some plots are accomplished in different appropriate scales to adapt these peaks of flexure hinge mechanism before and after optimization. The magnitude and frequencies corresponding to varying accelerations in Figure 16 are listed in Table 4. The results show that the frequencies of these dominant peaks are directly dependent on the acceleration, when the acceleration of flexure hinge mechanism increases along the frequency axis. These peak disturbances are the flexure hinge mechanism harmonics occurring at the same frequency and are caused by instability of two-axis parallel flexure hinges due to manufacturing errors.
Acceleration responses of different accelerations.

Bold values significance that they are the maximum responses in different accelerations.
In the acceleration response listed in Table 4, the second column shows the frequencies, while the third and fourth columns list acceleration responses of flexure hinge mechanism before and after optimization, respectively. The response values of flexure hinge mechanism before optimization obtained against 21, 27, 30, 31, and 33 Hz are the peak values in the respective acceleration of 0.4g, 0.8g, 1.2g, 1.6g, and 2g m/s2, respectively, and are shown in the third column. The largest acceleration response value is 1.16 and is seen at 0.8g m/s2, indicating that this could be made by instability of two-axis parallel flexure hinges due to manufacturing errors. Similarly, the fourth column of Table 4 is observed that there is a reduction in amplification for all accelerations. For the acceleration response of velocity listed in Table 5, the largest acceleration response occurs at 0.4 m/s at 33 Hz with a peak acceleration response value of 2.177 m/s2. Similarly, the fourth column shows that there is a reduction in amplification for all frequencies.
Acceleration responses of different velocities.
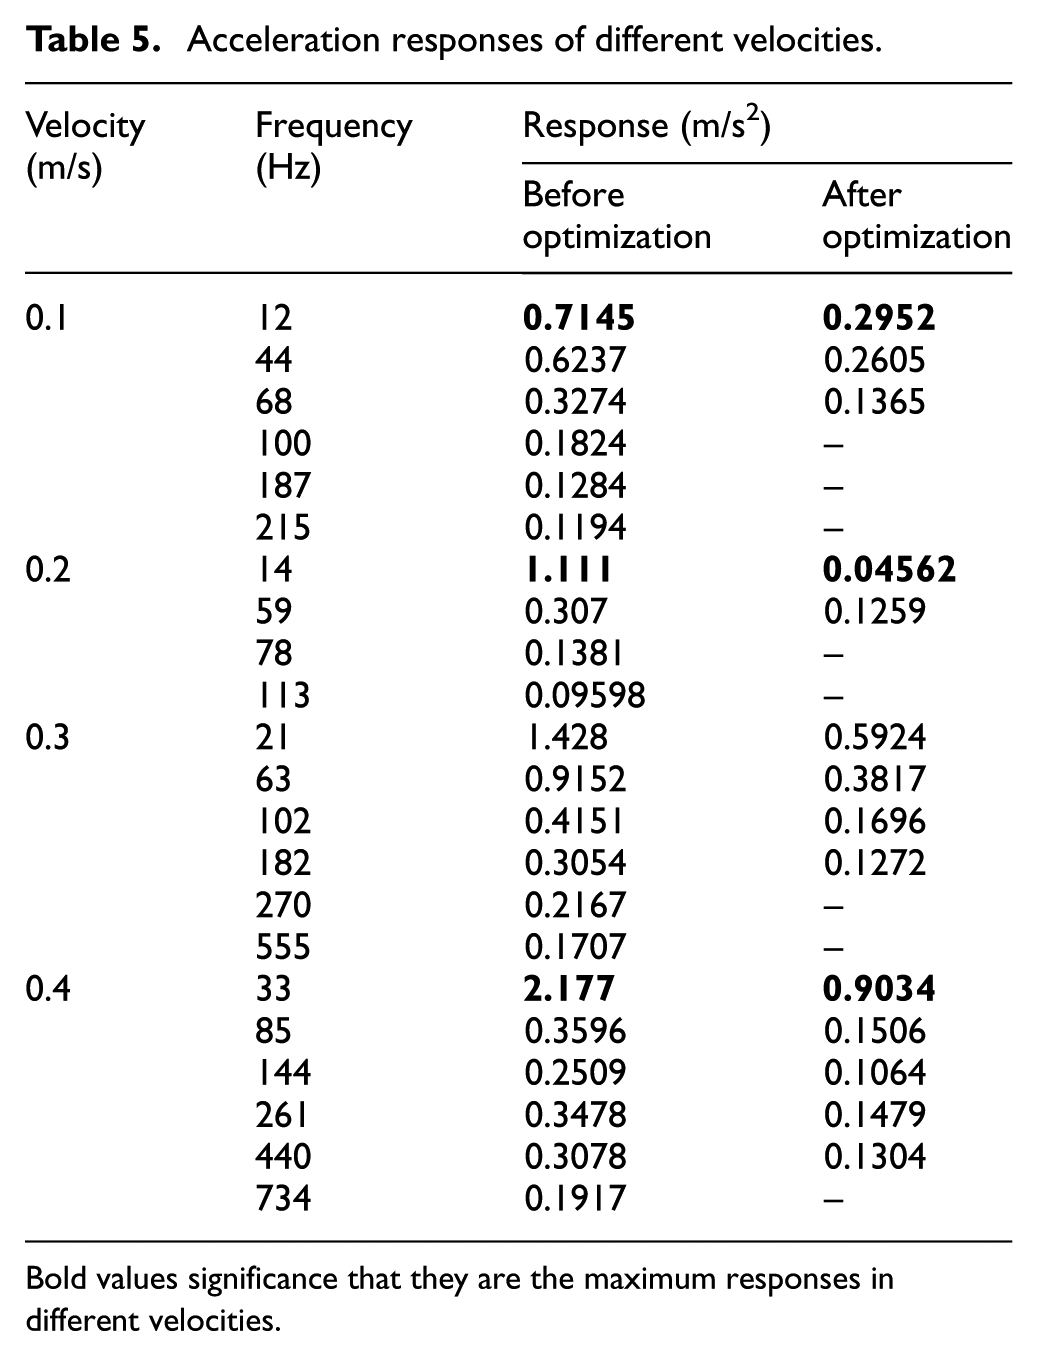
Bold values significance that they are the maximum responses in different velocities.
It is found that acceleration response data of accelerations and velocities are not exactly the same but have small differences. The analysis of acceleration response data of different displacements listed in Table 6 shows that the acceleration response peak is found to be 1.113 m/s2, and this is reduced to a very low value of 0.4737 m/s2. All other acceleration response data for all displacements can be seen to be significantly reduced.
Acceleration responses of different displacements.
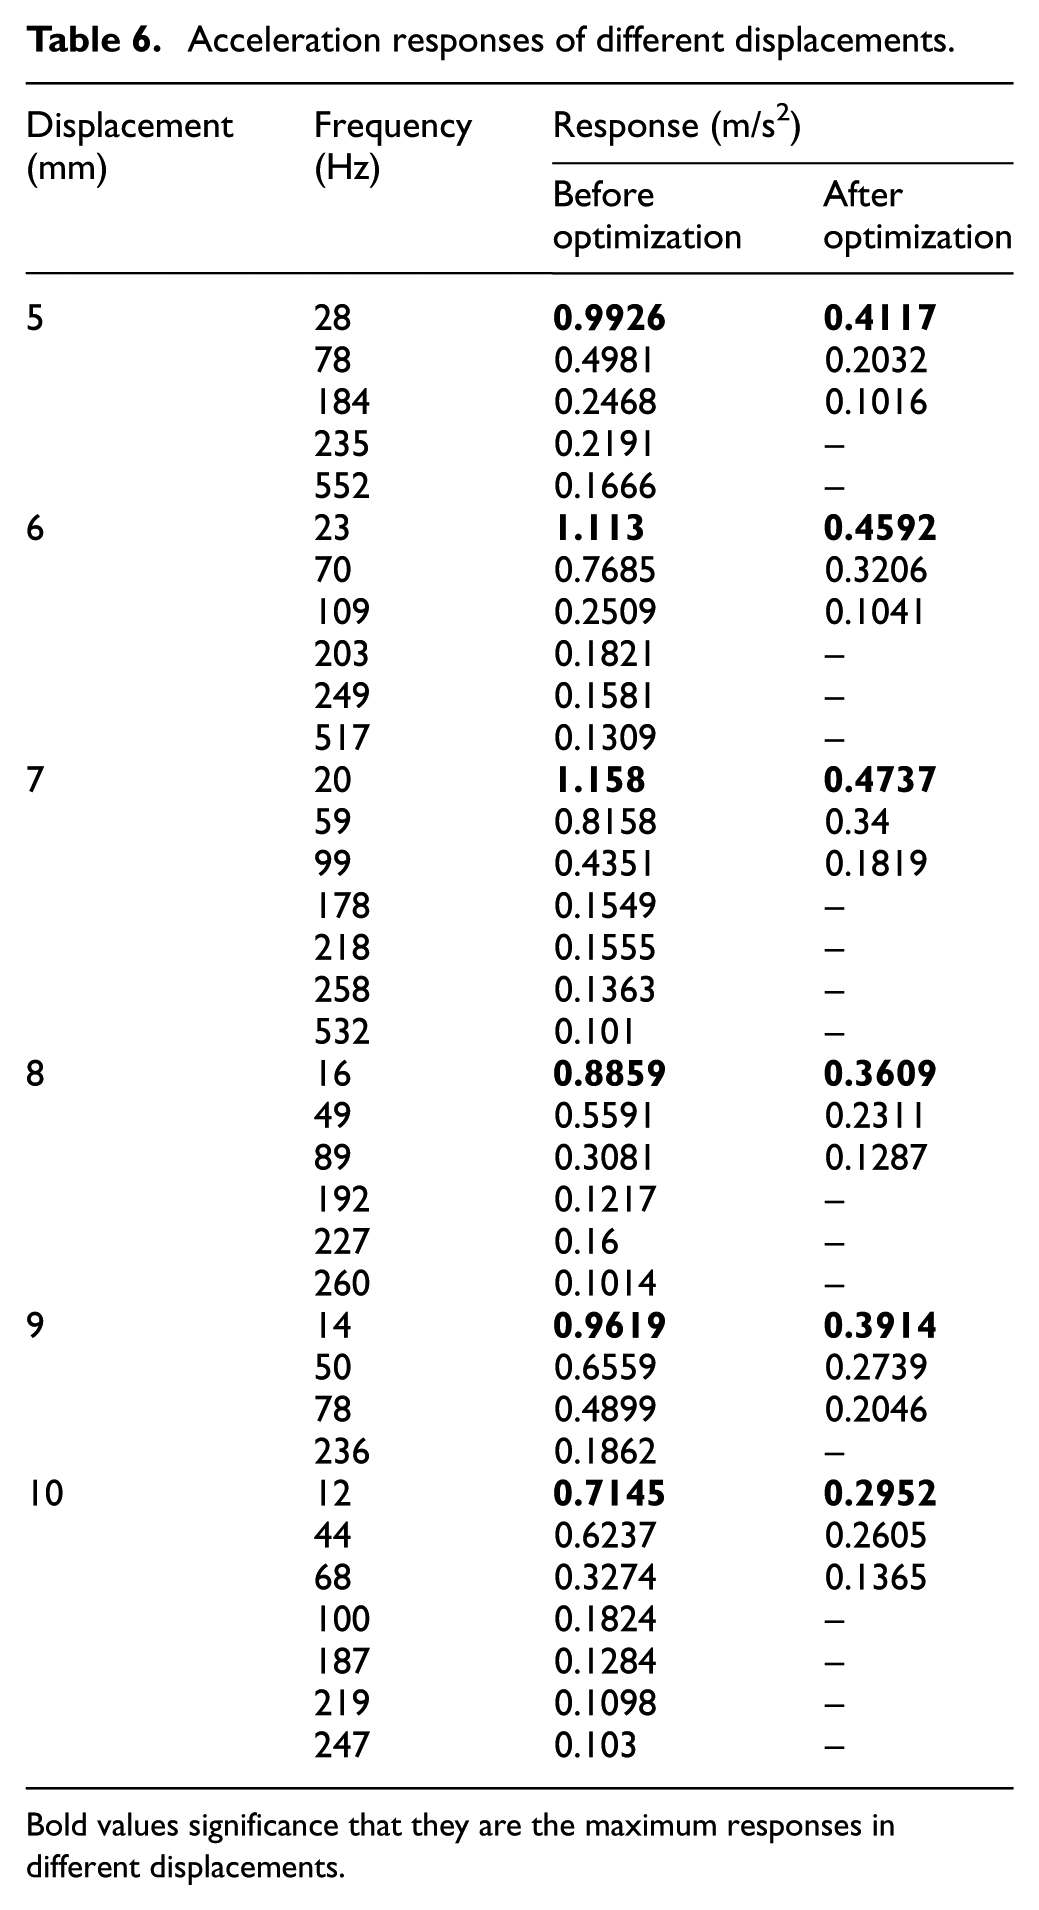
Bold values significance that they are the maximum responses in different displacements.
Time-domain results
The acceleration responses of flexure hinge mechanism before and after optimization were measured at different accelerations, velocities, and displacements, as shown in Figures 16–18. All responses were measured and recorded. To further demonstrate the reduction in response of the optimal flexure hinge mechanism, the acceleration time responses were studied. Figure 19(a) and (b) shows the acceleration time plots of flexure hinge mechanism before and after optimization at 2g m/s2. Figure 20(a) and (b) shows the acceleration time plots of flexure hinge mechanism before and after optimization at 0.4 m/s. Figure 21(a) and (b) shows the acceleration time plots of flexure hinge mechanism before and after optimization. It is observed that there is a considerable reduction of response amplitude across the optimal flexure hinge mechanism for accelerations, velocities, and displacements. The peak acceleration values of the response of flexure hinge mechanism before and after optimization are listed in Table 7. With the optimal flexure hinge mechanism, in acceleration of 2g m/s2, the acceleration response has been decreased by 56.7%. In the velocity of 0.4 m/s and displacement of 10 mm, it is 65.9% and 69%, respectively.

Acceleration time response (a) before and (b) after optimization in the acceleration of 2g m/s2.

Acceleration time response (a) before and (b) after optimization in the velocity of 0.3 m/s.

Acceleration time response (a) before and (b) after optimization in the displacement of 10 mm.
Peak responses of acceleration, velocity, and displacement.

Conclusion
In this article, multi-objective positioning design optimization of flexure hinge considering deformation and natural frequency has been studied. Results show that (1) change trends of deformation and natural frequency with positioning design parameters are revealed. When L1, L2, and L3 increase, their stresses decrease slowly. The decrease of deformation with L3 is more slowly than with L1 and L2, respectively. The deformation and stress increase with B1, respectively. The frequency decreases with B0, B1, L1, L2, and L3, respectively. The thermal–structural coupling deformation decreases with L2 and B1, respectively. When L1, L3, and L3 increase, their deformations increase. Their stresses change slowly with the decrease in deformation with L1, L2, L3, and B1, respectively. (2) The sensitivities of deformation with L1 and B1 are higher than with others. The sensitivities of thermal–structural coupling deformation with positioning design parameters are considerately low. This means that the positioning precision of flexure hinge mechanism can ignore the effect of the temperature. (3) An optimal flexure hinge mechanism is calculated in ANSYS and obtained by GA in MATLAB. Finite element numerical simulation has been carried out to demonstrate the superiority of the optimal flexure hinge mechanism, and the superiority can be further verified by experiment. Measurements and tests have been conducted at varying accelerations, velocities, and displacements, to quantify and characterize the amount of acceleration responses obtained from flexure hinge mechanism before and after optimization. Both time- and frequency-domain analyses of experimental data show that the optimal flexure hinge mechanism has superior effectiveness in application of macro–micro motion platform. It will provide a basic for realizing high acceleration and high precision positioning of macro–micro motion platform.
Footnotes
Academic Editor: Xichun Luo
Declaration of conflicting interests
The author(s) declared no potential conflicts of interest with respect to the research, authorship, and/or publication of this article.
Funding
The author(s) disclosed receipt of the following financial support for the research, authorship, and/or publication of this article: This work was supported by the Key Joint Project of National Natural Science Foundation of China (U1134004) and Henan Province Department Education Project (17A460008).