
Abstract
Long-span bridges suffer from higher traffic loads and the simultaneous presence of multiple vehicles, which in conjunction with the steady traffic growth may pose a threat to the bridge safety. This study presents a methodology for first-passage probability evaluation of long-span bridges subject to stochastic heavy traffic loading. Initially, the stochastic heavy traffic loading was simulated based on long-term weigh-in-motion measurements of a highway bridge in China. A computational framework was presented integrating Rice’s level-crossing theory and the first-passage criterion. The effectiveness of the computational framework was demonstrated through a case study of a cable-stayed bridge. Numerical results show that the upper tail fitting of the up-crossing rate is an appropriate description of probability characteristics of the extreme traffic load effects of long-span bridges. The average daily truck traffic growth increases the probability of exceedance due to an intensive heavy traffic flow and results in a higher first-passage probability, but this increased trend is weakening as the continuous increase of the traffic volume. Since the sustained growth of gross vehicle weight has a constant impact on the probability of failure, setting a reasonable threshold overload ratio is an effective scheme as a traffic management to ensure the bridge serviceability.
Introduction
The rapid growth of global economy has posed a steady traffic growth in both the volume and the gross vehicle weight (GVW) over recent decades. Truck overloading has become the main reason of shortening the service life or even collapses of existing bridges. 1 In comparison to short- and medium-span bridges, long-span bridges suffer from higher traffic loads and the simultaneous presence of multiple vehicles. 2 In addition to the heavy traffic load, the steady traffic growth may pose an additional threat to the safety and serviceability of long-span bridges. In general, a native design specification of traffic loading has taken into account the probabilistic extrapolation of traffic loading as well as the simultaneous presence of multiple vehicles. In addition, the existing bridges were designed with consideration of the uncertainties of the traffic load and system reliability.3,4 However, the continuous traffic growth and extremely overloaded trucks have changed the probability characteristics of the traffic loading. 5 Such changes have been demonstrated to result in a larger load effect compared to the national design specifications. Han et al. 6 showed that several extremely overloaded trucks in China yielded larger hogging moment of the bridge girder than the one computed according to the national live-load model. 7 Therefore, instead of utilizing the specified traffic loading, integrating the site-specific traffic loading is an effective approach for condition assessment of a long-span bridge.
Uncertainties in the traffic flow are the main factor leading to the stochastic feature of the traffic load effects. 8 These uncertainties are usually quantitated by site-specific traffic measurements. With the development of the sensor technology, weigh-in-motion (WIM) systems, which are gradually developed for traffic management, have provided a huge database for statistical modeling of the traffic loading.9,10 Fatigue reliability evaluation of orthotropic steel bridge decks under stochastic fatigue-truck loads simulated based on WIM measurement was investigated by Lu et al. 11 and Liu et al. 12 Advanced statistical approaches have been developed on probabilistic analysis with WIM measurements, such as the peaks over threshold (PVT), generalized extreme value (GEV) distribution, and Rice’s level-crossing approach.13,14 The block maxima (BM) load effects for short- and medium-span bridges have been demonstrated by Enright and O’Brien 15 that the GEV distribution fits the BM values fairly good. Chen 16 investigated the influence of the starting point on the crossing rate fitting. Applications of the statistical model are to evaluate the extrapolations as well as the characteristic load effect. For instance, the live load in AASHTO 17 specification was extrapolated based on the WIM sites in Ontario. In addition, the live load specified in Eurocode 1 (2003) was extrapolated in 1000-year return period based on the WIM sites in France. 18 Ruan et al. 19 proposed a site-specific traffic load model for long-span multi-pylon cable-stayed bridges with consideration of traffic volume growth and heavy vehicle proportion. As elaborated above, great achievements have been obtained on applying WIM measurements for traffic load modeling. However, to the best of the authors’ knowledge, application of WIM measurements for reliability assessment of bridges is insufficient.
First-passage probability describes the probability of a scalar process exceeding a prescribed threshold during an interval of time. 20 In practice, the first-passage probability has been used in several areas of engineering structures. Noori et al. 21 investigated the first-passage probability of a highly nonlinear hysteretic system via quasi-conservative stochastic averaging. Chen and Li 22 proposed a probability density evolution method for dynamic response analysis and reliability assessment of nonlinear stochastic structures to estimate the first-passage reliability. Khan et al. 23 evaluated the first-passage probability of a cable-stayed bridge against the seismic load. Significant progresses in structural reliability evaluation have been achieved in the last decades on nonlinear stochastic structural dynamics. 24 Given the nature of stochastic behavior of the traffic loading, the first-passage probability can be the best description of the load effect crossing the threshold value specified in the native bridge design specification. Most research efforts in this regard have concentrated to seismic loads, while little effort has been done on utilizing first-passage probability for reliability assessment of long-span bridges under traffic loading.
This study aims at implementing WIM measurements for first-passage reliability assessment of long-span bridges subject to heavy traffic loading. As the first step, stochastic traffic loads are simulated based on the WIM measurements of a highway bridge in China. A computational framework is presented integrating Rice’s level-crossing theory and first-passage criterion. Finally, effectiveness of the computational framework is demonstrated by a case study of a cable-stayed bridge. Influences of the traffic growth factors on the first-passage probabilities of the bridge deformation are investigated.
Stochastic traffic load simulation based on WIM measurements
Description of WIM measurements
A WIM system utilizes scales or pressure sensors embedded into the road pavement to measure the traffic volume and the GVW of passing vehicles. 25 In practice, WIM systems can be used for a wide range of tasks, such as protection and management of highways and other infrastructure investments. In this study, WIM measurements are used for statistical analysis of the traffic loading.
A bridge WIM system in Sichuan, China, was chosen herein as a prototype. The WIM system has been working since the bridge was opened to the public in May 2012. Details of the WIM system can be found in Liu et al. 26 Before statistical analysis of the measurements, a filtering process was conducted in order to identify and remove invalid records from the database. These criteria to identify the invalid records are as follows: (1) the GVW is <30 kN, (2) the axle weight is >300 kN, (3) the vehicle length is >20 m, and (4) the data are uncompleted or flagged with the system error. Overview of the filtered WIM measurements is shown in Table 1. It is worth noting that the maximum GVW for a six-axle truck is 550 kN according to the traffic laws in China. 27 However, as observed from Table 1, the number of overloaded trucks is approximately 17 per day. The overload rate of the maximum GVW is about 200% over the threshold value.
Overview of the WIM measurements.

GVW: gross vehicle weight.
Based on these measurements, the trucks were classified into six categories. Proportion of the vehicle types are shown in Figure 1(a), where V1 indicates the light car, V2–V6 indicate the two- to six-axle trucks, respectively. It is observed that 39.24% of the entire vehicles are three- to six-axle trucks, which is the main contribution to the critical traffic load scenario. The average daily truck traffic (ADTT) was fitted by a normal distribution with a mean value of 2145 and standard deviation of 424 as shown in Figure 1(b). The hourly traffic density in 1 day is shown in Figure 1(c), where the traffic is divided to free flow and busy flow. It is worth noting that the vehicle density mostly depends on vehicle spacing, which is another factor contributed to the critical traffic load scenario. Therefore, the busy flows between 9:00 and 22:00 were used for statistical analysis of the vehicle spacing. The vehicle spacing of busy flows was fitted by a lognormal distribution with a mean value of 6.21 and standard deviation of 1.40 as shown in Figure 1(d).

Probability densities of the traffic flow: (a) proportions of vehicle types, (b) the time-variant vehicle density, (c) ADTT, and (d) vehicle spacing of the busy traffic flow.
In addition to the large-scale statistics shown in Figure 1, the small-scale statistics of individual trucks were also analyzed. Taking V6 as an example, the histogram and probability density functions (PDFs) of the axle weight and GVW are shown in Figure 2, where AW64 indicates the fourth axle of the six-axle trucks. The Gaussian mixture model (GMM), as shown in Figure 2(b), has captured feature of the bimodal distribution. Both the large-scale and small-scale information provide statistical parameters for the traffic load simulation.

Histograms and PDFs of the six-axle trucks: (a) axle weight and (b) GVW.
Based on the above demonstration, the remaining statistical analyses were conducted to provide the entire probability model for the subsequent stochastic traffic simulation. Most of the extreme values, which will be used for probabilistic modeling of first-passage failure probability, are caused by dense traffic flows. Therefore, the vehicle spacing of dense traffic flow is effective for the traffic load simulation.
Stochastic traffic loading simulation
With the statistics of WIM measurements, Monte Carlo simulation (MCS) was utilized to simulate the stochastic traffic load in the time domain. Suppose a linear growth factor of ADTT to be 0.5%, and the simulated traffic loads in 60 min for the present case and the 100th year case are shown in Figure 3.

Simulated stochastic traffic loads: (a) the present case and (b) the 100th year.
As shown in Figure 3, each symbol indicates to a truck specified by a different mark style, x-axis shows the arrival time, and y-axis shows the individual GVW. It is observed that every individual truck is different from another, but they follow a relative probability distribution. Therefore, the stochastic truck load model contains the statistics of the WIM measurements.
Methodology
Rice’s level-crossing theory
The principle of the Rice’s level-crossing theory 28 is shown in Figure 4. The precondition of using the Rice’s formula is to make sure that the load effects follow a normal distribution. In this regard, Ditlevsen 29 has demonstrated that the bridge load effect can be modeled as Gaussian random process under the case of both a long influence line and a dense traffic. Fortunately, the long-span bridge in this study has a long influence line. In addition, only busy traffic flows are used for the traffic load effect analysis. Thus, the bridge load effect can be assumed as Gaussian random process and the Rice formula is appropriate to be used.

Description of Rice’s level-crossing theory.
Based on the above assumption, the mean up-crossing rate v(x) under the condition of a threshold level is expressed as

where x is a random process, which represent the load effect in this study; m and σ are the mean value and the standard deviation of x, and σ′ is the standard deviation of the derivative of x. With consideration of the return period, the cumulative distribution function (CDF) can be written as 30
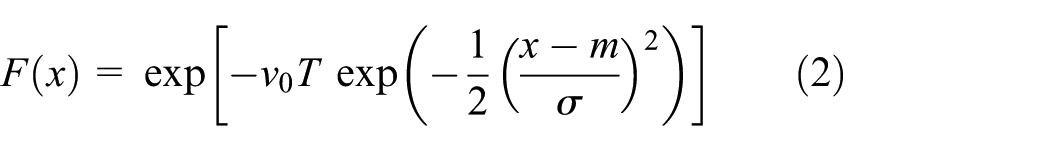
where v0 is σ′/2π and T is the service period of a bridge. For extrapolation utilizing the Rice formula, Cremona 30 recommended an optimal level about how to determine the threshold based on the minimization of the Kolmogorov–Smirnov statistical equation which is written as

where xmax is the extrapolation of maximal load effect in a return period Rt;
First-passage probability
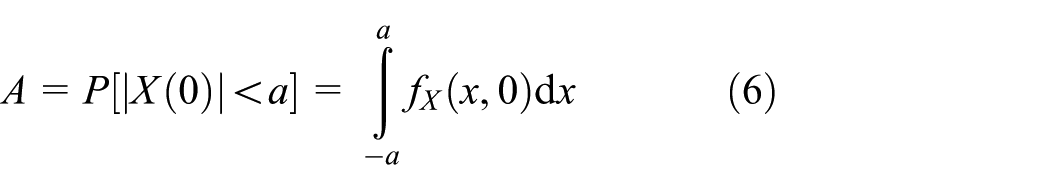
The first-passage probability is essential for estimating the reliability of a structural component whose response is a stochastic process. The first-passage probability of a zero-mean stochastic process crossing a prescribed double-sided threshold during an interval time can be written as

where X(t) is the zero-mean stochastic process, a is the prescribed threshold, and t ∈ (0, τ) is the interval time. In general, there is no exact solution for the probability. On the basis of Poisson assumption, the probability of failure is written as

where
Considering the growth rate of the traffic flow during the bridge service period, the first-passage probability is written as

where the service period T is divided into T intervals indicated as ti and n is the maximum service period in a year. Since the traffic density and GVW are growing in the service period, v(a, ti) is time variant.
Proposed computational framework
Based on the theoretical basis illustrated above, a computational framework is presented for the purpose of evaluating first-passage probability of a long-span bridge under stochastic traffic loading. A flowchart of describing the procedures in the framework is shown in Figure 5.

Computational framework for first-passage reliability evaluation of a long-span bridge under traffic loading.
As shown in Figure 5, the framework begins with WIM measurements and the bridge detail geometry and material properties. Deterministic finite-element simulation is conducted to obtain the extreme load effect of the bridge under the traffic loading. With the deterministic results, Rice’s formula is used to fit the level-crossing rate based on the upper data of the extreme load effect. Subsequently, the extrapolation and first-passage probability can be estimated by considering the return period and threshold values, respectively.
During the long-term service period of a bridge, the traffic growth is considered in the stochastic traffic flow, which is updated at the end of the framework. The traffic growth model can be considered as an annual compounded growth rate of the traffic volume and the GVW. Since the static influence lines are used to calculate the traffic load effect, the computational effort is ignorable.
Case study
Bridge details
Hejiang Yangtze River Bridge is a long-span cable-stable bridge in Sichuan, China. The span length of the bridge is 210 m + 420 m + 210 m as shown in Figure 6. The materials of girders and cables are concrete and steel stand, respectively. There are four traffic lanes in the opposite directions. A finite-element model as shown in Figure 6 was built with a commercial program ANSYS. The girders and pylons were simulated by Beam188 elements. The cables were simulated by Link180 elements (Figure 7).

Dimensions of a cable-stayed bridge.

Finite element model of the cable-stayed bridge.
Probabilistic modeling of traffic load effects
The traffic load effects were computed by the static influence lines of the bridge. The displacement influence lines of the critical points of the bridge were computed in the finite-element model by a moving load of 100 kN. As shown in Figure 8, the maximum values for the quarter-span point (L/4) and the mid-span point (L/2) are 0.0274 and 0.0182 m, respectively, where L is the length of mid-span of the bridge. The displacement histories of the critical points of the bridge under 1-h stochastic traffic loading are shown in Figure 9. It is observed that the L/2 point has a larger vibration amplitude compared to the L/4 point. This phenomenon can be explained by the first-order mode shape of the cable-stayed that is symmetric.
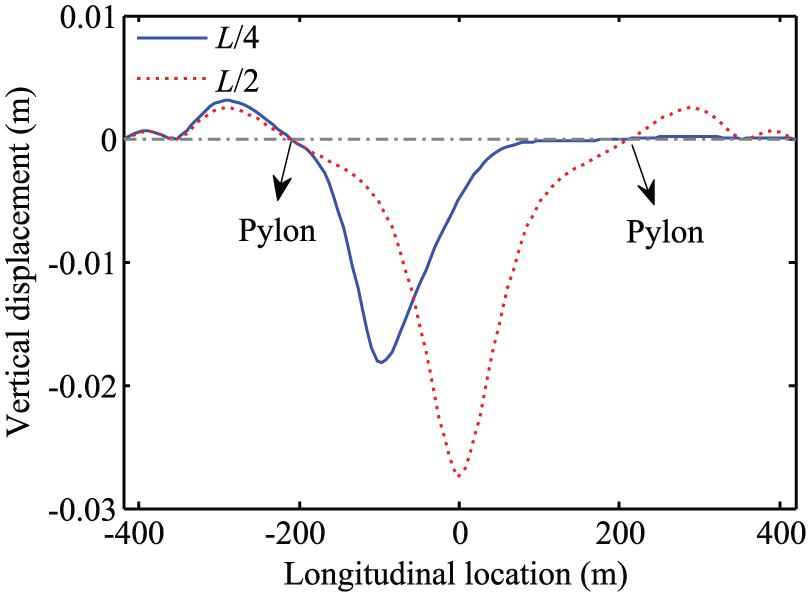
Displacement influence lines of the critical points of the bridge.

Displacement histories of the critical points of the bridge.
A total number of 365-day traffic loading has been used to compute the traffic load effects. Based on the deterministic histories, the up-crossing rate was fitted by the Rice’s level-crossing formula as shown in equation (1). In order to obtain the extreme value of the traffic load effect, the 30% upper data were used to fit the tail up-crossing rate as shown in Figure 10. Subsequently, the tail fittings of the load effects calculated by equation (2) were plotted on Gumbel probability paper as shown in Figure 11.

Up-crossing histograms and fittings.

Tail fittings of the extreme load effects on Gamble paper.
It is observed from Figures 10 and 11 that the L/4 point of the bridge has a higher up-crossing rate and maximum load effect compared to the L/2 point of the bridge. In addition, the tail fitting of the up-crossing rate is an appropriate description of probability feature of the extreme traffic load effect.
Results and interpretations
Based on the probability model of the traffic load effect, the extrapolation of extreme load effects and the first-passage probability can be evaluated with consideration of return period and threshold value, respectively. Since the mid-span point of the bridge is the critical location for the deformation failure, the following discussion focuses on the mid-span point. Suppose the annual linear growth rate of both the ADTT and the GVW (RADTT and RGVW) to be in the range between 0% and 2%. The maximum displacement during the service period was evaluated as shown in Figure 12. It is observed that the maximum displacement is 0.74 m without consideration of the traffic growth, and the value increases with the increase in RADTT or RGVW. However, their influences on the maximum displacement are different. With the linear increase in RADTT, the increased ratio of the maximum displacement slows down gradually, while the increased ratio of the maximum displacement grows linearly with the linear increase in RGVW. For instance, under the condition of growth rate of 2%, the RADTT and RGVW will lead to the maximum of 0.87 and 0.92 m, respectively.
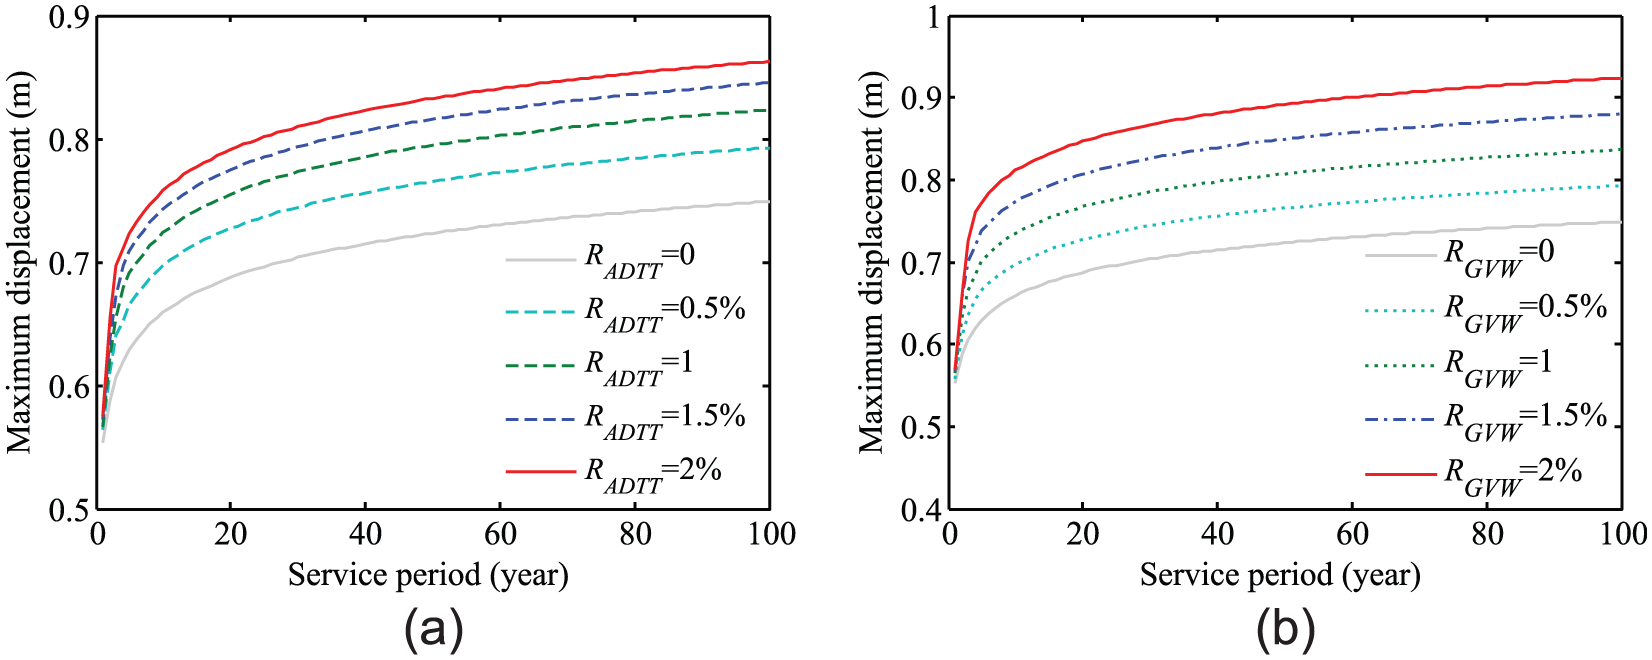
Extrapolated maximum displacements during the service period with consideration of (a) growth rate of ADTT and (b) growth rate of GVW.
According to the design code of concrete cable-stayed bridges in China, 31 the threshold in equation (4) is a = L/400 = 1.05 m. The evaluated first-passage probability is shown in Figure 13. It is observed that the first-passage probability is 3.9 × 10⁻⁷ without consideration of traffic growth, and the value increases rapidly with the growth of the ADTT and GVW. In addition, with the sustained growth of RADTT, the impact on the probability of failure is weakened. However, the sustained growth of RGVW has a constant impact on the probability of failure. Under the growth rate of 2% for the RADTT and RGVW, the probability of failure is 3.7 × 10⁻⁷ and 7.0 × 10⁻⁷, respectively.

Influence of the traffic growth on the first-passage probability of failure.
In addition to the traffic growth, a reasonable traffic management can reduce the provability of failure. Suppose the threshold overload ratio to be limited in the region between 0% and 100% of the standard value in Ministry of Communications and Transportation (MOCAT), 27 the probability of failure was estimated as shown in Figure 14. It is observed that the probability of failure has an obvious decrease with the adoption of a threshold overload ratio. With the traffic growth ratio of 2% of RADTT and RGVW, the probability of failure decreased to 4.5 × 10⁻⁸ and 9.4 × 10⁻⁹, respectively.
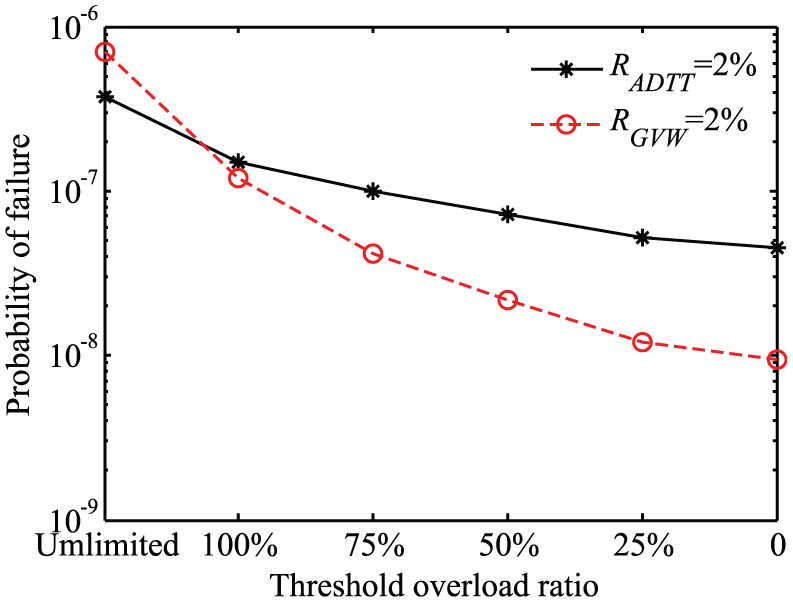
Influence of the threshold overload ratio on the probability of failure.
The following interpretations can be made based on the numerical results. First, the maximum traffic load effect is associated with the traffic density and the GVW. Therefore, the intensive overloaded trucks in the mid-span point of the bridge form the critical loading scenario resulting in the first-passage failure of the deformation of the cable-stayed bridge. The growth rate of the ADTT increases the probability of exceedance due to the intensive overloaded traffic flows and then results in a higher probability of failure. However, the increased rate of the probability of failure is weakening with the continuous increase in ADTT. The increase in GVW has a constant impact on the probability of failure. This impact can be weakened by setting a threshold overload ratio for the overloading management.
The deflection is only a serviceability factor of a long-span bridge. For the load bearing limit state, some other factors including the cable force and the bending moment of the towers or the girders are critical as the extreme load effects. Therefore, further studies are necessary to develop the proposed methodology for the first-passage probability evaluation.
Conclusion
This study presented a methodology for the first-passage probability evaluation of a long-span bridge subject to heavy traffic loading based on WIM measurements. Stochastic heavy traffic loads were simulated based on the statistical characters based on the WIM measurements. The effectiveness of the proposed computational framework was demonstrated by a case study of a cable-stayed bridge. The following conclusions can be drawn from the case study.
The upper tail fitting of the up-crossing rate is an appropriate description of probability characteristics of the extreme traffic load effect, which is the critical factor for the maximum displacement prediction and the first-passage probability evaluation of a long-span bridge;
The ADTT growth increases the probability of exceedance due to an intensive overloaded traffic flows and thus leads to a higher first-passage probability, but this increased trend is weakening with the continuous increase in ADTT;
Since the steady growth of the GVW has a significant impact on the probability of failure, setting a reasonable threshold overload ratio is an effective way as a traffic management to ensure the bridge serviceability.
Although the proposed approach has been demonstrated by a cable-stayed bridge, it can also be applied to any other types of long-span bridges. However, there are challenges for further studies. A more reasonable traffic growth rather than a linear growth factor will be considered in the future work. The structural geometric nonlinearity could be considered to make the simulation more accurate. However, the time-consuming computation induced by the step-by-step integration should be overcome. Subsequently, the other traffic load effects, such as the cable force, the bending moment of the girder, and the axial force can also be considered instead of the bridge deflection. Finally, the Poisson distribution assumption in the Rice’s formula will be improved for a more accurate first-passage probability evaluation.
Footnotes
Academic Editor: Jun Li
Author’s Note
Author Naiwei Lu is also affiliated to School of Civil Engineering and Architecture, Changsha University of Science & Technology, Changsha, China.
Declaration of conflicting interests
The author(s) declared no potential conflicts of interest with respect to the research, authorship, and/or publication of this article.
Funding
The author(s) disclosed receipt of the following financial support for the research, authorship, and/or publication of this article: This research was supported by the National Basic Research Program (973 program) of China (grant no. 2015CB057705), the National Science Foundation of China (grant no. 51378081), the China postdoctoral science foundation (grant no. 2015M580383), and the Open Fund of Hunan Province Engineering Laboratory of Bridge Structure in Changsha University of Science and Technology (grant no. 16KD03).