
Abstract
To study the effects of the squeeze force used in the rivet installing process on structural behavior of the riveted lap joints, three-stage finite element simulation and workshop experiment of single-row countersunk riveted lap joints were implemented. Force–displacement curves and explicit configuration after various processes were obtained from both methods. Additionally, stress/strain fields were obtained from finite element analysis, and strain values at specific positions were measured by micro strain gauge during the experiment. Based on the consistency of the results, stresses on the edge of dangerous holes, load transmission, and secondary bending of joints under tensile load were analyzed. The result shows that increasing squeeze force does not have a significant influence on joint stiffness but results in a slight decrease in joint strength. Greater squeeze force introduces greater residual stress around the hole, and the maximum principal stress around the hole becomes greater tensile stress instead of initial compressive stress introduced by riveting process, thus causes weaker static strength. It is also shown that under static load, breakage occurs in the outer sheet at the end hole due to the largest load transmission and secondary bending, whereas these two aspects not only depend on the rivet installation squeeze force but also depend on the size of the exterior tensile load.
Introduction
Riveted lap joints are widely used in aircraft structures. According to the statistics, the vast majority of airframe fatigue failure accidents originated from structural joints, and 50%–90% of fatigue cracks generated near the fastener holes. 1 Meanwhile, the development of aviation industry is prompting bigger and bigger planes, requiring an increasing number of rivets. Hence, assuring the riveting quality plays an important role in aircraft assembly.
Since the 1980s, many scholars have conducted massive investigations on riveting process. Müller 2 studied the influence of rivet installation force on fatigue behavior of riveted lap joints and concluded that the force-controlled riveting process made better fatigue properties than the displacement controlled, and fatigue life of riveted joints could be increased by greater squeeze force.
Later, several studies have been undertaken in an attempt to further uncover the relationship between the production parameters and the fatigue behavior. Szolwinski and Farris 3 analyzed a non-countersunk model and observed that greater squeeze force pushed the zone of tensile hoop stress away from the hole and also obtained an increased fatigue life. Li et al.4–6 and Rans et al.7,8 conducted numerical and experimental studies on the residual stress/strain after rivet installed and also had a further consideration of the stress variation under the tensile load and found that installation force played a significant role on fatigue behavior of riveted lap joints. Atre et al.9,10 and Cheraghi 11 utilized the finite element (FE) model to conduct parametric studies on the effects of varying hole clearance, misaligned holes, the presence of debris, skin defects, friction, applied rivet displacement, and sealant on the residual stress state in riveted lap joints. Naarayan et al. 12 studied the FE models for riveted lap joints and found that the load shared by the rivet rows in a composite-metal lap joint are not symmetric and therefore are more susceptible to cracking and subsequent failure as the unequal distribution can cause some of the rivet loads to be high. Pavan Kumar et al. 13 analyzed four different (single and multi-row) riveted lap joints by non-linear FE method, considering the rivet yielding, plate yielding, geometrical non-linear and secondary bending effects of the lap joint and showed that although there was unequal load distribution among the rivets in the elastic regime, once the rivets started yielding, significant redistribution of the load took place among the rivets and the load sharing between the rivets was nearly equal at the failure load of the joint. More recently, Skorupa et al.14–16 carried out researches on fatigue behavior of riveted lap joints and reviewed the dependency that the integrated effect of a large number of variables was related to joint design and production and applied loading conditions.
However, these studies have been limited to the influence of squeeze force on residual stress/strain distribution and secondary bending stresses after rivet installation. The influence of squeeze force on joint static strength, load transmission, tendency of stress field around holes, and secondary bending while tensile load applied is still largely unknown. Motivated by the need for a clearer understanding of the effects of squeeze force on structural behavior of riveted lap joint, a three-dimensional FE model was developed and corresponding experiments were conducted to study the riveting process, squeeze force releasing, and load transfer of the joints under tensile load. Single-row (five rivets) countersunk riveted lap joints under three levels of squeeze force were considered. The influence of squeeze force on joint stiffness, joint strength, rate of load transfer, residual stress field and the variance, and secondary bending is studied with the tensile load applied on the far end of the joint.
Riveting process and riveted lap joints
Geometry dimension
The interference makes the material hardening, introduces the residual compression stress, and improves the critical intensity of the material around the hole. Thus, it deduces the stress range for the known external load. 17
In rivet installation process, the speed of compressive load and rivet deformation is slow so that it can be regarded as a quasi-static process. The configuration chosen for analysis is composed of two 2.5-mm-thick sheets joined by five countersunk head rivets. Geometry size of the rivet, material of the parts, and the riveting process model are shown in Figure 1.

Geometry size of the rivet and the riveting process model.
As shown in Figure 2, the installation sequence of the rivets is 5, 2, 1, 3, and 4, that is, install the middle rivet first and the leftmost finally. Figure 2 also shows the geometry size of the test specimen, which included 12 strain gauge locations denoted as D1–D4, H1–H4, and S1–S4.
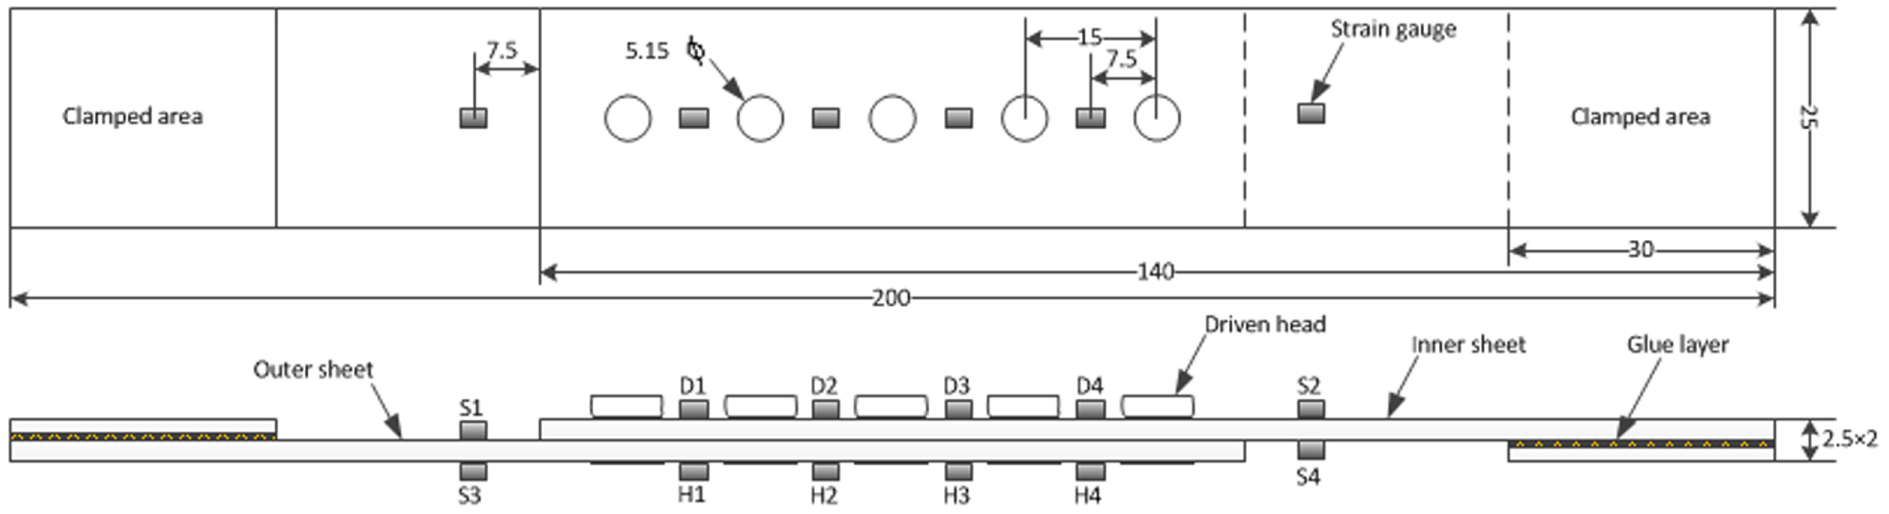
Specification of the joints.
Finite element modeling
According to the experimental joints, three-dimensional FE models of the riveting processes were generated using the non-linear FE analysis software ABAQUS. 18 All parts were divided into hexahedral meshes using linear reduced integration (C3D8R) elements, with the different sizes such as the rivet 0.5 mm, the plates 0.5 mm around the hole, and 4 mm far away from the hole, as shown in Figure 3. Enhanced hourglass control was used for avoiding possible zero-energy deformation modes. The elastic–plastic parameters for materials used here were the same as ones used in the previous work. 19

Typical mesh density shown for the parts.
A clearance exists between the rivet and the hole at the initial state. With the expansion of the shank, the wall of the hole was gradually bulged and complex non-linear contact phenomena occurred. Therefore, interactions between the contact surfaces were defined and the friction coefficient was specified as 0.18, according to the experiment results in the references. 3
Three analysis steps were defined for simulating the riveting process, squeeze force releasing, and load transfer of the joints under tensile load, respectively. Step 1 applied the squeeze force to the analytical rigid pusher, which could install the rivets, and force-controlled method was used. Step 2 deactivated the pusher and the bar to release the force. Finally, step 3 applied the in-plane displacement load on the far end of the joints. The following displacement boundary conditions were used according to the three steps. In step 1, displacements and rotations U1 = U2 = U3 = UR1 = UR2 = UR3 = 0 were applied at the analytical rigid bar and U1 = U3 = UR1 = UR2 = UR3 = 0 were applied at the rigid pusher. In step 2, displacements U1 = U2 = U3 = 0 were applied at the two far ends of the joint. In step 3, displacements U1 = U2 = U3 = 0 were applied at the left far end of the joint and U1 = 5 mm and U2 = U3 = 0 at right far end of the joint. A summary of the load and boundary condition was shown in Figure 4.

Load and boundary conditions of the FE model: (a) rivet installation phase, (b) spring back phase, and (c) joint tension phase.
Experiments
The experiments were implemented on a MTS809-250 kN universal tension and compression testing machine. Three specimens were tested for each process parameter. The experiment results were composed by average of the three sets of data. The compressive and tensile loading speed were 2 mm/min. Force–displacement or force–time curves were recorded automatically by the system. Figures 5 and 6 depict the scene of the rivet installation and the joint tension, respectively.

Experimental set-up for rivets installing.

Experimental set-up for joint tension.
At tensile load stage, resistance strain gauges were used to capture the experimental strains for calculating the internal axial force in the sheets. Experimental strains values at the specified locations were compared with the finite element modeling (FEM) results in the following section.
Results and discussions
Rivet installation
Installation of the rivets was accomplished with a force-controlled process. According to the practical experience, the squeeze force of the type of rivet is 28 kN. In order to study the static performance of the joints under the condition of increasing squeeze force, three levels of squeeze force (28, 31, and 34 kN) were selected, where the increment was approximately maintained at about 10%.
Figure 7 shows the rivet installation results. The deformed model configurations of FEM are shown in Figure 8. After rivets were installed, the diameters of the driven heads were measured and the averages of the results were compared with the FE simulations, as shown in Table 1.

Rivet installation results for test specimens.
Deformed rivet configuration of finite element modeling.
Comparison of FE and experimental size of the driven head.
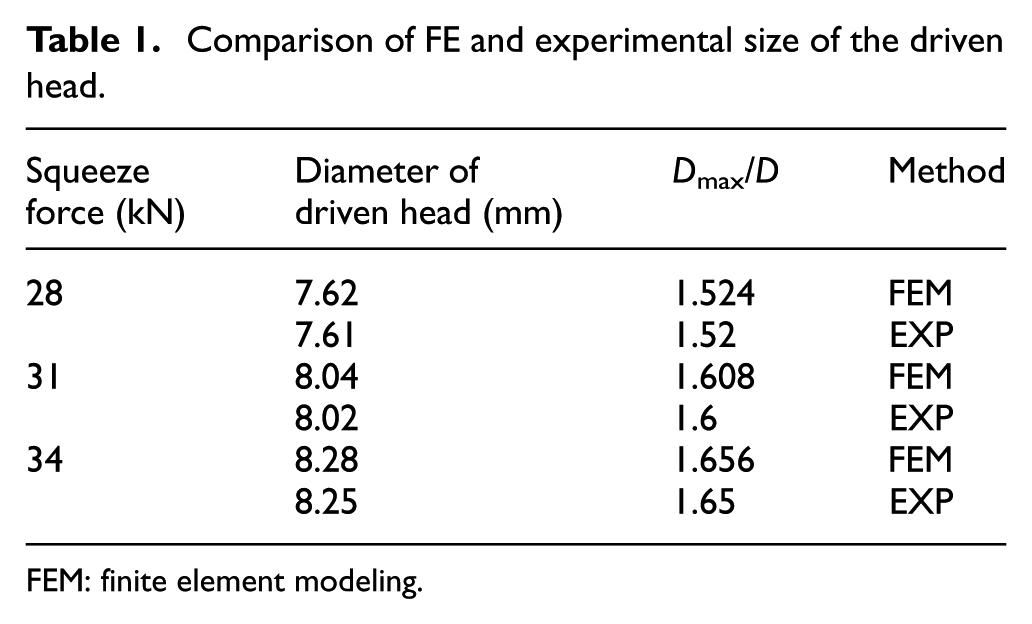
FEM: finite element modeling.
After time-scale unification, squeeze forces as a function of displacement obtained from simulation and experiment were compared, as shown in Figure 9. As can be seen from the comparisons, the results of the FE analysis and experiment are consistent. Thus, the validity of the former two FE analysis steps is partially verified and can be used for further analysis and research.

Comparisons of FE and experimental squeeze force–displacement curves.
Joint tension
During experimental testing, joint tension was accomplished with a force-attenuation-ratio controlled process. Breakage occurred in every specimen, without exception, at the first rivet head closed with the clamped area on the outer sheet, as shown in Figure 10.

Observed broken location for specimens.
The largest deformation location in joints was predicted by FEM, which was consistent with the experiments, and could also be clearly observed in Figure 11. Results showed that the FE simulations provided the reasonable joint broken.

Predicted largest deformation of the joints under tensile load: (a) joint riveted using 28 kN squeeze force, (b) joint riveted using 31 kN squeeze force, and (c) joint riveted using 34 kN squeeze force.
During the tensile load stage, force–displacement curves were recorded by the experimental set-up, as shown in Figure 12. It can be observed that the joint stiffness becomes non-linearly smaller with the gradually increasing tensile load, and the effect of squeeze force on joint stiffness is not significant. The maximum values of tensile force were 17.640, 17.504, and 16.117 kN, according to the rivet installation force 28, 31, and 34 kN, respectively. At this rate, larger squeeze force caused smaller joint strength. This point will be discussed in the following subsections.

Recorded tensile force of the joints using three different levels of squeeze force.
Comparisons of strains during joint tension
To compare the experimental and numerical results during the tensile loading stage, 12 gauges were mounted after the riveting process to avoid the residual stress introduced by rivet installation. Figure 13 shows a comparison of the results of FEM and experiments at the corresponding specified locations during the tensile loading stage. As expected, the longitudinal strain variations in gauge for all joints were very close to the FE results. So, both the validity and effectiveness of the FE model are further demonstrated by this consistency.

Comparison of strain variations during tensile loading stage: (a) gauges D1–D4, (b) gauges H1–H4, and (c) gauges S1–S4.
From Figure 13, it can also be observed that there is a similarity of the strain variation tendency between D1 and H4, D2 and H3, D3 and H2, and D4 and H1 in tensile loading stage, which implies the symmetry of an equivalence relation at the corresponding locations in the two sheets.
Redistribution of rivet loads
The rivet flexibility data are the necessary input for load transfer distribution calculation in lap joints with multiple fastener rows. Also, it is well known that the rivet flexibility can be determined by measurement, simulation, or an analytical formula according to the pliability of the sheets. 20 In this article, the rate of transfer was determined using strain gauges between the rows of rivets. The values obtained from two different groups of gauges and corresponded to three levels of squeeze force and two tensile load applied are shown in Figures 14 and 15, respectively. Similar to the existing literature, the rate of rivet transfer load is “basin”-like distribution, that is, larger values at the two end rows and smaller at the middle row. 21 As can be seen from Figures 14 and 15, the rate of transfer not only varies with the rivet installation force but also varies with the level of tensile load applied.

Measured load transfer ratios with tensile stress of 96 MPa.

Measured load transfer ratios with tensile stress of 192 MPa.
In detail, with increasing squeeze force, the uniformity of load transfer ratio of rivets increases on the side of rivet head but reduces on the other side, that is, the driven head side. Larger squeeze force causes the end row driven head, the one close to the clamped area, more damageable, whereas smaller squeeze force caused the end row rivet head more indefectible. Therefore, greater squeeze force will increase the uniformity of the joints and then reduce the possibility of damage to the side of the rivet head, so as to achieve the purpose of increasing the fatigue properties of the joints. It can also be observed from Figures 14 and 15 that greater tensile load makes the load sharing of the rivets more well-proportioned.
Full-field stress contours
As a result of the limit paste location of the gauges, only strain values of few points can be measured. FE method is to be able to get the stress or strain field in the structure, so it is one of the most powerful tools to analyze the structural behavior. Aforementioned comparison of the FEM and the experimental results, such as force–displacement curves, geometry size of the driven heads, and the measured values of the strain gauges, makes a good verification on the FEM results. In the following subsection, stress fields obtained from FEM, especially on the edge of the holes, will be analyzed.
Full-field contours of Mises stress
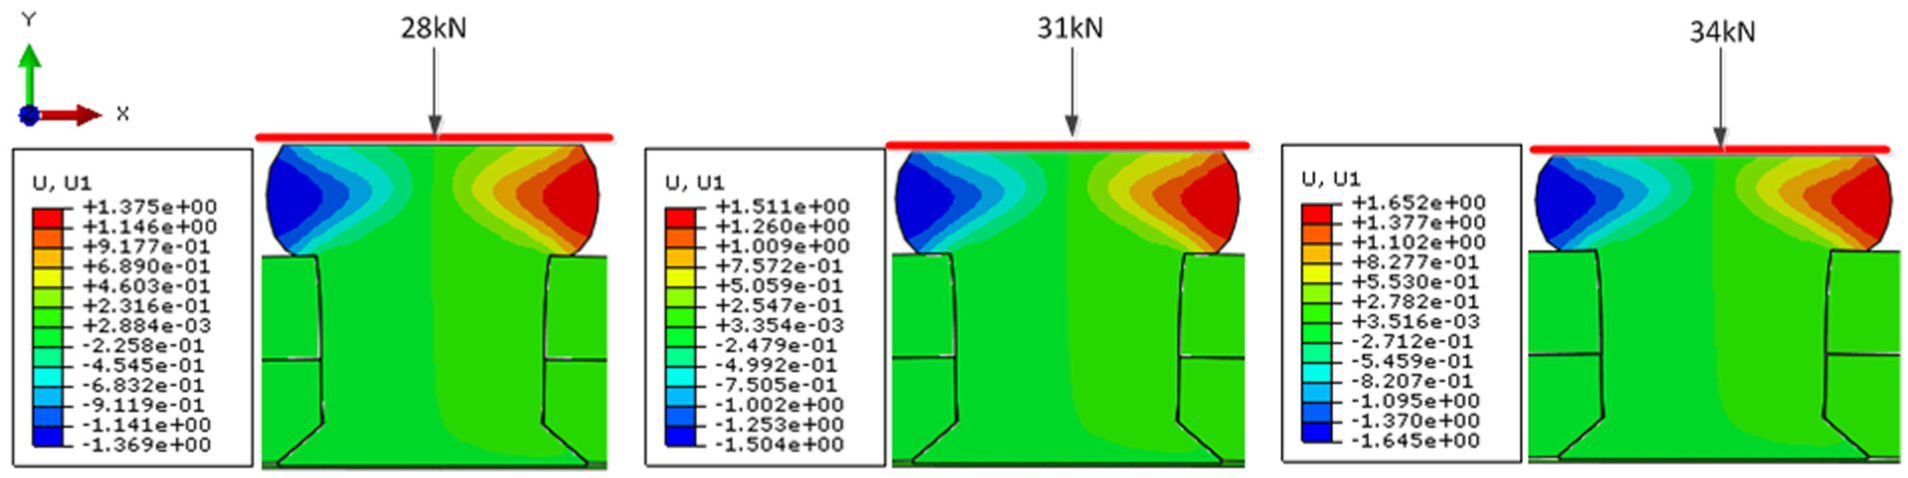
Figure 16 shows the full-field contours of Mises stress of the joints (with rivets hided) using three levels of squeeze force under tensile load of 12 kN, that is, tensile stress of 192 MPa. There are two areas provided with larger values and would be the main location to cause nucleation and then growth. The first one is the leftmost rivet-hole vicinity, on the outer sheet and close to the clamped area, which usually becomes the most dangerous area under tensile load. All specimens were broken at this location in the tension experiments. The other one, that is, the second vulnerable, is the rightmost rivet-hole vicinity on the inner sheet, as shown in Figure 16.

Full-field contours of Mises stress when loaded in tension using tensile load of 12 kN: (a) joint riveted using 28 kN squeeze force, (b) joint riveted using 31 kN squeeze force, and (c) joint riveted using 34 kN squeeze force.
Mises stress varies along the edges of the aforementioned two holes on the faying surface, which is presented in Figures 17 and 18, respectively. As can be seen, after releasing the squeeze force, the stress level on the edge of the secondary dangerous hole is higher than the most dangerous hole. But this case is reversed after applying tensile load. Furthermore, higher squeeze force caused the higher stress level on the edges of the two holes when the same tensile load was applied.
Mises stress on the edge of the most dangerous holes.

Mises stress on the edge of the secondary dangerous holes.
Full-field contours of the maximum principal stress
Maximum principal stress is a major important component for studying crack nucleation and growth. Figure 19 shows the full-field contours of the maximum principle stress of the joints, riveted using three levels of squeeze force, under tensile load of 15 kN and tensile stress of 240 MPa. Figures 20 and 21 present the value variations along the edge on the faying surface of the two most dangerous holes, respectively. It can be observed that
After releasing the squeeze force, that is, before loading the tensile force, greater squeeze force causes smaller maximum principle stress on the edge of the most dangerous holes. Most of the nodes on the edge of the most dangerous holes have a positive value for the joint riveted using 28 kN squeeze force but have a negative value for 34 kN, and the case of 31 kN falls somewhere in the middle. There is a little difference in the secondary dangerous holes, but a similar result between the most dangerous holes in global view.
In all joints, the area near the most dangerous holes has the maximum values. The character of the distribution is that largest value starts at the location included angle 80° with the opposite direction of the tensile load and then gradually decreases to the edges of the sheet and inclines to the direction of the tensile load.
For the secondary dangerous holes, the largest value occurs at the location included angle 105° with the opposite direction of the tensile load, but the values near the hole are smaller than that at the edges of the sheet from a globe view.

Full-field contours of maximum principle stress when loaded in tension using tensile load of 12 kN: (a) joint riveted using 28 kN squeeze force, (b) joint riveted using 31 kN squeeze force, and (c) joint riveted using 34 kN squeeze force.
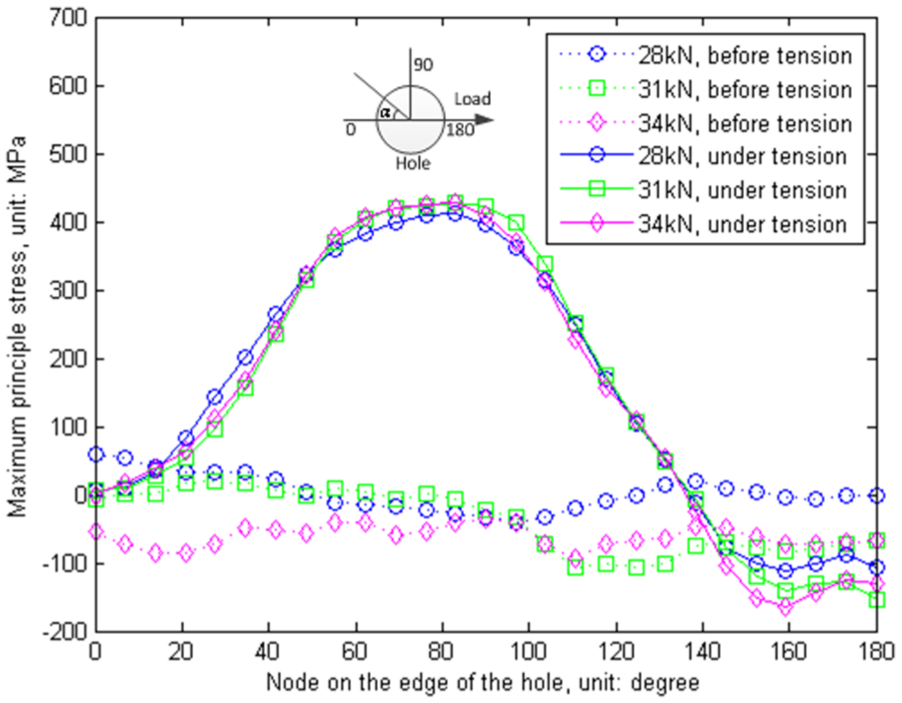
Maximum principle stress on the edge of the most dangerous hole.
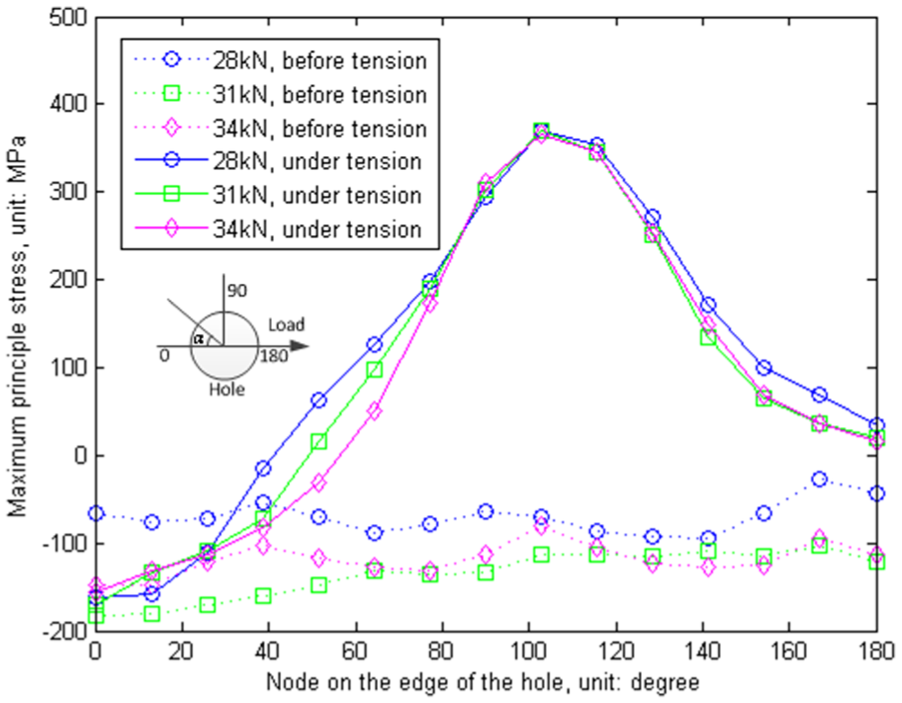
Maximum principle stress on the edge of the secondary dangerous hole.
Therefore, if the failure appears in the most dangerous holes, the crack may be nucleated on the hole wall and then extend to both sides of the sheet. If the failure appears in the secondary dangerous holes, the crack may be nucleated either on the hole or a side of the sheet. But for sheet thickness direction, crack must initiate on the faying surfaces.
Hoop stress
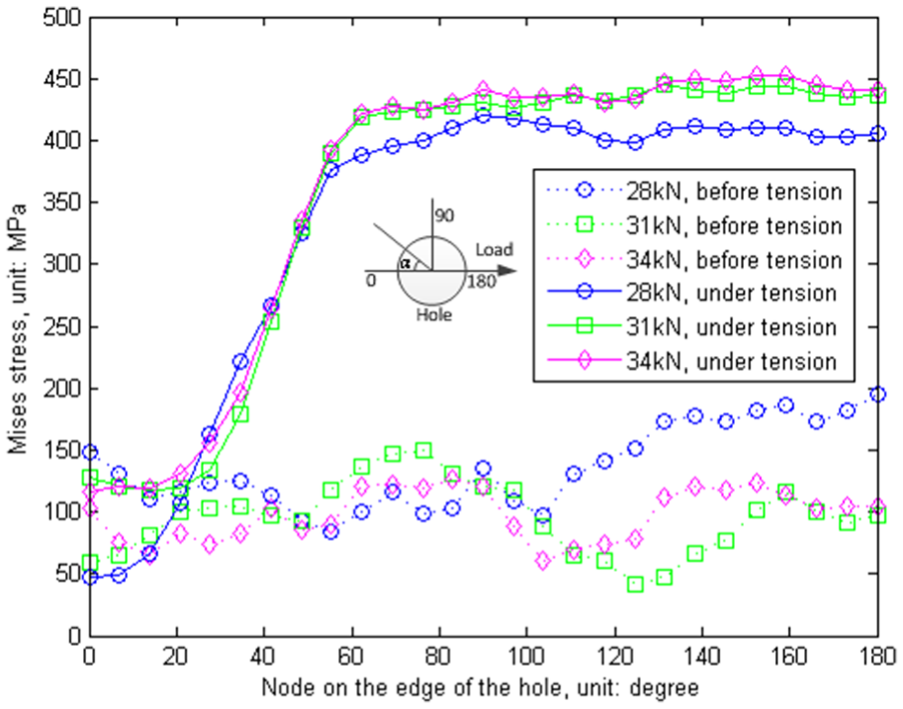
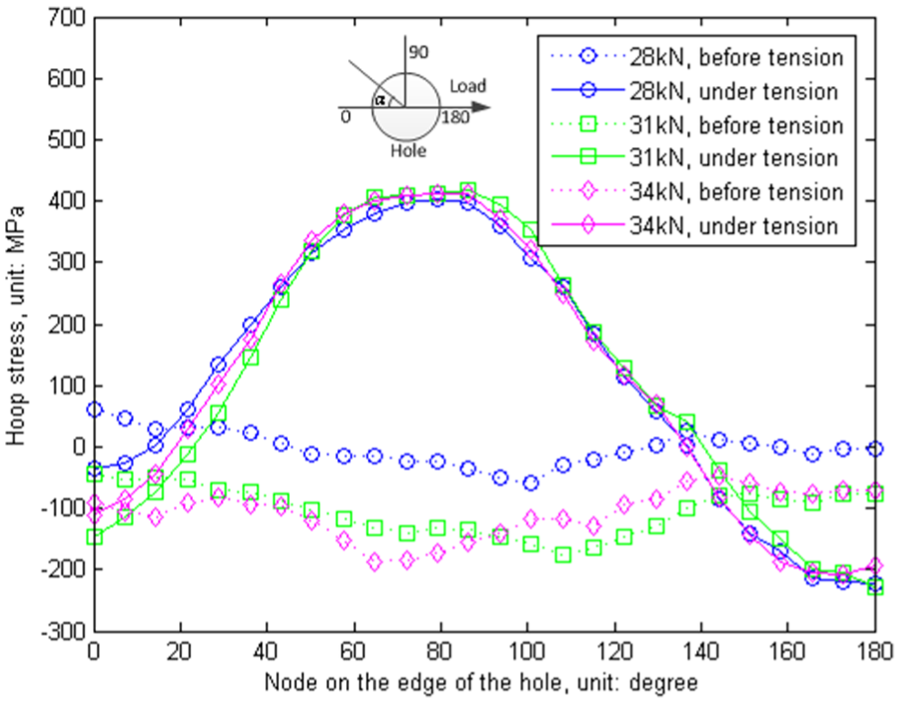
Hoop stress near the hole is an important factor causing crack nucleation and growth. Aforementioned stress analysis was based on the rectangular coordinate system. To analyze the stress around the hole in more detail, stress fields were transformed from the rectangular coordinate system to the cylindrical one. Figures 22 and 23 present the hoop stress on the edge of the two most dangerous holes before and after applying the tensile load, respectively.
Hoop stress on the edge of the most dangerous hole.

Hoop stress on the edge of the secondary dangerous hole.
Residual hoop stress introduced by rivet installation is compressive when the squeeze force is big enough. Greater squeeze force introduced stronger compressive hoop stress. The compressive hoop stress level on the edge of the secondary dangerous holes is stronger than the most dangerous one. It is implied that the riveting interferences in the two sheets are not equal. Compressive stress changed to tensile when the tensile load was applied, the extreme occurs at the angle 80° on the edge of the most dangerous holes and 108°on the edge of the secondary dangerous holes, respectively. Locations of crack initiation were further verified.
Secondary bending
The definition of secondary bending can be given in either strains or stresses and used the following formula to express

where the subscripts b and t denote the bottom and top surfaces of the sheet, and bend and ax denote quantities pertaining to bending and tension only, respectively. 15
The well-known and the most important conclusion about the secondary bending stress in riveted lap joints is that the larger squeeze force causes a migration of the peak bending stress location more far away from the end hole. Here, two conclusions are obtained from the analysis of the measured strain value at the locations S1–S4. First, as can be seen from Figures 24 and 25, greater squeeze force causes bigger secondary bending factor at the measuring locations when the same tensile load is applied. Second, secondary bending stress increases with increasing tensile load but secondary bending factor drops and tends to 0.

Bending stress factor of the outer sheet.

Bending stress factor of the inner sheet.
Conclusion
In this study, three-dimensional FE models and static strength experiments were carried out on riveting process, spring back, and riveted joint (five rivets, single row) tension. Three levels of squeeze force were used in the riveting process and strain values were measured using micro strain gauges while applying the tensile load in the experimental study.
From this study, the following conclusions can be drawn: (1) stiffness of riveted joint is non-linear and gradually decreases with increasing tensile load. (2) Within an uncertain range, greater squeeze force in the riveting process will cause lower static tension strength. (3) Sections stood on similar location in riveted joint will bear similar tensile load. (4) There are three reasons for the first row of holes on outer sheet becoming the most dangerous area where breakage occurs: countersunk holes weaken the area of transverse section of outer sheet more seriously, redistribution of rivet loads is not well-proportioned, and secondary bending makes the maximum principal stress greater on faying surface than free surface. Non-uniformity of redistribution of rivet load on driven head side increases with greater squeeze force in the riveting process, whereas non-uniformity on the other side decreases. (5) Greater squeeze force introduces greater residual stress on the edge of the holes after rivet installation and also causes higher level of stress while the tensile load is applied on far end of the joints. (6) The secondary bending stress is influenced by the rivet installation force and the tensile load applied.
Finally, it is well studied and well known that greater squeeze force causes better fatigue strength for riveted lap joints, whereas this is not the case for static strength in our study. This may imply that greater squeeze force is more suitable for low levels of fatigue load rather than high levels. Further investigation on this point will be a good and interesting orientation.
Footnotes
Academic Editor: Yongming Liu
Declaration of conflicting interests
The author(s) declared no potential conflicts of interest with respect to the research, authorship, and/or publication of this article.
Funding
The author(s) disclosed receipt of the following financial support for the research, authorship, and/or publication of this article: This work is supported by National Natural Science Foundation of China (51305395 and 51275463) and the Fundamental Research Funds for the Central Universities (2014FZA4004).