
Abstract
This study introduces the development of a new body weight support system using pneumatic actuators for gait training. The main scope of this work is to provide a new design, validation, and assessment for active body weight support systems to reproduce a subject’s normal walking behavior. Based on the assessments and its evaluations, the novel body weight support system using pneumatic muscle actuators shows many advantageous characteristics, such as simplicity, low cost, maintenance of a constant unloading force, and ease of control of the supported force. The capability of the novel body weight support system to generate unloading forces that track the center of pressure, because it switches from left to right and vice versa as the subject walks, is especially interesting.
Introduction
In recent years, body weight support (BWS) systems have been developed and proven to improve gait training systems for patients who recover from spinal cord injuries or strokes. Primarily, BWS systems were used for observing the recovery of spinal cord cutting cats when implementing gait training for them with weight support as well as with full weight.1,2 The BWS system was then extended for human gait training and it exhibited many advantages in comparison with conventional therapies. 3 The advantage of the BWS system is that it intuitively allows the patient to walk in locomotion gait training while providing weight support to help reduce the body weight on the patient’s legs. The clinical examination implemented by Visintin et al. 4 confirmed that the patients who were trained using a BWS system could walk with the desired gait compared to older methods. The benefit of gait training using a BWS system is not only simply supporting the subject’s body weight during walking but also the improvement of other gait parameters such as ground reaction force, hip, knee, and ankle angle parameters, and the symmetry of gait locus.5–8 Recently, the BWS system has been combined with leg robotic orthoses such as Locomat, 9 which help greatly reduce therapy cost and labor.
A BWS system plays an important role in a gait training system for various reasons. The first reason is that it reduces the gravitational forces acting on a patient’s legs and hence reduces the load needed to be overcome by the patient so that it allows the patient to maintain his or her balance and to perform stepping movements. The other reason is its dynamic characteristics and special task activity, which allow patients to initiate gait training activities early after injury. 3 The gait training process for incompletely healed patients normally undergoes many periods, depending on the condition of the patient. In the beginning, a BWS system often applies a large unloading force to reduce the gravitational force acting on the legs of the patient during gait training. The unloading force supplied can support up to 80% of the patient’s body weight to compensate for the inability of the patient’s body to support itself. The level of the unloading force would be reduced following the improvement of the patient’s mobility. The amount of the unloading force is adjusted depending on the clinical processing of the therapist. In general, the amount of supported weight will be gradually reduced, and the afferent signals to the brain will be increased. In this way, the sensory receptors are activated and their functions are improved during a gait cycle. Finally, the BWS system also ensures safety and stability during the gait training process.
A BWS system normally consists of a harness, cables, pulleys, frame, and the actuators that carry a percentage of the patient’s body weight. The actuators for the BWS system have been under development for two decades, and these were extremely numerous. Passive BWS systems, which use a series of springs, were demonstrated in the 1990s.10,11 This apparatus applied a nearly constant vertical force to the body. The limitation of this actuator was that it did not ensure the unloading force, and that there was no feedback construction for the unloading force; the force tuning was manually calibrated. In 2000, Gazzani et al. 12 demonstrated a pneumatic BWS system consisting of a pneumatic cylinder attached to a cart that could be rolled along a track mounted on a frame. The unloading force value could provide feedback to the controller, but the system did not control the dynamic force. In addition, its cumbersome nature was its main disadvantage. The dynamic unloading force due to the vertical movement of the center of mass (COM) is much more appreciable with time. In 2006, the Lokolift, a fully computer-controller partial BWS system, was developed by Frey et al. 13 that used a dynamic roller combined with a parallel spring, which could fully reduce the dynamic unloading force. However, the authors also admit that the physiological gait kinematics and ground reactions, together with afferent feedback, play an important role in the success of gait rehabilitation, so that the constant unloading of body weight may not be the best solution. In 2010, another partial BWS system, which was characterized by the ability to provide either a constant or synchronously modulated support force, was developed by Glauser et al. 14 This system used a linear motor to reduce the gravitational force on the subject’s body, but this system was cumbersome and unsuitable to mount on the gait training system.
BWS systems for human gait training can be classified into three types: static, passive, and active systems. 13 Static systems often consist of a winch system which is connected to a harness through the rope–pulley. Winch systems, attached to a hard frame, can be driven to adjust the unloading force using a manually wound winch crank or using an electric motor with manually controlled speed. 15 Static systems are considered to provide a constant weight support level; however, due to the vertical movement of the COM, this feature cannot be fit. Passive systems can be applied with some types of actuators, for example, counter weights, 16 extension springs, 10 and pneumatic cylinders. 12 In these systems, the structures are similar to the static system, but the actuators to adjust the unloading force are changed. For a counter weight system, the unloading force depends on the gravitation and inertia of the counter weights. In the system using an extension spring, the actuator comprises a number of springs connected in series. Passive systems also maintain a constant unloading force; their characteristics are superior to those of static systems in that the suspension force is passively adapted, but is uncontrollable with a moving COM during walking. The adapted suspension force is a potential force, such as gravitation, elastic force, and displacement of the cart in the case of using a pneumatic cylinder. Limitations of passive systems are that they could not guarantee a constant force, and using a rope–pulley system, the subject can be swung during walking. Recently, development of active systems can overcome almost all the limitations of passive systems. They ensure constant weight support by combining a closed-loop control system with a dynamic roller13,17 or electromagnetic motor. 5 However, almost all active systems, which apply the inherent structure in which a very complex and cumbrous actuators are connected to the subject’s trunk through a pulley–rope mechanism, have the disadvantage of potentially swinging the subject using these systems. In contrast, the pneumatic muscle actuator (PMA) has many advantages which could be applied to the BWS system such as simple structure, low cost, high power-to-weight ratio, and especially the capacity to generate force actively. 18 Even though the PMA has some inherent limitations such as nonlinear and hysteresis behavior, it still is very attractive to the researcher to put more attention to apply PMA in therapy medical devices and rehabilitation. 19 In addition, Franz et al. 5 suggested that the unloading force, which varies with gait pattern, is more efficient than a constantly supported force. Using the PMA directly connects to the subject’s trunk during gait training, we can adjust the unloading force actively. Moreover, the critical point of gait training is that the center of the human body always changes in three-dimensional space. Franz et al. 5 suggested that synchronizing between gait and force modulation during the stance phase could provide more effective gait training. However, no study successfully modulates the support force in the other dimensions of the COM’s movement as well as considers a moving center of pressure (COP).
This research introduces the development of a BWS using pneumatic actuators for a gait training system. Based on the assessments and its evaluations, the novel BWS system exhibits the characteristics of being simple, low cost, able to maintain a constant unloading force, and the unloading force generated by the new system can be adjusted actively. An especially important capability of the novel BWS system is to generate the unloading forces that track the COP since it switches from left to right and vice versa.
Overview of the system
Figure 1 shows an overview of the schematic diagram of the new BWS system while Figure 2 shows the mechanical prototype of the BWS system. The design of the mechanical structure of the BWS system was described in a previous article. 20 Currently, the BWS system employs the National Instrument device—NI cRIO-9176—that utilizes the NI Control, Simulation Module, and LabVIEW My Rio software as the operating system. The level of the unloading force is input in the host computer, transferred by local network to the real-time device containing an integrated field-programmable gate array (FPGA), and then the command is sent from a real-time computer to the FPGA using FPGA interface functions. The signals from load cells are used to calculate the COP tracking model and generate the reference signals. The control signals are output from the NI output module to operate the electro-pneumatic regulators (ITV 2050 by SMC). In this system, a regulator implements each muscle. The measurements by the system (i.e. force (N)) provide the feedback signal to the controller through analog/digital (A/D) input modules from National Instrument. The force sensors are provided by KYOWA (LUR—A—2KNSA1). The motion capture system with six cameras (from Motion Analysis Corporation) was also used to collect data from 12 markers positioned at the ends of the bones of the lower limbs, pelvis, and the shoulder of the trunk. The data collected from the motion capture system were used to calculate the COM movement.

Overview of the BWS system in which every component is represented.
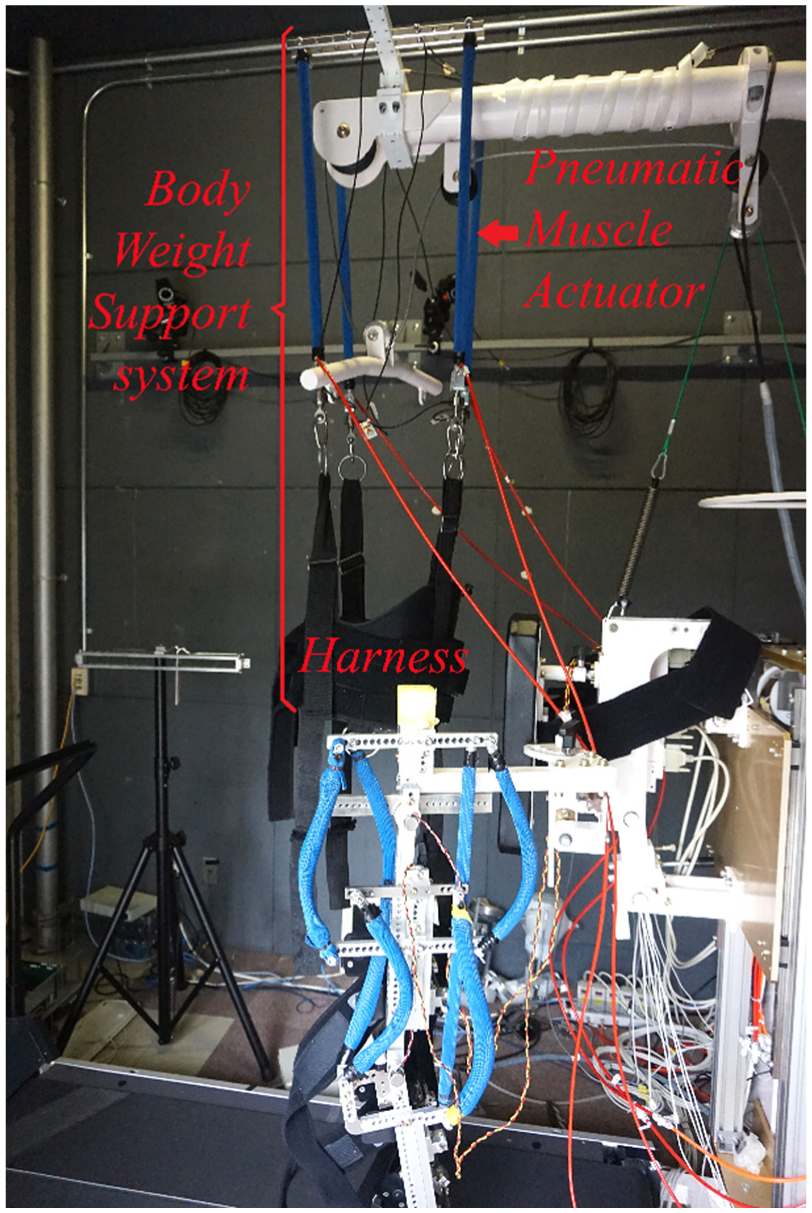
The prototype of the new BWS system with the main components.
The PMA applied to the BWS system is a McKibben braid pneumatic actuator type. The actuator is 0.25 cm in diameter and 65 cm in length. In general, the PMA has an internal bladder tube that was made from rubber and was surrounded by braid mesh. At both end tips of muscle, the bladder and the surrounding layer were attached for fitting. The input compressed air pressure was separately supplied for each PMA by a pressure regulator such that the PMA would be contracted and produce a force reminiscent of a human muscle.
Control system
Development of a modeling and control system for the PMA has been considered for the two recent decades. Caldwell et al. 18 developed a control system for lower limb robots using a pneumatic actuator. The simple model for the PMA was based on the geometric parameters of the actuator. Chou and Hannaford 21 developed a static model for the PMA based on energy conservation during compression and expansion of the muscle. Quasi-static and dynamic experiments also represented the hysteresis phenomenon in the relationship between contraction and pressure. This model was also developed by Tondu and Lopez, 19 who considered the thickness of the air muscle and friction. Most of the models based on geometrical and physical principles are highly complicated. There are many unknown parameters and some are even impossible to observe. Moreover, the geometry- and physics-based models did not demonstrate the nonlinear hysteresis phenomenon. In recent years, advanced control systems and models based on experimental observation have been developed to overcome the limitations of classical models.22–28 The Maxwell-slip model covers the hysteresis phenomenon of muscle length and pressure. This model was introduced by Vo-Minh et al. 24 based on isometric and isotonic tests. G Andrikopoulos et al.25,26 covered the Bouc–Wen model and proportional–integral (PI) model. Most of these models tried to interpret the hysteresis model and apply it to a very high-precision position control system. 28 These models are too difficult to apply in a real-time control because of the heavy computation for each cycle time. Moreover, the precise positional control of the PMA is beyond the scope of this work. Instead, force–pressure control is considered because of the characteristic of the unloading system that does not require a highly precise unloading force value. Control design in this study considers a simplified linear model so that the controller can reduce the computing time in each cycle.
Identification of a simplified linear model for a PMA
In this section, a PMA model is simply obtained by a linear identification method. The aim of this identification procedure is to derive a simple model that describes preliminarily the behavior of the PMA. From that information, a proportional–integral–derivative (PID) controller is designed and adjusted. An experiment was set up for the dynamic system identification. The experimental setup was similar to the experiment for investigating the mechanical properties of the PM. 20 This means that the object muscle was fixed to both tips in the nominal length of the muscle at the test-bed, as shown in Figure 3. A step function pressure signal was supplied inside the muscle. The measurement system would collect the force responded by the muscle. After that, the sinusoidal pressure signals were also supplied in several frequencies. In all experiments, the sampling frequency was set at 1 kHz. The aim of these experiments was to validate the estimated model later. Then, the collected results were analyzed using MATLAB for identifying a model using the integrated linear model identification module. For simplicity, the transfer function model with no zeroes and two poles was selected.

The test-bed is used for investigating the characterization of muscle and identifying the transfer function model for pneumatic muscle actuator.
The continuous linear transfer function is represented by

where Y(s) and U(s) are the output signal and input signal in the frequency domain, respectively. a0, a1, a2, and b0 represent four coefficient parameters of the denominator and numerator in the polynomial.
Table 1 represents the parameters estimated for the PMA model considering force and pressure. Figures 4–6 show the fitting of the PM model and the measurement data. The calculation showed the fit to estimated data up to 87.7%. The fourth-order transfer function model was also considered with data fitting up to 94%. However, the higher the order of the transfer function, the greater the difficulty in the control design step and a longer time computing compared to the real-time system. In this study, for simplicity, the lower order transfer function model for the PM was selected.
The estimated parameters for the continuous model using MATLAB.


Step response of the model and the actual system.

Comparison between the estimated force from model and the measurement force from muscle at frequency of 0.2 Hz.

Comparison between the estimated force from model and the measurement force from muscle at frequency of 0.5 Hz.
In Figures 5 and 6, the comparison between the estimated model and measurement data in the case of the reference data is a sinusoidal wave inputted at different frequencies. We could see that the model shows its capacity fitting well with the real system, especially at low frequency. At high frequency, the model still shows it fits quite well with the real data; however, the error is larger. Figure 7 shows the approximation of force–pressure relation from the derived model and actual force–pressure relation from the real system. The input signal frequency increases from left to right at 0.1, 0.2, and 0.5 Hz. We could see that the PMA shows the high nonlinear behavior at high frequency, and the linear model could only describe correctly at some segment of the real system. However, the simulated behavior of the linear model, in general, could be accepted in the cases of low frequency. In addition, the main goal of the identification step is only to derive the primality information of the dynamic behavior of the PMA, so the simple approximated model is acceptable in this case. The key point is that the derived model is very simple so it would be easily implemented in real-time devices with very limited resources.
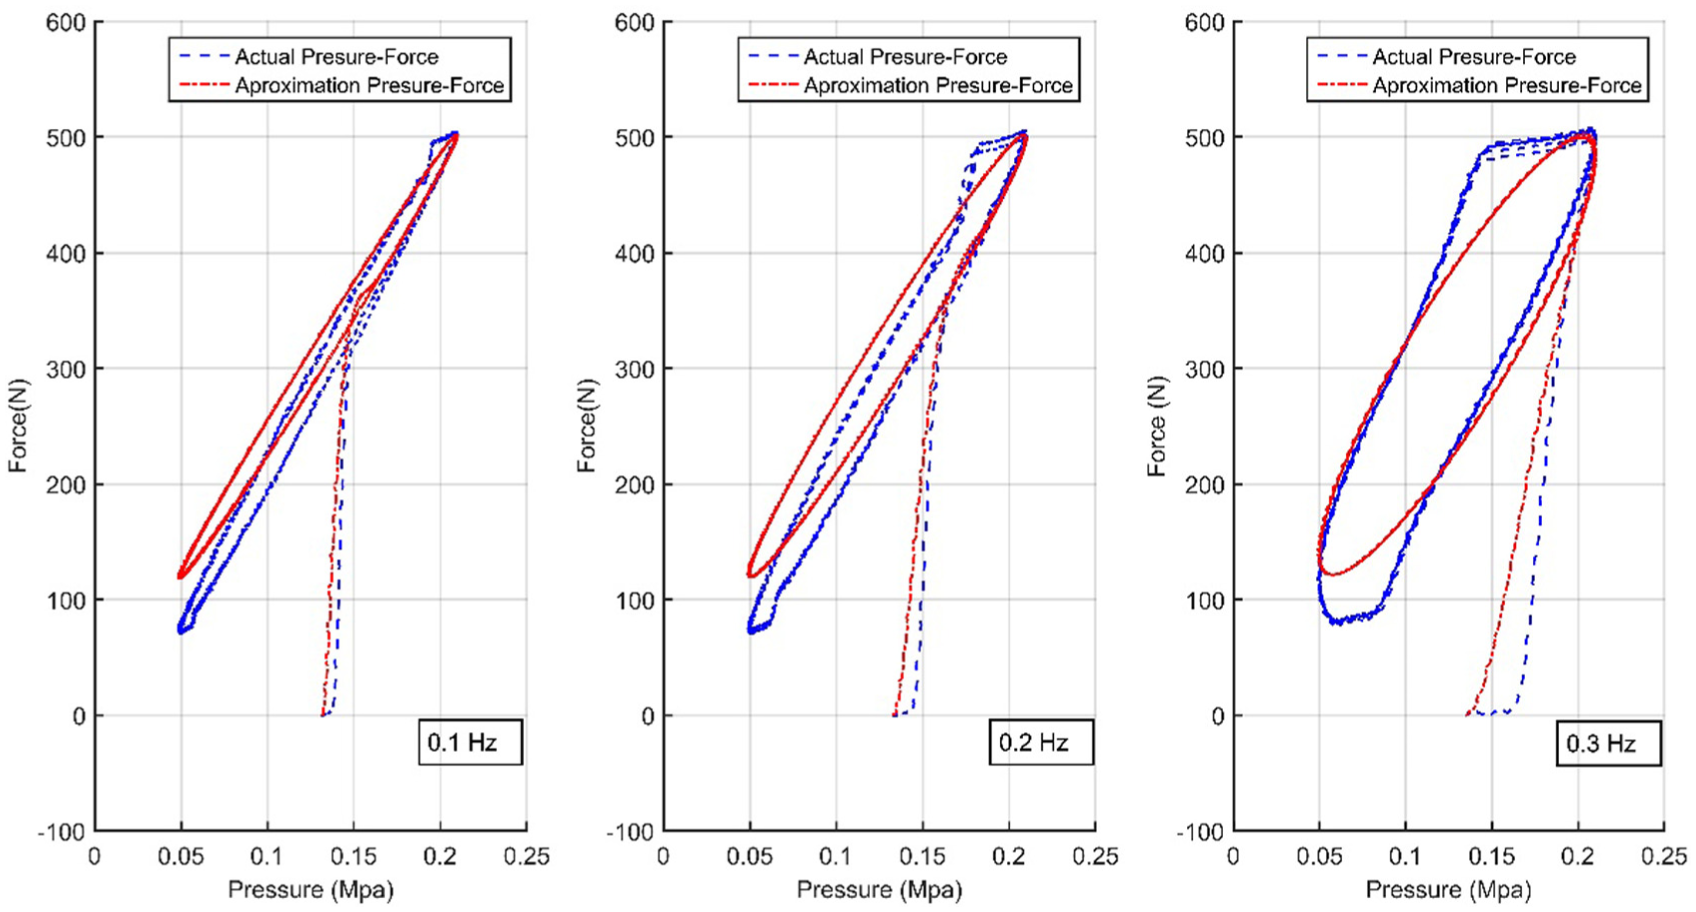
The approximation of force–pressure relations from the derived model and actual force–pressure relation from the real system. The input signal frequency increases from left to right at 0.1, 0.2, and 0.5 Hz.
COP tracking model for the BWS system
The COP tracking model is ideally based on the moving COP of the subject while walking. In Figure 8, the COP trajectory of a human in one gait cycle is represented. Particularly, the COP of a human, for example, is located at the left leg of the subject; when the left leg enters into a swing state, the COP switches to the right leg. The subject’s COP will travel along the stance phase on the right leg until the right leg enters into the swing state, and at the same time, the left leg enters into a stance state. The COP will again switch to the left leg and the process is repeated in every gait cycle during human walking. The movement of the COP is redrawn as shown in Figure 8 on the right side. In the new BWS system, we used four PMs that are positioned symmetrically at the four corners of the subject’s walking space. The total force is generated from four muscles equal to the desired unloading force; however, by modulating the amplitude of the generated force of a single muscle, we could change the virtual application point of the total unloading force. Ideally, the COP tracking model is applied so that the virtual application point of the unloading force on subject’s trunk would follow the moving COP point during walking. In this study, only the moving COP in the frontal direction (COP-x) is considered. When the COP switches to the right side, the generated force from the muscles on the right will increase, and the force from the muscles on the left will decrease and vice versa. The single-input-single-output (SISO) PID controller is applied to control the generated force from each muscle actuator. The PID parameters initially are designed based on the identified model of PMA. After that, the PID gains are adjusted manually to be suitable with the real working condition with each muscle.

Demonstration of COP movement in force plate.
Experiment validation
Three healthy subjects with no history of disability took part in the experiment validation. The validation experiments were designed including a new BWS system and counter weight system (the old one) for comparison. We conducted these experiments to determine the intrinsic differences between the counter weight system and the proposed model of the new BWS systems. For each BWS system, we performed experiments with different body weight unloading forces, mainly 20%, 30%, 50%, and 70% weight support. The data were collected at a speed of 1 km/h for 60 s of treadmill. The data for the normal walking (0% weight supported) were also recorded for comparison. The data collected were analyzed based on MATLAB and R software. The reaction force and COP data were calculated by the signal recorded from the force sensors integrated under the treadmill. The motion capture system (from Motion Analysis Corporation) with six cameras was also used to collect data from 12 markers positioned at the ends of the bone of lower limbs, pelvis, and shoulder of the subject’s trunk. The data collected from the motion capture system were used to calculate the COM moving. The raw data were then passed through the low-pass filter; the cut-off frequency was set at 10 Hz. After that, COP and COM trajectories were separated to single COP and COM trajectories in one gait cycle using MATLAB. The paired test using R software was used to investigate the difference in the results between the weight support system and normal walking.
Experiment result
Reaction force and unloading force
Figure 9 shows the reaction forces recorded when the subject walked on the treadmill under an unloading force of 30%, 50%, and 70%. In Figure 9, the blue line represents the reaction force when the subject was walking using the new BWS system. The green line represents the reaction force when the subject was walking using the counter weight system, and finally, the black line is for normal walking. The reaction force in normal walking (0% weight unloading and subject did not wear the harness) is for comparing between weight support systems and locomotion posture at which the subject felt most comfortable. We could see that both the new BWS system and counter weight system modify the subject’s reaction force and make the reaction force pattern deform. When the weight support level is increased, the deformation of the reaction force patterns is also increased. This change in the reaction force pattern is because at high levels of weight support the subject would find it difficult to touch the whole sole (including both heel contact and toe off) on the treadmill. Moreover, the larger weight support also strongly affects every gait parameter, so it would be difficult to say that the reaction force would have scaled the pattern form from normal walking. In general, we may see that the weight support systems had a less modified reaction force at lower levels of weight support. Intuitively, we also may see that the reaction force at low and medium weight supports for the BWS system looks like a better reaction force pattern compared to the counter weight system. However, the differences in the reaction force patterns are not clear between the two weight support systems.

Reaction force (Fz) when applying weight systems. The black line is the reaction force at 0. The blue line is the reaction force using the new BWS system and the green line is the reaction force using counter weight system. From the top to the bottom, the weight support level is 30%, 50%, and 70%, respectively.
For analyzing, the reaction force in case of normal walking is scaled 0.7, 0.5, and 0.3 times so that it equivalents to reaction force in case of weight support level at 30%, 50%, and 70%. After that, the difference in the reaction force between the case of using weight support system and normal walking is calculated at each level of weight support. The paired t-test is applied to investigate the difference among reaction force trajectories. In Table 2, the mean difference expresses the difference in the reaction force pattern in the case of applying a weight support system with the reaction force pattern in normal walking (scaled to the percentage of weight support for analyzing). We could see that actually every reaction force pattern differs from the reaction force pattern in normal walking; what we consider here is how great the difference is. In the case of the low-level weight support, every reaction force difference is about 10–15 N. The difference by the BWS is a little bit larger than the case of the counter weight system. At high levels of weight support, the difference in the reaction force increases for both the cases of the weight support systems. However, the difference by applying the counter weight system is significant. This is due to the “pendulum effect” increasing strongly at high levels of weight support.
Comparison of reaction force between the BWS system, counter weight system, and normal walking by paired t-test.

SD: standard deviation; SE: standard error; CI: confidence interval; BWS: body weight support.
p < 0.001.
In Figure 10, the error bar expresses more clearly the mean difference in the reaction force patterns of the subject walking in case of weight support in comparison to the reaction force in normal walking. In Figure 10, the vertical axis represents the difference in the reaction force patterns; the closer to 0 of the difference is the more agreement between two patterns. The negative value expresses the lower amplitude of the pattern to the reference pattern; the positive value expresses the higher amplitude. The horizontal axis expresses the weight support level. We can see that in the case of using the BWS system, the difference is increasing steadily with small amounts because the weight support level increases. However, in the case of using the counter weight system, the difference is extremely large when the weight support level increases. These results also confirm that the pendulum effect strongly affects the gait parameters at high-level weight supports.

Demonstration of the difference in the reaction force patterns when using the weight support systems in normal walking (difference = Fz by weight support system − Fz by normal walking).
In Figures 11 and 12, the adaptation of the unloading force is represented for the left side. The reference input signal (named Refinput) represents for the desired left side unloading force which depends on the moving of COP position. As the COP changes to the left side, left leg changes to the stance phase, and the unloading force also rises to the peak. This rise is very fast because the COP switches sides very fast. When the left leg is on the stance phase, the COP takes time to travel along the sole from the heel to the toe, and therefore, the unloading force is kept at a constant. When the COP switches to the right, the locomotion posture changes the left leg to the swing phase and the unloading force on the left side quickly decreases. The same calculation is applied for the desired unloading force in the case of the counter weight system. The blue line represents the actual unloading force recorded by the left load cell mounted on the left hardness bell. We may see that the actual force tries to follow the desired unloading force in Figure 11. For Figure 12, the actual force does not follow the desired unloading force; instead, it tries to stay constant. In addition, we could see in Figure 11 that the reaction force is delay in comparison with the desired signal. The time delay between the reference signal and the feedback signal represents the limitation of the PID controller. In future work, a more accuracy model of PMA and an advanced control system such as adaptive control system will be applied to overcome this limitation.

The adaptation of the unloading force for the BWS system on the left side. The red line represents the desired unloading force (named Refinput), while the blue line represents the actual force.

The adaptation of the unloading force for the counter weight system on the left side. The red line represents the desired unloading force (named Refinput), while the blue line represents the actual force.
COP trajectories
In Figure 13, the COP trajectories are represented with a weight support of 30%, 50%, and 70% of the unloading subject weight using both types of weight support systems. We also calculated the COP in the case of normal walking to give a graphical real COP path without a weight support system at which the subject felt most comfortable. In Figure 13, the black line represents the COP trajectory without the unloading force while blue and green lines represent the COP trajectories for the counter weight system and the new BWS system, respectively. From Figure 13, we can see that the COP trajectory of the subject, using the active BWS system, is more similar with respect to normal walking than the other. Especially, in the lower level of the unloading force, the active BWS system shows its best behavior compared with the counter weight system. On the other hand, the results show significant differences between the COP trajectories of the subject’s normal walking and the case of using the counter weight system (considered to be in the x-direction). When considering COP paths of BWS systems and the counter weight system in the higher levels of the unloading force, the difference in the COP paths is reduced. This is because at the larger levels of weight support, the subject would find it difficult to touch the whole sole, especially the heel contact, so the COP path is deformed and the result is that it may be difficult to see the difference between them.

COP trajectories of unloading subject weight. Black line represents the COP with normal walking, the green line represents the counter weight system, and the blue line represents the BWS system. From left to right, the weight support is 30%, 50%, and 70%, respectively.
We consider the effect of the BWS system on the COP in the frontal direction because using the COP tracking model will significantly affect this direction. In Table 3, we can see that at low levels of weight support, the COP trajectory in the x-direction is almost in agreement with the case of normal walking. The mean difference between the weight support system and normal walking here is around 0.001 m. At higher levels of weight support, the COP, by applying the BWS system, is higher than the case of applying the counter weight system. This is because the unloading forces by the new BWS system activate at two positions on the subject’s body, which differs from the case of counter weight system (the unloading force is applied at one position in the middle). However, at very high levels of unloading force, because the trunk is swung, the COP trajectory in the case of the counter weight system is much different compared to normal walking. The COP trajectory by applying the BWS system is not affected by the pendulum effect so we can see that the trajectory is not different compared to normal walking. The difference in the COP in the x-direction (frontal direction) when applying the weight support systems is shown more clearly in Figure 14. In the case of using the counter weight system, the difference is increased following an increase in the weight support level. In the case of 50% weight support level in Figure 14, the mean value of BWS system is a little higher than counter weight system;; the reason for this is due to the limitation of counter weight system in which it is difficult to have a counter weight selection to reach 50% of weight support level for the representative subject. Therefore, the weight support level in counter weight system case is slightly lower than BWS system, and the mean difference is also smaller. In the case of using the BWS system, in almost all trials, the COP in the x-direction is closer to normal walking than the case of counter weight system.
Comparison of COP in the x-direction between the BWS system, counter weight system, and normal walking by pairedt-test.
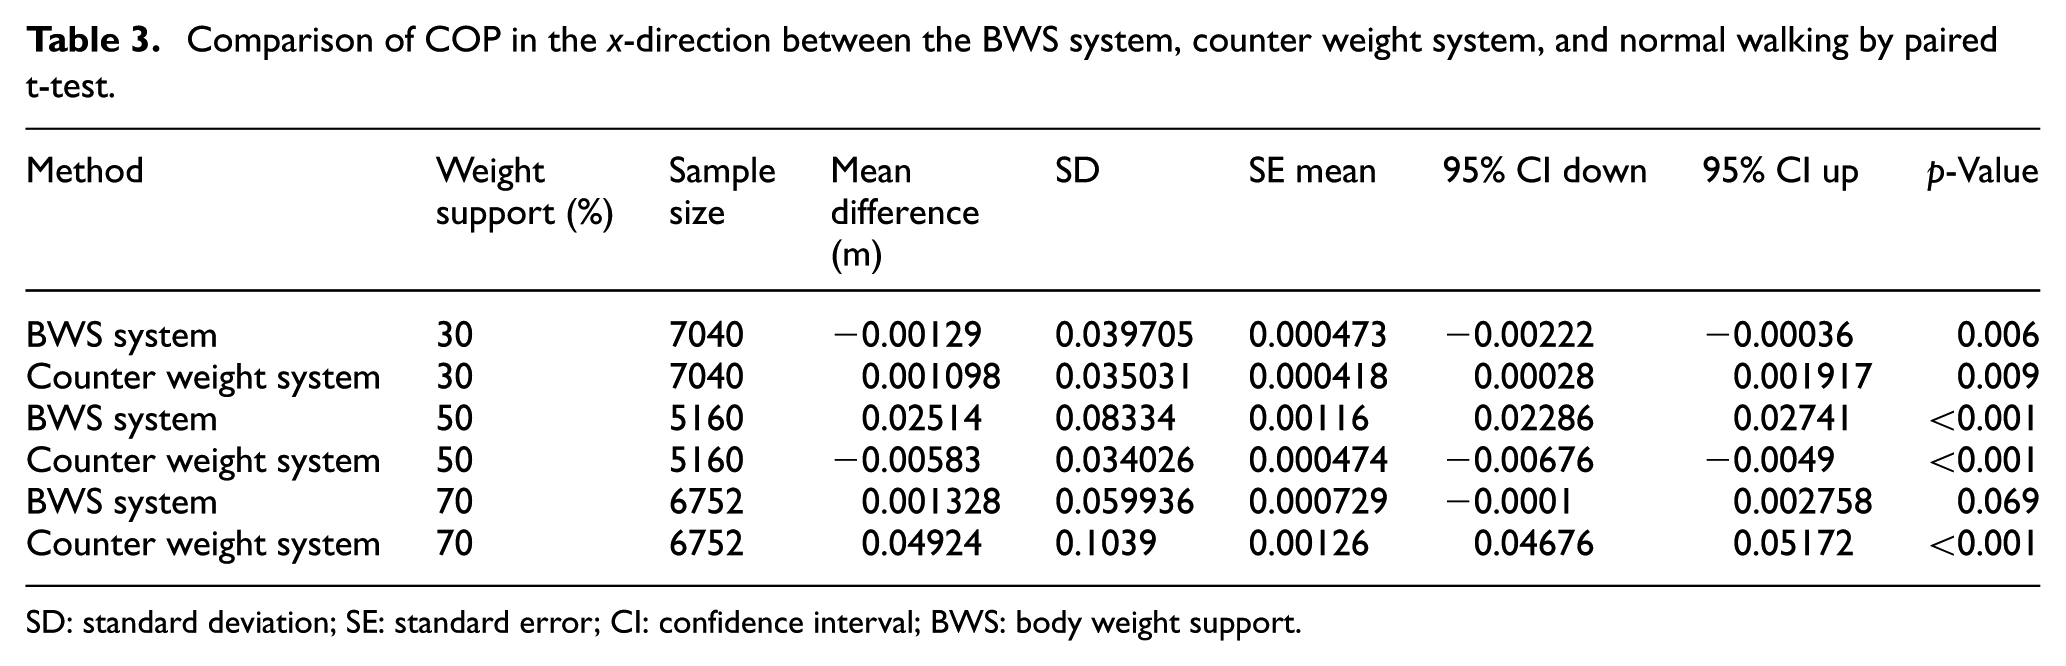
SD: standard deviation; SE: standard error; CI: confidence interval; BWS: body weight support.

Demonstration of the difference between COP trajectories in the frontal direction when using the weight support systems and normal walking (difference = COP by weight support system − COP normal walking).
COM movements
Figure 15 represents the COM trajectories in the vertical direction (COMz). In Figure 15, the black line is the COM in case of normal walking. The blue line is the COM using the new BWS system while the green line is the COM using counter weight system. The weight support level is 20%, 30%, and 50%, respectively, from up to down. We could see the effect of the BWS system and counter weight system on the COM trajectory in case of normal walking. When the subject walks using the weight support system, the increase in weight support level makes the altitude of the COM increase. In the case of using the new BWS system, it still maintains the sharp for every case of weight support level. However, for the case of using counter weight system, it looks like a fluctuation is added to the COM trajectories at the high level of weight support. In Table 4, the comparison of the differences between the COM in the vertical direction between the weight support systems and normal walking is shown. The results are derived from the paired test using R software. Considering the COM in the z-direction, we can see that the difference increases when the weight support level is increased. Considering the standard deviation (SD) of the difference between the COM trajectories, we can see that the variances of the mean difference in the COM by applying the BWS system for every level of weight support are quite stable at about 5 mm. The variance of the mean difference when applying the counter weight system is always greater than the case of applying the BWS system. At high levels of weight support, the variance by applying the counter weight system is much greater than the case of using the BWS system. This happens because at high levels of weight support, the larger weight support levels will make the dynamic force bigger due to an increase in the inertia of the counter weights. This variance could make the subject uncomfortable during walking under high levels of weight support with the counter weight system. In contrast, the effect of the dynamic force due to inertia on the BWS system is 0; instead, the unloading force generated by the BWS system will adapt to the subject’s movement, and the subject will feel comfortable walking under the BWS system.

COM trajectories in vertical direction (COMz) when applying weight systems. The black line is the reaction force at 0. The blue line is the reaction force using the active system and the green line is the reaction force using counter weight system. From up to down, the weight support level is 20%, 30%, and 50%, respectively.
Comparison of COM in the z-direction (longitudinal) between the BWS system, counter weight system, and normal walking by paired t-test.

SD: standard deviation; SE: standard error; CI: confidence interval; BWS: body weight support.
p < 0.001.
Figure 16 demonstrates the variance of the differences in the COM trajectories in the vertical direction when applying the weight support systems to the COM trajectory in normal walking. The vertical axis expresses the mean difference with SD; the horizontal represents the weight support level. The gray dot represents the BWS system and the white dot represents the counter weight system. We can see that the segments of the SD are increased because the weight support levels increase, and at every weight support level, the segment of the SD by the counter weight system is always longer than when using the BWS system. In this result, we could say strictly that the COM trajectories in the vertical direction using the counter weight system are more varied than the case of using the BWS system.
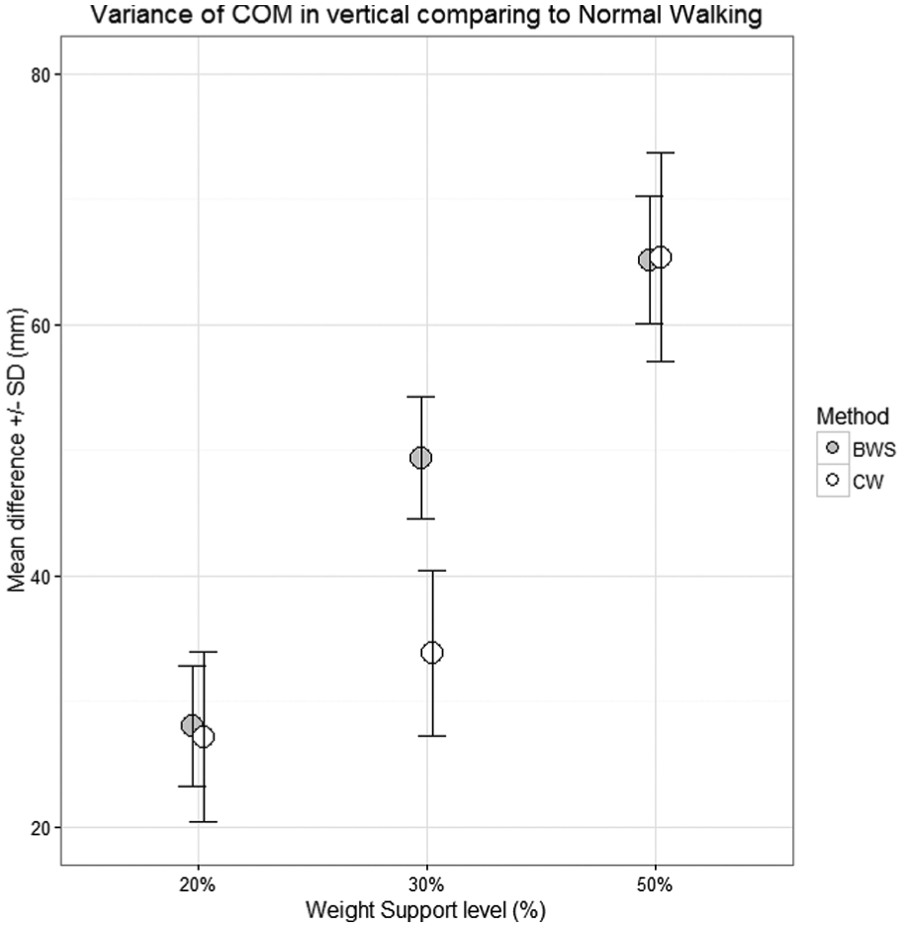
Demonstration of the variance of differences in COM trajectories in the vertical direction when using the weight support systems to COM trajectory in vertical direction in normal walking (difference = COM by weight support system − COM normal walking).
Discussion and conclusion
Based on the experimental results performed with two BWS systems, we conclude that the novel BWS system successfully realizes weight support. Furthermore, one of the most important points of the proposed BWS system is that the new system could follow the COP during a subject’s walk and provide the desired unloading force. Therefore, the generated unloading force by the new BWS system could make the subject more comfortable than the counter weight system. The fact is that in almost all the experiments, the subject always confirmed that the new system provided more comfort compared to the counter weight system.
The first advantage of the novel BWS system is that it could easily tune the weight support level to the desired unloading force. The new BWS system, using PMAs, is an active system where the unloading force can easily be tuned by changing the pressure of the input compressed air. The counter weight system has its own limitation of tuning the weight support level; the high level of the unloading force made it difficult to catch up correctly to 70% unloading support. Then we could see that the reaction force was a little bit larger than for the BWS system case. However, the reaction force pattern generated using the counter weight system was still deformed. Furthermore, using up to four muscles for the BWS system, we could easily modulate the generated force for each. Therefore, the total unloading force then could change the virtual application point such that the system tries to track the COP of the subject during walking. We also get the desired unloading force that follows the movement of the COP. In Figure 11, we can also see the limitation of the PID control algorithm for the new system as the time delay for the generated unloading force was still large; however, we believe that the new system still meets the basic criterion of a BWS system.
The second advantage is that the system prevents the pendulum effect during walking that often happens when using conventional BWS systems that use cable–pulley apparatuses. Many common BWS systems use a rope as a connection between the subject and the actuator.10,12,13,17 The COM patterns using the BWS system were also stable and were less variable than were represented by the SD error for every gait cycle recorded. On the contrary, the COM paths using the counter weight system greatly changed and varied, especially at the higher levels of weight support; the COM even added a fluctuation along every gait cycle. The reason for the added fluctuation to the COM path could be explained by the pendulum effect which often occurred at the conventional BWS system using the pulley–rope apparatus. For the high variance of the COM applying to the counter weight system, this variance happened due to the dynamic character of the counter weight. This counter weight used for the unloading system was always moving like an oscillation during walking. This oscillation added a bit more force to the unloading force, therefore affecting the COM movement. In the new BWS system using PMs, this effect is removed such that the gait training is totally more comfortable for the subject. The other advantage of the BWS system using PMAs is that the unloading force directly acts on the subjects and does not use any intermediary apparatus. This makes the system very simple and easy to develop, improve, and it is also easy to apply the suitable therapy strategy based on weight support.
In future work, we will focus on giving more freedom to the patient especially by considering also the oscillation on the y-axis to get a full COP tracking model. The control strategy for the PM will also be considered to get the most precise unloading force tracking which could make the results even better.
Footnotes
Academic Editor: Rui Ruben
Declaration of conflicting interests
The author(s) declared no potential conflicts of interest with respect to the research, authorship, and/or publication of this article.
Funding
The author(s) disclosed receipt of the following financial support for the research, authorship, and/or publication of this article: This work was supported by JSPS KAKENHI Grant Number JP25282161.