
Abstract
With the emergence of connected vehicle technologies, the potential positive impact of connected vehicle guidance on mobility has become a research hotspot by data exchange among vehicles, infrastructure, and mobile devices. This study is focused on micro-modeling and quantitatively evaluating the impact of connected vehicle guidance on network-wide travel time by introducing various affecting factors. To evaluate the benefits of connected vehicle guidance, a simulation architecture based on one engine is proposed representing the connected vehicle–enabled virtual world, and connected vehicle route guidance scenario is established through the development of communication agent and intelligent transportation systems agents using connected vehicle application programming interface considering the communication properties, such as path loss and transmission power. The impact of connected vehicle guidance on network-wide travel time is analyzed by comparing with non-connected vehicle guidance in response to different market penetration rate, following rate, and congestion level. The simulation results explore that average network-wide travel time in connected vehicle guidance shows a significant reduction versus that in non–connected vehicle guidance. Average network-wide travel time in connected vehicle guidance have an increase of 42.23% comparing to that in non-connected vehicle guidance, and average travel time variability (represented by the coefficient of variance) increases as the travel time increases. Other vital findings include that higher penetration rate and following rate generate bigger savings of average network-wide travel time. The savings of average network-wide travel time increase from 17% to 38% according to different congestion levels, and savings of average travel time in more serious congestion have a more obvious improvement for the same penetration rate or following rate.
Keywords
Introduction
The network mobility of large cities in China has not been effectively improved, and network congestion condition appears due to the deterioration trend in spatial–temporal dimension, which further results in the inconvenience of travel and the increase in travel cost. According to the report of China’s Ministry of Transport, network congestion causes the reduction of 20% in per capita disposable income of urban residents, which is equal to the loss of 5%–8% in annual gross effective alternative solution for traffic management department.1,2
Traditional research on network guidance is often focused on prediction of network flow,3–5 dynamic traffic allocation,6–8 and route guidance strategies.9,10 Many scholars attempt to solve the guidance issue of network flow and propose various guidance model using the neural network, fuzzy theory, heuristic algorithm, and so on. Connected vehicle (CV) technology provides a better method for the implementation of network guidance, which is a domestic product. Route guidance can dynamically allocate the travel route according to network volume and realize the spatial–temporal equilibrium of flow distribution. Due to the delay in information release of variable message sign (VMS), the performance of route guidance would be affected. The emergence of CV technologies provides and dramatically enhances the real-time guidance effect of network flow and improves the mobility and reliability of network-wide travel time (NTT). At present, there are some limitations in the related studies, such as (1) some guidance strategies are designed based on the assumption that the variables in the proposed model have already obtained by CV technology and (2) the impact of guidance on travel time is analyzed based on the unrealistic CV environment, and the simulator cannot realize the simulation of interaction between guidance information and network flow considering the communication properties.
Although many studies and reports have indicated the potential positive impacts of CV on enhancing NTT, little works have been conducted to quantify these benefits considering realistic communication attributes of CV environment, for example, information path loss. In addition, most of previous studies examine the impact of CV guidance using VISSIM/PARAMICS. Although these studies considered the influence of penetration rate (PR) on mobility, they did not reflect the interdependent relationship between traffic flow and communication networks and cannot realize the impact of communication properties on guidance information, such as path loss and shadow fading. A better performance simulation tool is needed to validate CV technologies. In this article, CV guidance scenario is established using new CV simulation architecture based on one engine, and the impact of CV guidance on NTT is studied. The remainder of this article is organized as follows. The following section provides a brief review on research related to this study. Section “Establishment of CV guidance scenario” describes in detail the CV simulation architecture and the establishment of CV guidance scenario through the use of an application programming interface (API). Section “Simulation results and discussion” analyzes comparatively the impact of the affecting factors, such as PR, congestion levels (CLs), and following rate (FR), on NTT in CV guidance scenario and non-CV guidance scenario. In the end, this research effort will be concluded with findings and recommendations.
Literature review
Various traffic flow models are proposed to analyze the interaction between traffic information and travel time.11–14 This section describes related literatures that investigated the impact of CV guidance on travel time. JS Oh and R Jayakrishnan 15 examined the impact of advanced traveler information system (ATIS) on travel time. The simulation results show that the average NTT will reduce by about 25% when 40% of drivers have received the real-time information. KK Hoe 16 also proposed a decentralized ATIS under the CV environment, which introduces automatic incident detection (AID) function to reinforce the performance of ATIS. The findings indicate that the ATIS using V2V communication is efficient in saving drivers’ travel time, and AID plays an important role in improving the effectiveness of the system. EL Paikari et al. 17 examined the impact of advisory speed recommendation and rerouting guidance for urban freeways under various load conditions on travel time. Next, E Paikari et al. 18 demonstrated the impact of deploying CV considering rerouting guidance and advisory speed for upstream and downstream traffic. The simulation results show that CV technology accompanied by VMSs can improve the travel time by 30%–40% when PR of CVs reached 50%. A Olia et al. 19 quantitatively assessed the potential impacts of the CV on mobility, safety, and the environment and examine the effects of providing real-time routing guidance and advisory warning messages to CVs. The results demonstrate the potential of CV to improve mobility, enhance safety, and reduce greenhouse gas (GHG) emissions at the network-wide level. Travel time has a reduction of 37% when the PR of CVs accounts for 50% compared with the non-CVs case.
CV guidance is an extremely useful approach for the improvement of travel time during non-recurrent congestion condition. The potential benefits of CV guidance during incident condition have been studied in the literature. J Lee and B Park 20 evaluated various route guidance strategies in the CV guidance environment considering the effect factors such as PR of CVs, CL, update intervals of route guidance information, and drivers’ compliance rate. The results indicate that CV guidance significantly reduced travel time over the non-CV guidance case and averaged link travel time–based guidance produced the best performance. Network travel time on average reduced by 29% and 48% when CVs PR reached 30% and 70%, respectively. L Kattan et al. 21 conducted a simulation research on assessing the benefits of V2V communication in mitigating traffic congestion resulting from extreme conditions, such as adverse weather conditions. Two Paramics APIs are developed to simulate the generation of incidents and the dissemination of V2V communication between V2V vehicles. The impact of PR and CL on savings of travel time is also studied. The results demonstrate the overall effectiveness of V2V in improving network travel time for high- and moderate-level congestion scenarios. However, there is an assumption that an informed driver will increase his or her awareness and decrease aggressiveness to the extreme level. J Lee and B Park 22 investigated the impact of variable speed limit (VSL) on traffic congestion mitigation under CV environment. Simulation experimental results show that CV-powered VSL improves the traffic congestion up to 7%–12% depending on CV PR.
Establishment of CV guidance scenario
To realize the functions of CV guidance and assess, a new architecture suitable to the simulation of CV technology is developed and introduced, as shown in Figure 1. The architecture consists of one simulation engine, CV application interface (API), graphical user interface (GUI), and file libraries. CV applications are developed through CV API using C++. The simulation engine consists of two agent groups: communication agent and intelligent transportation systems (ITS) agents. The communication agent is responsible for the configuration of protocol stack, Linux kernel stack, and transmission control protocol (TCP) command set. The ITS agents include Car Agent, Signal Agent, and RSU Agent, which are used to control the vehicle unit, intersection signal unit, and roadside unit (RSU), respectively.

CV architecture.
In CV applications, three agents are often used to design the scenario and traffic model. These agents are explained in detail as follows:
Car Agent module. The Car Agent module is used to control the mobility of associated vehicles during simulation and interpret the different car trajectories to control the speed, acceleration, and deceleration of the vehicles. A Car Agent module can obtain information from signal and vehicle databases that communicate with the command server through network packet API and vehicle/signal API. These APIs are TCP or User Datagram Protocol (UDP) based over the simulated network.
Signal Agent module. The Signal Agent module is used to control the standard penetration test (SPT) of traffic lights at an intersection. The Signal Agent uses the intersection SPT API to retrieve the signal database and obtain the SPT of traffic lights from the command server located in the simulation engine.
RSU Agent module. The RSU Agent module is used to control the RSU and transmit information between the RSU and vehicles near the RSU using V2I communication. The RSU Agent module may access the signal and vehicle database in the command server via the intersection SPT API and vehicle/signal API.
Compared to existing simulators, the main advantages of the CV architecture include the following: (1) the architecture can simulate the time synchronization of traffic flow and communication network in one simulation engine; (2) the architecture also allows C/C++ programming in the CV environment using its API interface; and (3) the architecture has the useful capability of simulating communication networks. V2X communication protocols, such as 802.11b and WAVE, can be used to model signal attenuation in urban and rural environments to analyze the effect of various obstacles on data transmission. Due to the complexity and unpredictability of CV environment, V2X communication could produce serious communication delay and packet drop which would affect the performance of information transmission. Therefore, communication properties should be considered when validating CV technologies. The studies above mentioned did not consider the practical issues of communication and assumed perfect and real-time information sharing among vehicles and roadside equipment.
During simulation of CV applications, the different situations are established through adjusting the simulation parameters in CV architecture, including the coverage of road networks, the vehicle settings, the space environment, and the communication attributions. The vehicle settings include the maximum velocity, the acceleration range, and PRs. The space environment mainly consists of fading factor, path loss factor, and building properties. The communication attributions include frequency, bandwidth, and protocol.
Using the CV architecture, the CV guidance scenario for network flow is established, as shown in Figure 2. The network is composed of three routes of two-lane two-way and four T-shaped intersections, and the network parameters are listed in Table 1. As shown in Figure 2, four RSUs IA-RSU, IB-RSU, IC-RSU, and ID-RSU are installed in exit approach lane of intersection A, B, C, and D, respectively, which are used to collect volume of each lane and transmit the volume to center roadside unit (C-RSU). Then, the C-RSU calculates the traffic impedance of each route through the impedance function and obtains the shortest time route based on the comparison of various alternate routes. The guidance information from the C-RSU is transmitted to the RSU of each intersection, and each intersection RSU is responsible to broadcast the guidance information to the approaching vehicles of according intersection.

The CV guidance simulation scenario.
Simulation scenario characteristics.

Vehicles in simulation scenario are composed of CV and non-CV. CV is able to receive the traffic information from other CV and RSU within the range of dedicated short-range communication (DSRC) (capped at about 100 m in this article) and broadcast real-time information, for example, guidance information of incident and lane closure. Non-CV can also reroute in response to congestion because of familiarity with the network and visibility of congestion.
To measure the effect of guidance information on NTT, a broken vehicle (BV) is modeled in CV guidance scenario. During simulation, BV can broadcast the real-time incident duration and position. In case of an incident, CV in simulation scenario will receive information about the incident and route guidance before approaching and can take alternate routes (Route 2 and Route 3 in this article) suggested by intersection RSU. In contrast, non-CV will travel on the initial route (Route 1) and result in delay and increase in travel time. But some non-CV with familiar drivers can also reroute with the lower rate compared to CV according to their observation and experience.
For each link in a road network, there is a function reflecting the relationship between resistance and volume of traffic. A common link congestion function, Bureau of Public Roads (BPR) cost function, is selected, which we will be termed as ti

where ti is the impedance of route i according to volume xi, i = 1,2,3;
Using the CV simulation scenario, vehicles in network will choose the shortest time route to travel according to the guidance logic. Figure 3 shows the rerouting logic in CV guidance scenario.

Diagram of CV guidance logic.
In this article, three effect factors of average NTT are used in the CV guidance experimental design, including market PR, FR, and CL. The savings of NTT in CV guidance scenario is likely to depend on the rate of CV, and four PRs are considered in simulation. The performance of CV guidance also depends on driver’s familiarity with the network and visibility of congestion. FR is introduced and defined as the number of non-CV that will follow leading vehicle to reroute in response to guidance information divided by the total amount of non-CV. Three driver’s FR is selected. It is likely that the CL of network would have a significant effect in the CV guidance scenario. Thus, three CLs, represented as 1, 2, and 3, are selected corresponding to three incident duration, represented as 600, 900, and 1200 s, respectively. Longer incident duration will generate severer congestion and correspond to higher CL.
Using the CV guidance scenario, the experiment data, such as travel time per vehicle, are collected by simulation. The experiment design factors and parameter settings in simulation experiment are listed in Table 2.
Description of experiment design factors and simulation parameters.

PR: penetration rate; FR: following rate; CL: congestion level; TX: transmitter.
To fully examine the impact of these selected design factors on average NTT in CV guidance, at least three levels are chosen pre design factor, and all combinations are to be studied. This study evaluates the impact of CV guidance with different factors and levels. Simulation is executed according to the different PR, FR, and CL, and 45 simulations (i.e. 5 × 3 × 3 = 45) are run in whole research. For each simulation, the travel time per vehicle is collected, and average NTT is calculated.
Simulation results and discussion
In this article, the analysis and comparison are conducted to explore the differences in NTT between CV guidance and non-CV guidance. First, the independent t test of the differences in NTT between CV guidance and non-CV guidance is made to identify whether the differences are significant. Then, the average NTT versus coefficient of variation is analyzed. At last, the relationship between the average NTT and affecting factors in CV guidance scenarios is investigated.
Table 3 shows the results of independent t test in NTT of CV guidance and non-CV guidance. As shown in Table 3, CV guidance has lower NTT compared with non-CV guidance. It is easy to understand that CVs in congestion network will reroute in response to guidance. However, vehicles in non-CV guidance have higher travel time. The independent t test indicates that the difference in NTT between CV guidance and non-CV guidance is significant. The guidance in CV guidance scenarios can remarkably reduce the NTT. Moreover, traveling efficiency of network exhibits an improvement trend, and there is an increase about 42% of NTT in CV guidance scenarios, as shown in Figure 4.
Independent t test of NTT.
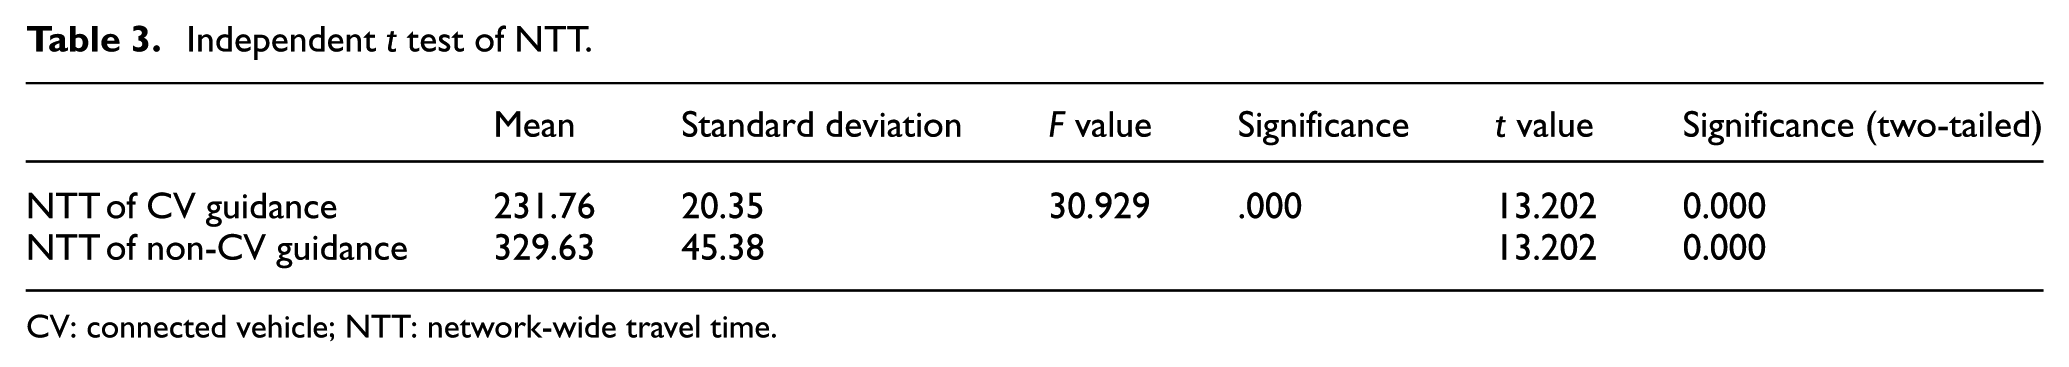
CV: connected vehicle; NTT: network-wide travel time.

Comparison of average NTT in CV guidance and non-CV guidance.
Figure 5 shows the variation with respect to the average NTT. It is can be seen that vehicles in non-CV guidance have higher coefficient of variance than vehicles in CV guidance for the average NTT, which has an increase of 30.88% in average NTT.
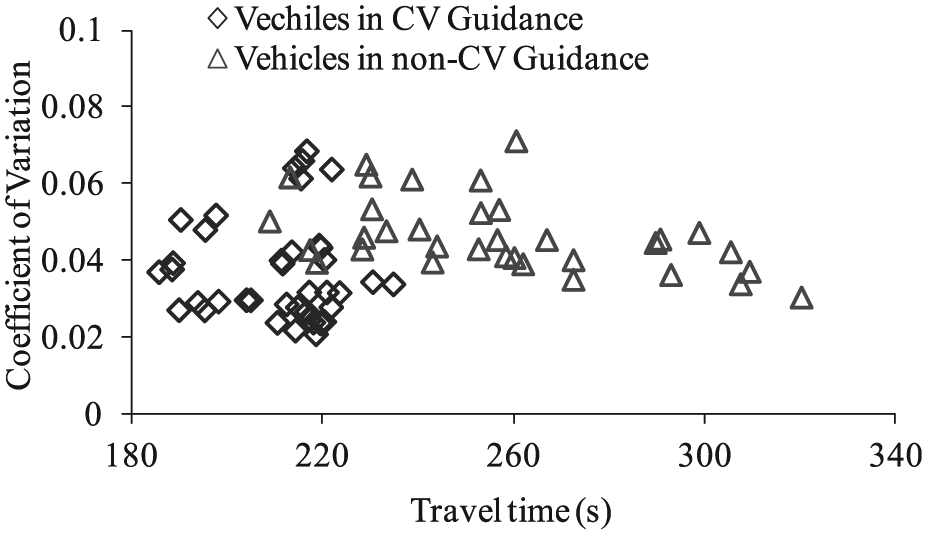
Average NTT versus coefficient of variation.
Route guidance is one of effective traffic management measures for relieving the network congestion, and it is understandable that the performance of route guidance is affected by CL. The different incident duration, namely, different CL, would result in different severity of network congestion and cause different effect on average NTT. Table 4 summarizes performances of CV guidance by CL. The analysis results indicate that average NTT in CV guidance has an obvious improvement compared with non-CV guidance and CV guidance benefits for the savings of average NTT. This may be because guidance is more sensitive to more serious congestion condition as vehicles in more serious congestion will have a higher inclination of choosing reroute in CV guidance.
Summary of performances of CV guidance by CL.

CV: connected vehicle; NTT: network-wide travel time; NATT: network-wide average travel time.
An interesting observation is that savings of average NTT at high CV (CL = 3) shows better performance, and saving of average NTT approaches 20%. As depicted in Figure 6, the percentage benefits over non-CV guidance become larger as the CL increases. This can be explained that CV guidance strategy can play an important role, especially for congested conditions. The findings of this study are consistent with another related study. 20

Average NTT benefit under different CLs.
Previous studies19,20 have explored that there exists a strong correlation between PR and average NTT, and the benefits become larger as the PR of CVs becomes higher. The next step is to analyze the impact of PR on average NTT in CV guidance scenario. In this article, higher PR indicates more vehicles to reroute in response to guidance in CV network. Figure 7 shows the savings of average NTT of vehicles versus the PR in network. The savings of average NTT in severe congestion (CL = 3) has a bigger value compared to the mild congestion (CL = 1) in same penetrate rate scenario. With the increase in PR, the savings of ATT appear as a growing trend, which is getting slower and slower. An interesting observation is that PR of 100% has a negative impact on the average NTT for slight congestion (CL = 1). The finding is consistent with previous related studies.19,23 It is a common sense that more vehicles with communication unit will choose the minimum impedance route to travel, and the average NTT of vehicles in whole network will reduce. The results illustrate that the CV guidance enables to improve the traveling efficiency using the real-time traffic information.
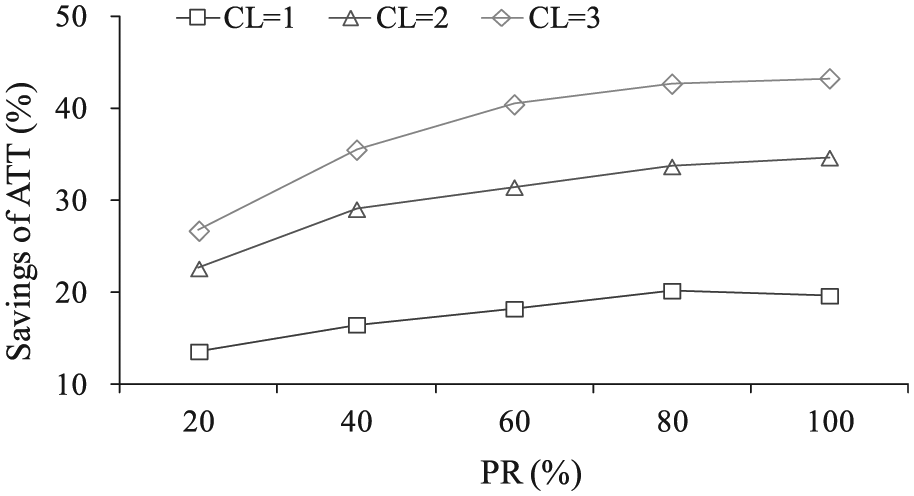
Savings of average NTT versus the PR in different CLs.
Figure 8 illustrates the savings of average NTT versus the FR in different CL. It indicates 16%–40% savings of average NTT in CV guidance scenario. The increasing trend of saving of NTT can also be observed with the increase in the FR, and the trend grows gradually. The savings of average NTT have a bigger value in severe traffic congestion (duration of accident = 300 s) compared to the mild traffic congestion (duration of accident = 180 s). It can be explained by the increase of non-CV vehicles following the leading vehicle to reroute according to their observation and experience.

Savings of average NTT versus the FR in different CLs.
Conclusion
In this article, we focused on the improvements in average NTT in CV guidance scenario. CV architecture was employed as an effective tool to simulate the CV guidance scenario and the resulting average NTT of vehicles. The objectives were evaluating the effect of real-time guidance information on the average NTT and analyzing the savings of average NTT by comparison of CV guidance scenario and non-CV guidance scenario. The PR, FR, and CL were chosen as the effect factors to analyze the savings of average NTT under the condition of different CV guidance. The following results are obtained:
The differences in travel time between vehicles in CV guidance and vehicles in non-CV guidance are significant. Average NTT in CV guidance has an increase of 42.23% comparing to that in non-CV guidance. Moreover, it is found that average travel time variability (represented by the coefficient of variance) increases as the travel time increases.
The savings of average NTT increase from 17% to 38% when the incident duration is in the range of 180–300 s. In severe traffic congestion (CL = 3), the savings of ATT have a more obvious improvement for the same PR or FR.
The PR and FR have a positive effect on the savings of average NTT in CV guidance scenario. Because of the increase in the two above-mentioned factors, the savings of average NTT have an increasing trend. The difference is that the effect of FR on improvement of average NTT has a growing trend gradually.
Finally, further research is needed to assess the impact of varying level of traffic demand and different road network configuration by increasing the length of simulation. The simulation efficiency of the CV architecture is a restraining factor. If a big traffic flow is simulated using the proposed CV architecture, a PC with high-standard hardware configuration is required to improve the simulation efficiency.
Footnotes
Academic Editor: Xiaobei Jiang
Declaration of conflicting interests
The author(s) declared no potential conflicts of interest with respect to the research, authorship, and/or publication of this article.
Funding
The author(s) disclosed receipt of the following financial support for the research, authorship, and/or publication of this article: This article reports work carried out in the project supported by National Natural Science Foundation of China (Grant No. 61473028), Beijing Municipal Natural Science Foundation (Grant No. 8162031) and the National High Technology Research and Development Program of China (“863” Program) (Grant No. 2015AA124103).