
Abstract
This part of the article describes numerical simulations of the problem investigated experimentally. A three-dimensional finite element model of elastic–plastic for sphere falling on beam has been implemented using the nonlinear dynamic finite element software LS-DYNA. From the numerical simulations, it was found that the LS-DYNA is suitable to study complex sub-impact phenomenon, and good agreement is in general obtained between the simulation and experimental results. The numerical simulations show that the initial impact velocity, equivalent elasticity modulus, contact curvature radius of the sphere, and equivalent mass have great influence on the contact–impact time of the sub-impact, and an applicable range of the theoretical expression of contact–impact time of the sub-impact was determined. In addition, the numerical simulations demonstrate the ratios of maximum amplitudes of the first-, second-, and third-order vibrations to the maximum amplitudes of the beam vibrations, and the phase angle of the first-order vibration will change suddenly when the sub-impacts occur. Furthermore, the occurrence conditions of the sub-impacts were clarified numerically. It was found that the occurrence conditions of the sub-impacts can be represented by a mass ratio threshold, and the thickness or length of the beam has also a great influence on the occurrence of the sub-impacts. Once the sub-impacts occur, which would result in an uncertain behavior of the apparent coefficient of restitution.
Keywords
Introduction
In Part I of this article, 1 a 60 × 27.8 × 780-mm simply supported steel beam is impacted by a 70-mm-radius steel sphere for five different initial impact velocities, and three impact positions were tested. From the experimental study, it was found that the sub-impacts take place in most of falling impact processes of the sphere. The impact–contact time of the sub-impact process is at the microsecond-to-millisecond time scale, and the distributions of the sub-impacts are sensitive to initial impact velocity and impact position. However, it is interesting to note that the impact–contact time of the first sub-impact is coinciding well with the theoretical value of contact–impact time derived from Hertz contact law. The impact–contact time of the subsequent sub-impacts is basically consistent with the theoretical values, but oscillates around the theoretical values and which was explained by a revised theoretical formula in consideration of beam vibration. Once the sub-impacts occur, the apparent coefficient of restitution shows strong uncertainty.
As seen, the sub-impacts occurring in the process of sphere falling impact on beam are very sensitive to specific impact conditions, such as initial impact velocity, impact position, material properties, contact curvature radius of the sphere, mass ratio, and the structural dimension of the beam. Thus, it is utmost important that numerical models used in impact problem of sphere falling impact on beam are able to take these effects into account on a larger scale and thus to obtain more insight into the sub-impact phenomenon.
The scope of the numerical study in this article is to investigate the special features and occurrence conditions of the sub-impacts of sphere falling impact on beam when different impact conditions are taking into account. This is done by conducting numerical simulations at a larger scale of the experimental tests presented part I of the article.
Numerical model
The computations were carried out using the commercial software LS-DYNA, which is appropriate for nonlinear explicit dynamic simulations with large deformations. The numerical model was designed with the following components (as shown in Figure 1): simply supported beam, steel sphere, clamp structure, and the supports. The mesh consisted of 387,812 elements of type Solid164. These elements are linear, brick shaped with eight nodes. The element size of contact region used is 0.5 mm in size. The element size ensures numerical converge, that is, further decrease in mesh size does not change the results substantially. Auto surface-to-surface contact with penalty contact formulation was used for defining the contact between sphere and beam. The experimental investigations were supplemented by detailed numerical investigations during the process of sphere falling impact on beam.

Three-dimensional finite element model for the impact of a sphere on simply supported beam.
Comparisons between the numerical and experimental results
Recall from the experimental part of the study that the simply supported beam has a square cross section of b× h = 60 × 27.8 (mm2), and a length of 2L = 780 mm, while the mass and diameter of the steel sphere are 1.401 kg and 70 mm, respectively, in all tests. The steel beam was clamped by two metal clamp holders at both supported ends. The steel beam and the sphere were assumed to be an elastic–plastic material with bilinear isotropic harden. The following material properties were used: the sphere was made of Gr15 stainless steel with density of ρ1 = 7800 kg/m3, Young’s modulus E1 = 208 GPa, and Poisson’s ratio µ1 = 0.33. The plastic modulus of Gr15 steel was taken to be Ep1 = 1820 MPa and the yield strength
Direct comparisons between numerical and experimental results were shown in Figure 2, including the corresponding displacements of sphere ub(t) and beam uM(t) and contact–impact voltage V(t) (or impact force F(t) for numerical simulations). The impact position in the center of the beam was labeled as position A. The impact positions of 130 and 260 mm from the center of the beam were labeled as positions B and C, respectively. The initial impact velocity of the sphere is 2.66 m/s in this case.
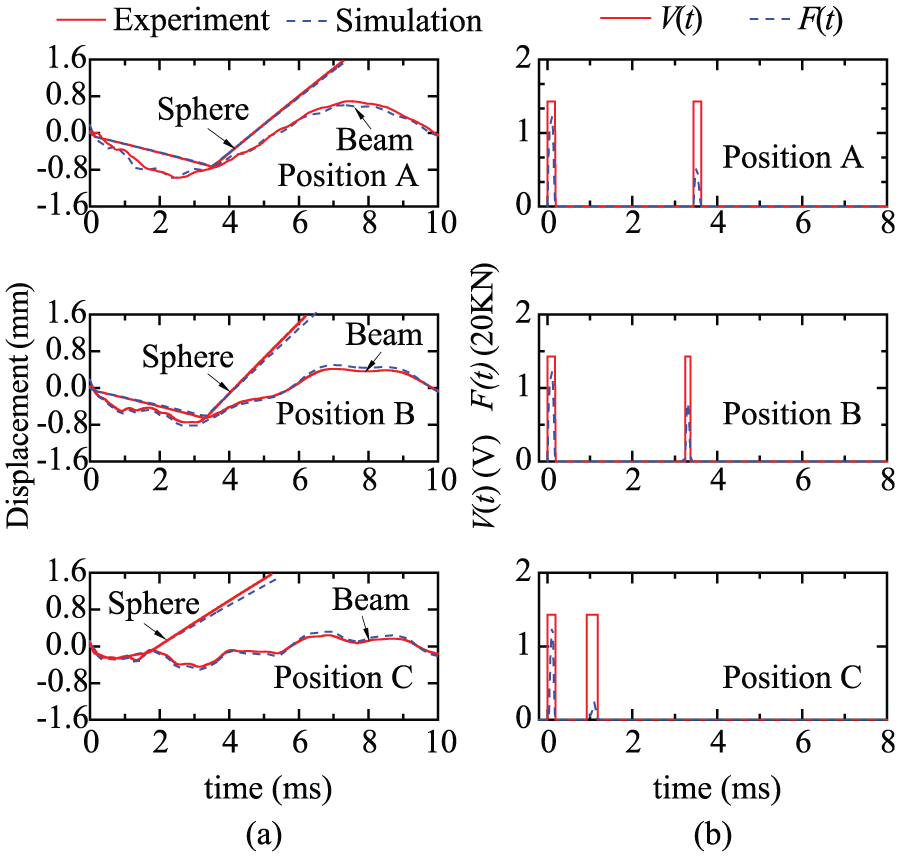
(a) Comparisons of the displacement and (b) comparisons of the impact–contact time.
The experimental and simulation results show a very good agreement for the first sub-impact, and after a few milliseconds, the second sub-impact occurs. It is noted that the distribution of the sub-impacts is sensitive to the impact position. The second sub-impact is closer to the first sub-impact as the impact position becomes increasingly away from the center of the beam. However, it is important to notice that in general experimental and simulation results agree well with, which proves the accuracy of the simulation models. This indicates that the LS-DYNA is suitable to study complex sub-impact phenomenon.
In view of the experimental equipment was placed vertically, so the numerical simulations were performed in both cases, and gravity effect was considered in one case and not considered in the other. The results obtained through finite element simulations were presented in Figure 3. It can be observed that the gravity has little effect on sub-impact phenomenon in such short falling impact process, and it is not the root of the sub-impact.

Effect of gravity on sub-impacts.
Contact–impact time of the sub-impacts
An applicable range of the theoretical express of contact–impact time
Contact–impact time is an important parameter that can be helpful for predicting the expected structure response. The theoretical express of contact–impact time has been deduced by the Hertz contact law as shown in equation (1)
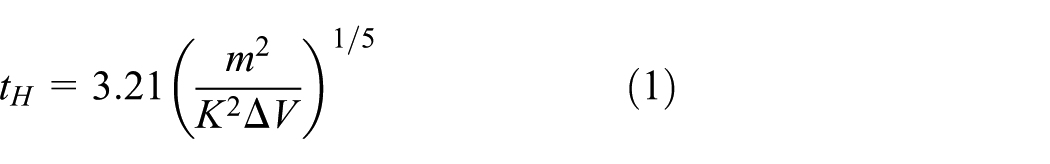
It is known that Hertz contact law is based on quasi-static hypothesis, and initial impact velocity is required as low as possible. However, quasi-static contact law is proved to be applying to the prediction of contact–impact time in higher speeds. According to the research results of Johnson 2 and Stronge, 3 quasi-static contact law still holds true for this case that impact generates only small local plastic deformations. Hence, a criterion of low-velocity impact can be first developed for defining an applicable range of equation (1), and the criterion is given as follows 4

where

For spherical projectile


where E* is the equivalent elastic modulus, and R is the equivalent curvature radius. The beam curvature radius R1 = ∞ and the sphere curvature radius R2 = 35 mm.


The theoretical express of

where
According to the upper limit of low-velocity impact given by equation (2),
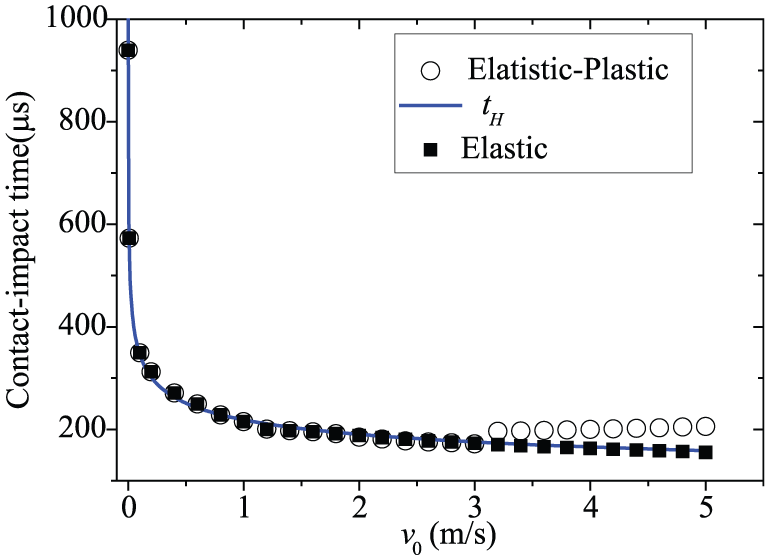
Comparisons of contact–impact time of the first sub-impact.
As depicted in Figure 4, contact–impact time of the first sub-impact is strongly dependent on the initial impact velocity. However, it is found that equation (1) still provides a good approximation in range of initial impact velocity 0.001–3 m/s. The applicable range of the theoretical express is very close to the criterion of low-impact velocity presented in equation (2). This proves that the applicable range of the theoretical express given in equation (2) can be adopted. In addition, it is interesting to note that the contact–impact time of the first sub-impact for elastic and elastic–plastic material behavior is in a good agreement in range of initial impact velocity 0.001–3 m/s. Hence, it can be concluded that the effects of local plastic deformations can be neglected on contact–impact time for low-velocity impact.
The contact–impact time of the subsequent sub-impacts
Figure 5 shows the comparisons of contact–impact time of the subsequent sub-impacts (the subsequent sub-impacts mean the sub-impacts occurring after the first sub-impact) between numerical results and theoretic results. It is seen that the simulated impact–contact time ti of the subsequent sub-impacts is still close to the theoretical results tH but oscillates around the theoretical results tH, and the degree of agreement is inferior to that of the first sub-impact. It was found that the processes of the subsequent sub-impacts are influenced greatly by the global structure vibrations of the beam, and which in turn affect the contact–impact time of the subsequent sub-impacts as described in experimental results of Part I. The difference between the simulated impact–contact time of the subsequent sub-impacts and that of the theoretic results tH can still be explained theoretically by a revised impact theory in consideration of beam vibration as shown in equation (15) of part I.

Comparisons of contact time of the subsequent sub-impacts.
Effect of principal parameters on contact–impact time of the sub-impacts
The good agreement of the simulated contact–impact time with the theoretic results in a wider range of impact velocity means that the process of the sub-impact undergoes a local contact deformation like the Hertz contact process. Therefore, according to Hertz impact law, contact–impact time of the sub-impact may be depend upon equivalent elasticity modulus, contact curvature radius of the sphere, and equivalent mass besides relative impact velocity.
Effect of equivalent mass on contact–impact time of the sub-impact
The equivalent mass m was found to be an important parameter in determining impact response of the beam given as follows 4

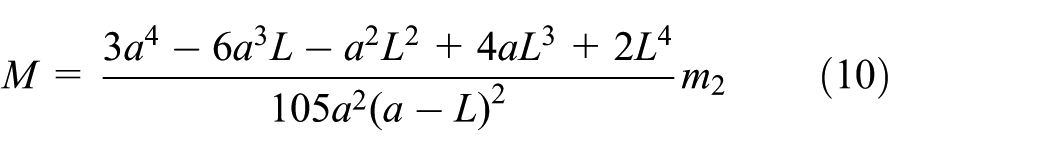
where m1, m2, a, M, and L indicate sphere mass, beam mass, the distance of impact position to the left supported end of the beam, the equivalent mass of the beam, and beam half-length, respectively.
The variation of equivalent mass m will be accomplished by modifying the sphere material density for avoiding the variation in contact stiffness, and the mass of beam remained unchanged.
Figure 6 compares the contact–impact time of the first sub-impact for different equivalent mass m between numerical results and theoretic results tH. Here again, the numerical results agree well with the theoretic results tH. It is seen that the contact–impact time of the first sub-impact is strongly influenced by equivalent mass m and is in proportion to m0.4.

Effect of equivalent mass on contact–impact time of the first sub-impact (v0 = 2.66 m/s, at Position A).
Effect of curvature radius of the sphere on contact–impact time of the sub-impact
In previous studies, it was shown that impactor curvature radius has a pronounced effect on local phenomenon such as the contact pressure distribution and the size of the contact region. 5 The sub-impact process is dominated by local contact deformation; therefore, the contact–impact time of the sub-impact may be influenced by the curvature radius of the sphere.
Figure 7 shows the effect of curvature radius of the sphere on contact–impact time of the first sub-impact. The numerical results agree well with the theoretic expression. It is seen from the figure that the contact–impact time of the first sub-impact is in proportion to R−0.2.
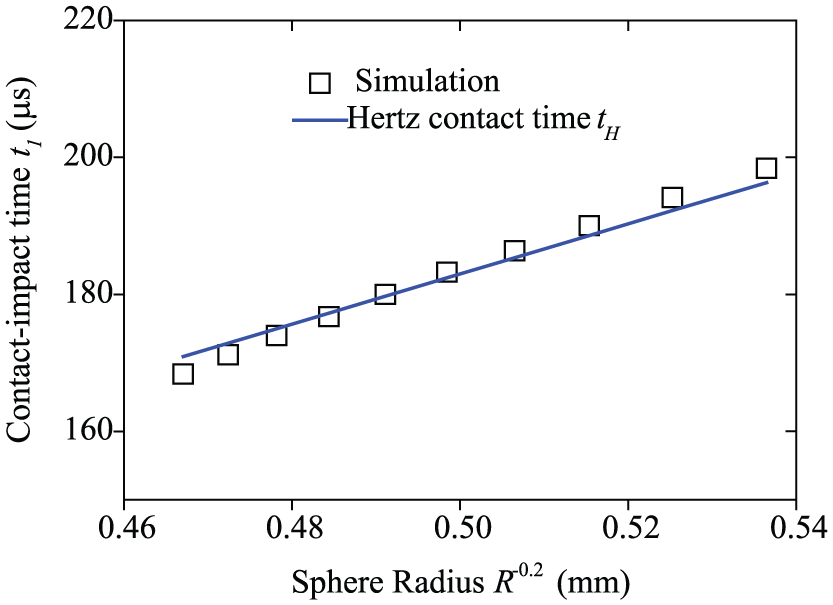
Effect of curvature radius of the sphere on contact–impact time of the first sub-impact (v0 = 2.66 m/s, at Position A).
Effect of equivalent elasticity modulus on contact–impact time of the sub-impact
The equivalent elasticity modulus E* was found to be another important parameter in determining impact response of beam and sphere given as follows

where
Figure 8 shows the effect of equivalent elastic modulus on contact–impact time of the first sub-impact. The numerical results are coinciding well with the theoretic results tH. It was found that the contact–impact time of the first sub-impact decreases with the equivalent elastic modulus E* and is in proportion to E*−0.4.

Effect of equivalent elasticity modulus on contact–impact time of the first sub-impact (v0 = 2.66 m/s, at Position A).
In summary, Figures 6–8 demonstrate that the impact rule illustrated by Hertz impact law, such as the impact–contact time, is in proportion to m0.4, R−0.2, and E*−0.4 and remains suitable for the sub-impact process.
The response of sub-impact force
Note that in impacts, measuring impact forces are more difficult because insertion of a force transducer between the contacting points can, in principle, alter the impact force.6–8 Therefore, numerical simulation can be used as an alternative method to estimate impact forces. The impact force obtained through finite element simulation for considered velocity and impact positions was computed in Figures 9 and 10.

Impact force histories obtained through finite element simulations for five different initial impact velocities at Position A: (a) the response of the first falling impact process and (b) the response of the first impact force.

Impact force histories obtained through finite element simulations for three different impact positions and v0 = 2.66 m/s: (a) the response of the first falling impact process and (b) the response of the first impact force.
Figure 9 shows the comparisons of impact force histories corresponding to five different impact velocities obtained through the finite element approaches. It was found the first falling impact processes of the sphere for five different impact velocities consist of two sub-impacts. The second sub-impact is more close to the first sub-impact as initial impact velocity increases. The responses of the first impact forces were found to be asymmetric because of energy loss in plastic deformation, and the peaks of the first impact forces were observed to increase with the relative values of the impact velocities. The contact–impact time of the first sub-impact will decrease with the increase in the impact velocity.
Figure 10 shows the comparisons of impact force histories for three different impact positions obtained through the finite element approaches. The first falling impact processes of the sphere in all tests consist of two sub-impacts. The second sub-impact is closer to the first sub-impact as the impact position becomes increasingly away from the center of the beam. It is interesting to note that the peaks of the first impact forces are almost identical for three impact positions, but the contact–impact time will increase as impact position moves to the supported end of the beam.
The occurrence conditions of the sub-impact
Mass ratio condition
The equivalent mass m was found to be an important parameter in determining contact–impact time of the sub-impact as mentioned earlier and it contains sphere mass and beam equivalent mass. Further numerical studies revealed that the occurrence condition of the sub-impact is connected with the mass ratio β (i.e. sphere mass to the equivalent mass of simply supported beam).
Figure 11 shows the change in impact numbers with changing mass ratio β. The variation of mass ratio β will be accomplished by modifying sphere mass m1, while beam equivalent mass M remained unchanged. There seems to be a threshold of mass ratio βT, and the sub-impact will occur as long as the mass ratio threshold is satisfied. The mass ratio threshold βT is equal to 0.188 in this case.

The relationship between mass ratio β and impact numbers (v0 = 2.66 m/s, at Position A).
In addition, as shown in Figures 12–14, the ratios of maximum amplitudes of the first-, second-, and third-order vibrations to the maximum amplitudes of the beam vibrations (i.e. A1/Amax, A2/Amax, and A3/Amax) are almost constant as long as the mass ratio β is below mass ratio threshold βT. However, the amplitude ratios will change suddenly as the sub-impact occurs, and the phase angle of the first-order vibration will decrease obviously, as shown in Figure 15. This means that the sub-impact can be identified by the change of the amplitude ratios or phase angle.

The relationship between mass ratio β and the amplitude ratio of the first-order vibration (v0 = 2.66 m/s, at Position A).

The relationship between mass ratio β and the amplitude ratio of the second-order vibration (v0 = 2.66 m/s, at Position A).
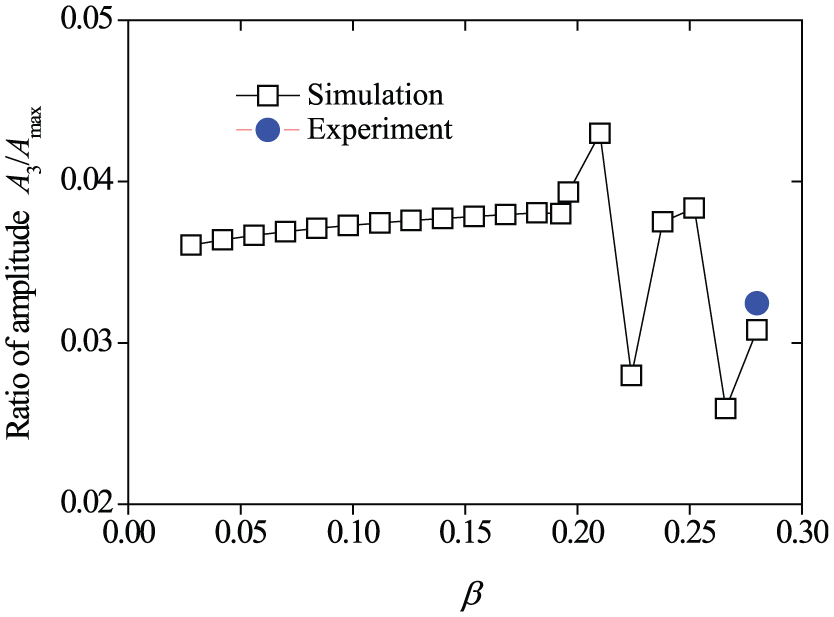
The relationship between mass ratio β and the amplitude ratio of the third-order vibration (v0 = 2.66 m/s, at Position A).

The relationship between mass ratio β and the phase angle of the first-order vibration (v0 = 2.66 m/s, at Position A).
Initial impact velocity condition
Figure 16 depicts the relationship among mass ratio threshold βT (the sub-impact will occur as long as the mass ratio threshold βT is satisfied) and initial impact velocity v0, and it is noted that the mass ratio threshold βT is not constant when the initial impact velocity changes. The mass threshold βT will decrease with the increase in the initial impact velocity v0.

The relationship between mass threshold βT and initial impact velocity (at Position A).
Impact position condition
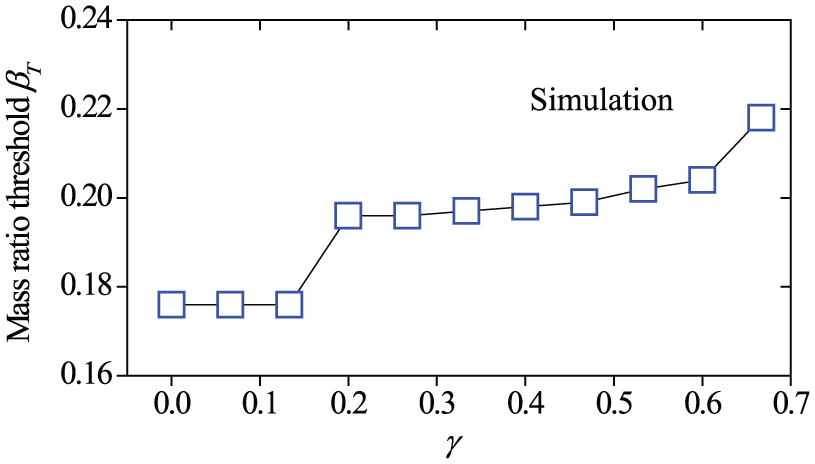
As shown in Figure 2, when the impact position approaches the supporting end of the beam, the impact process will be shortened and the movement of the beam changes significantly, which indicates that the occurrence condition of the sub-impact phenomenon may be related to impact position. Figure 17 shows the change in the mass ratio threshold βT with changing impact position ratio γ(γ = 1−a/L).
The relationship of mass ratio threshold βT and impact position ratio γ(v0 = 2.66 m/s).
It is noted that the mass ratio threshold βT (the sub-impact will occur as long as the mass ratio threshold is satisfied) changes with impact positions. When the impact position is moving to the supported end of the beam, the mass ratio threshold βT will increase gradually. Further study showed that this may be associated with the increasing effect of the higher-order vibrations of the beam. Figures 18–20 show the relationships between the ratios of the maximum amplitudes of the first-, second-, and third-order vibrations to that of the maximum vibrations of the beam. As the impact position moving to the supported end, the amplitude ratio of the first-order vibration decreases, while the amplitude ratio of the second-order vibration increases obviously. The amplitude ratio of the third-order vibration decreases first and then increases. With the increasing effect of the second- and third-order vibrations, the movement of the beam changes significantly and which leads to the mass ratio threshold βT increase as the impact position approaches to the supporting end.

The relationship between impact position ratio γ and the amplitude ratio of the first-order vibration (v0 = 2.66 m/s).

The relationship between impact position ratio γ and the amplitude ratio of the second-order vibration (v0 = 2.66 m/s).

The relationship between impact position ratio γ and the amplitude ratio of the third-order vibration (v0 = 2.66 m/s).
Thickness condition
It was also found that the thickness h of the beam has a great influence on the occurrence of the sub-impact. Figure 21 shows the effect of the thickness h of the beam on impact numbers when beam mass remains unchanged. It is interesting to note that there is a thickness threshold of the beam, and the sub-impact will occur as long as the thickness threshold is satisfied. The thickness threshold is equal to 47.26 mm in this case. When the thickness threshold is below 47.26 mm, the sub-impacts are observed, otherwise, only a single impact will occur.

Effect of thickness on impact numbers (v0 = 2.66 m/s, at Position A).
Length condition
Figure 22 shows the effect of the length 2L of the beam on impact numbers when beam mass remains unchanged. It is also observed that there seems to be a length threshold of the beam, and the sub-impact phenomenon will occur as the length threshold is satisfied. The length threshold is equal to 351 mm in this case. When length threshold exceeds 351 mm, the sub-impacts are observed, otherwise, only a single impact will occur.

Effect of length on impact numbers (v0 = 2.66 m/s, at Position A).
Coefficient of restitution
For the first falling impact process, numerical simulations of apparent coefficient of restitution (the apparent coefficient of restitution means the ratio of the velocity of the sphere after collision V2 to the velocity before the collision V1, that is, V2/V1) were performed in the range of 0.001–5 m/s, as shown in Figure 23.

Apparent coefficient of restitution for the sphere falling impact on the center of the beam.
It was observed that the apparent coefficient of restitution decreases steadily with the initial impact velocity when the mass ratio β is equal to 0.168 (under which only a single impact occurs) and shows the same changing rule as that of the summarized by Goldsmith. 9 However, the apparent coefficient of restitution will change significantly with the initial impact velocity when the mass ratio is equal to 0.28 (under which the sub-impacts will occur). Numerical simulations in a wider range of initial impact velocity further prove that the sub-impacts result in a highly nonlinear and uncertain behavior of the apparent coefficient of restitution.
Figure 24 shows the effect of the impact position on the apparent coefficient of restitution. It is interesting to note that the apparent coefficient of restitution, which is relatively stable for single impact (β = 0.168), changes significantly depending on the impact position for the sub-impacts occasion (β = 0.28).

Apparent coefficient of restitution for the sphere falling impact on different positions of the beam (v0 = 2.66 m/s)
Conclusion
In this article, more than 400 different numerical simulations were reported, running several thousand CPU-hours on either three Lenovo D20 workstations or two compatible computers. Some of the numerical results were compared with impact tests, and these numerical results agree well with that of the experimental results. This proves that both the numerical and experimental results are considerable, and this gives somewhat more confidence to the reported numerical observations. Some main conclusions from the simulations are given below:
An applicable range of the theoretical express of contact–impact time was determined. It is interesting to note that the contact–impact time of the first sub-impact for elastic and elastic–plastic material behavior is in a good agreement in range of initial impact velocity 0.001–3 m/s. Hence, it can be concluded that the effects of local plastic deformations can be neglected on the contact–impact time for low-velocity impact.
The numerical simulations show that the initial impact velocity, equivalent elasticity modulus, contact curvature radius of the sphere, and equivalent mass have great influence on contact–impact time of the sub-impact. It was found that the impact rule illustrated by Hertz impact law, such as the impact–contact time is in proportion to m0.4, R−0.2, and E*−0.4, remains suitable for the sub-impact process.
When the sphere impacts on the center of the beam, impact force histories of the first sub-impact corresponding to five different initial impact velocities were found to be asymmetric because of energy loss in plastic deformation, and the peaks of the first sub-impact forces were observed to increase with the initial impact velocities. While the sphere impact on three different positions of the beam, it was observed that the peaks of the first sub-impact forces are almost identical for different impact positions.
The numerical simulations show that the ratios of maximum amplitudes of the first-, second-, and third-order vibrations to the maximum amplitudes of the beam vibrations is almost constant on single impact occasion. However, the amplitude ratios will change suddenly as sub-impact takes place, and the phase angle of first-order vibration will decrease obviously at the same time.
The numerical simulations show that the occurrence conditions of the sub-impact phenomenon relate to the ratio of the sphere mass to the beam equivalent mass, initial impact velocity, and impact position. It was found that the occurrence conditions of the sub-impact phenomenon can be represented by a mass ratio threshold. The sub-impact will occur as long as the mass ratio threshold is satisfied.
It is also found that the thickness or length of the beam has a great influence on the occurrence of sub-impact. It is interesting to note that there is a thickness or length threshold of the beam, and the sub-impact will occur as long as the thickness or length threshold is satisfied.
Numerical simulations in a wider range of initial impact velocity or in different impact positions prove that the sub-impacts result in a highly nonlinear and uncertain behavior of the apparent coefficient of restitution.
Footnotes
Appendix 1
In Figure 25,
The stress of the elastic load region can be calculated as follows
where
If the stress exceeds yield limit
Academic Editor: Chuanzeng Zhang
Declaration of conflicting interests
The author(s) declared no potential conflicts of interest with respect to the research, authorship, and/or publication of this article.
Funding
The author(s) disclosed receipt of the following financial support for the research, authorship, and/or publication of this article: This research was supported by the National Natural Science Foundation of China (no. 11372138), the Specialized Research Fund for the Doctoral Program of Higher Education of China (no.2012321910036), and the Provincial Natural Science Foundation of Anhui College (no. KJ2013Z021).