
Abstract
In recent years, the design and development capabilities, which provided products with vitality and value, had become one of the key factors in transforming and upgrading enterprises. Also, the industrial design ability had become a powerful weapon in enhancing business competitiveness. This study aimed at developing a self-assessment scale to evaluate the pre-service capabilities of industrial design students and it was found to be useful also in analyzing the ability levels of professional designer after the self-assessment scale was established. According to the literature review and interviews with experts, this study summarized the categories and indicators of professional abilities of industrial designers. Next, grey relational analysis was applied for analyzing these categories and indicators, then the weight between these indicators were determined through the method of quality function deployment, and finally, these indicators were further transferred into questions to become a pre-service self-assessment scale with 70 items, named industrial design ability index questionnaire. The industrial design ability index assessment scale was validated using 211 college students ranging from freshman to senior year. The industrial design ability index score shows a direct relationship between designer skills and years in school from freshman to senior year and verified that the industrial design ability index is able to assess the level of experiences of an industrial designer.
Keywords
Introduction
According to Global Views Monthly (2007), the number of students majoring in design disciplines in Taiwan increased by 50% in the past 5 years. Evidently, the growth in design students should meet the growth needs in the industrial design sector. However, the Council for Economic Planning and Development (CEPD) states that the manpower supply trends for the next 10 years indicate that a lack of industrial designers exists despite substantial growth in industrial design graduates. 1 The World Bank Group (WBG) also estimates that the design and entrepreneurial talent gap will be 25% lower than the global company demand. Another worrisome trend from the Higher Education Statistics Agency of the United Kingdom for graduate employment showed that approximately 9% of creative arts and design (2005–2006) graduates were unemployed—the third highest among any subject. The consequence is that these newly graduated designers are required to work in an entirely different and less rewarding profession such as retail, catering, waiting, and bar staff. The data presented a serious warning to educators in design discipline.
Common consensus suggests that the industrial designer deficit is perhaps due to graduates who do not have the proper training and skills that prospective employers are looking for. Industrial design discipline covers a wide range of subjects, from car design to simple product design for the household. Each product is created with a unique design cue associated with the brand’s image, and hence, the designer is required to be versatile in design knowledge and skills. This interdisciplinary field integrates aesthetics, materials, mechanical, physical, and trends. 2 Many experts and scholars have expressed that industrial design education must be strengthened in the field noted previously.3–5 This research study focuses on developing an industrial designer attribute assessment scale for education institution to access the skill and progress of students major in industrial design. It seems that it is a common issue in East and West.6–8
Methods
Quality function deployment (QFD) technique and grey relational analysis (GRA) are utilized to develop the industrial design ability index (IDAI) assessment scale. QFD is a structured technique that enables the determination of the real needs of customers. 9 This technique uses binary matrix conversion technology to convert the voice of the customer (VOC) into appropriate engineering requirements (voice of engineering (VOE)) 10 and incorporates the customer’s voice into all stages of product or service design to meet customer needs in the final product or service. In addition, QFD is a systematic and stepwise procedure for finding the correct order of priority and weight in a complex selection situation. To further enhance the accuracy of the QFD weight calculation, GRA was used to sort and define the weighting factor of each item. The complete research process is summarized and presented in Figure 1.

IDAI development flow chart.
The flowchart of Figure 1 shows relevant literature review through purpose and goal. Next, data arrangement and analysis are carried out with QFD technique, and design of the scale is completed. Thereafter, a questionnaire was distributed to verify the correctness of the scale. Finally, conclusion and recommendations for the study are achieved.
Results
Step 1: upper block
The initial step is to conduct literature review and informational interview. The intention is to find out the common trait of a proficient and talented industrial designer. The informational interview was conducted with five individuals with working experience or scholastic background in industrial design (see Table 1). The knowledge and insight gained from literature review and informational interview are used to develop the 13 categories and 43 indices. The breakdown of 13 categories and 43 indicators of a proficient and talented industrial designer is given in Table 1.
The specialists of research group.

The draft categories and indicators of industrial design abilities was assessment with specialists, after in-depth discuss and integrate, most indicators in drift was recognized. There are only two indicators were cut, the “art and aesthetic quality” and “environmental responsibility,” the causes of these two indicators was encompasses and similar among other indicators. Finally, integrate them and get 13 categories and 43 indicators.
Step 2: left block—rank and weights of ability categories
This step is to sort and assign weight factor to the 13 items using GRA. GRA is a superior method for calculating object homogeneity in its relationship analysis. Its main function is to calculate the distance between discrete sequences to offer an effective method for handling uncertainty, multivariate input, and discrete data using the interaction between parameters to obtain information. Five selected experts were each given a table consisting of 13 × 13 matrix chart and asked to rate the strength of relative importance between the 13 items (see Table 1) using values from 0, 0.125, 0.25, 0.375, 0.5, 0.625, 0.75, 0.875, and 1. A sample of the 13 × 13 matrix chart is included for reference as shown in Table 2.
13 categories and 43 indicators of ID abilities.
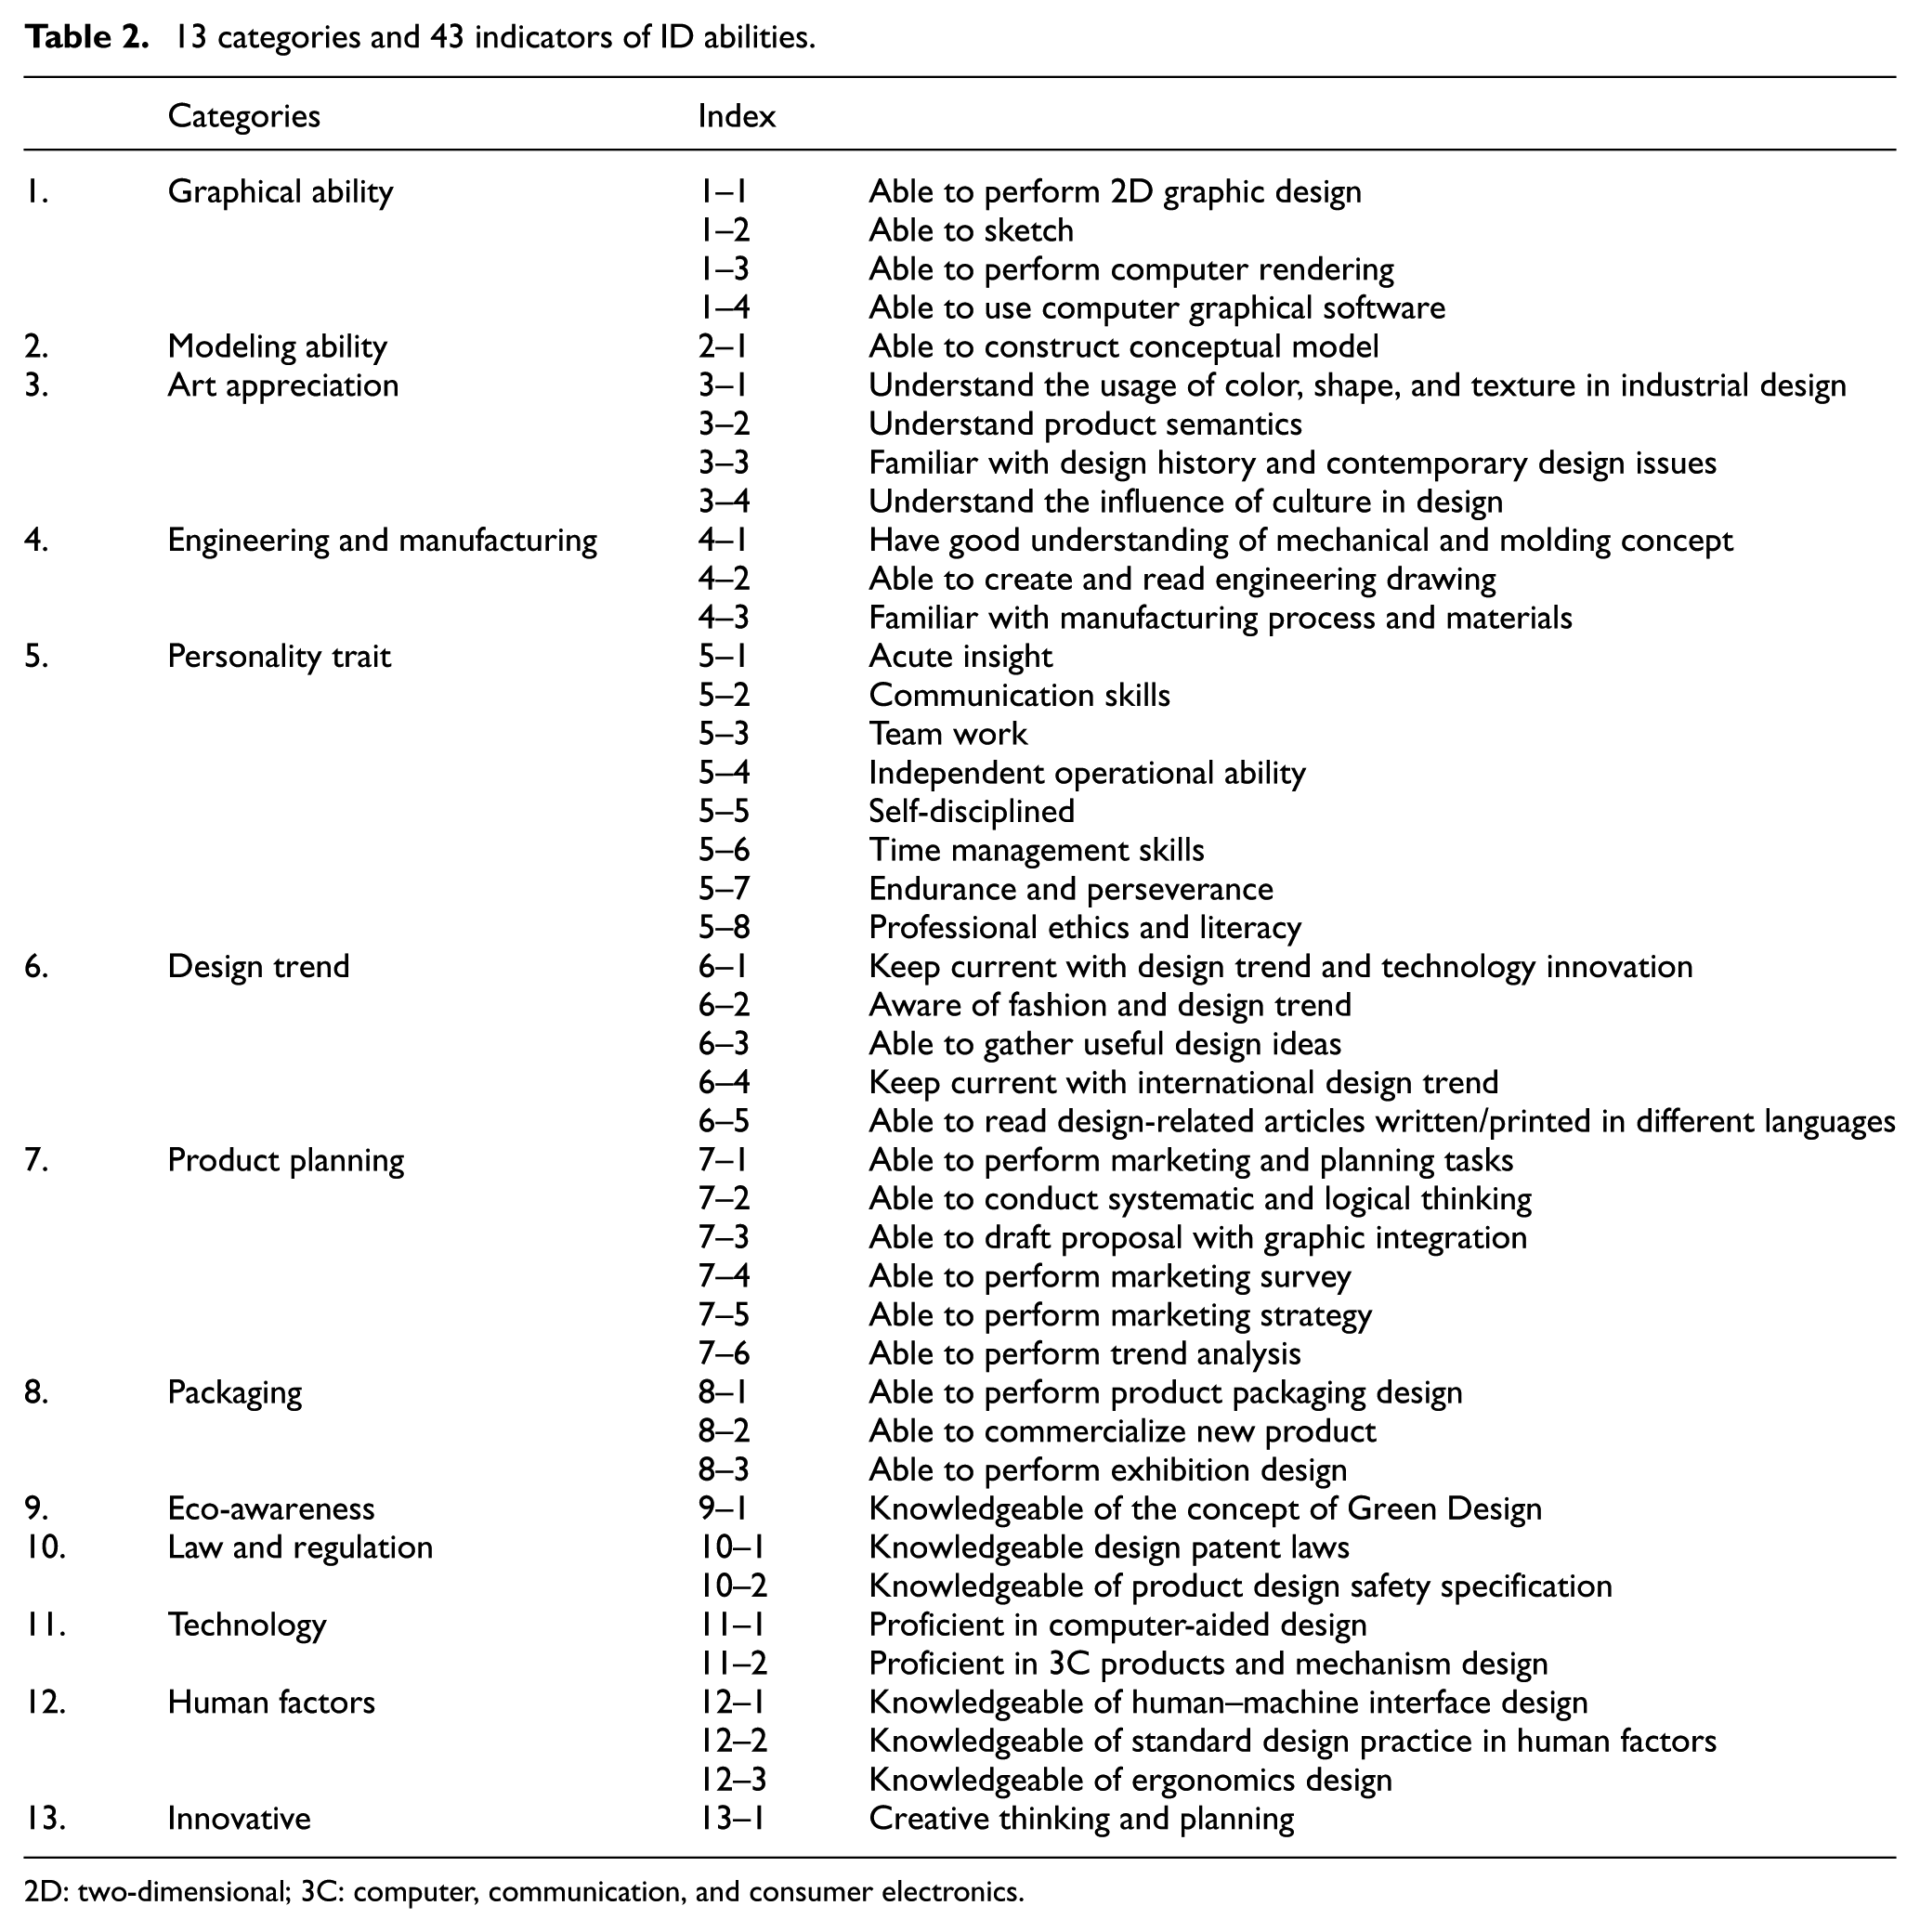
2D: two-dimensional; 3C: computer, communication, and consumer electronics.
The GRA is used as a weight ranking method, which is derived from the needs of industry and the results of related studies. After the assessment and discussion by experts, as the evaluation of the abilities.
The GRA is slightly different from the AHP method used in ISO-16355-1:2015, it’s also numbers between 1-0. ISO-16355-1:2015 recommendations are commonly used values with 5 levels or 9 levels, and if there are better analytical methods, such as AHP will be able to get a better weight. Therefore, the GRA is more accurate than the AHP analysis method, and that is why there are different numbers from ISO-16355-1:2015.
The ratings from five experts were then analyzed together using Nagai et al. 11 GRA Module. The general equation of Nagai GRA Module is provided in the following
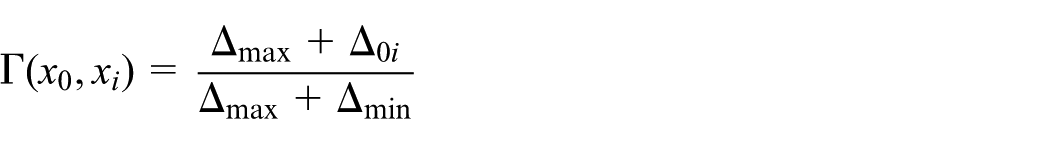
where

or
The final ranking and gamma value for each item after GRA analysis are presented in Table 3. The results show that the top three weights are personality traits (no. 5), modeling ability (no. 2), and innovative (no. 13). This is consistent with the current literature and human resource (HR) agency requirements.
Rank and weights of ability categories and final scores.

SD: standard deviation.
Step 3: middle block—the relationship of left block and upper block
The middle block is a step to further refine the relative importance of the 13 items. This step is completed with five selected experts working jointly through a discussion method and arrived at a consensus for each response. There are three levels of responses: strongly related, related, and not related. Symbol • denotes strongly related and is given nine points; symbol ˆ denotes related and is given three points; and “Blank” denotes weakly related and is given one point (see Figure 2).

The House of Quality (HOQ) of IDAI.
In this study, we chose the “Classical QFD matrices” as 1, 3, and 9, so that experts can quickly make a decision in a short time: the rule of 7+/2. Following ISO 16355-1:2015 would be better for the future researches.
Step 4: lower block—the weight and sort of each index
The lower block is the final step for completing the House of Quality (HOQ). This step completes the calculation of the overall weight, target value, and relative importance.
The general equation of calculating the overall weight is shown in the following. The overall weight for each index is computed by multiplying the gamma value from the left block with corresponding grid’s response from middle block (see Figure 2), and then all the values are summed together. A sample calculation for Index 1 is as follows

where X is the total, Wi is the weights, and Ki is the relationship strength.
Overall weight sample calculation
Overall weight for Index 1 (Graphic Design, see Figure 2) = 0.54(9) + 0.771(1) + 0.011(3) + 0.439(1) + 1(1) + 0.044(1) + 0.215(1) + 0(3) + 0.107(1) + 0.060(1) + 0.470(1) + 0.102(1) + 0.556(1) = 8.658
Next, the target value is just simply the ranking of the 43 indicators of the roof block per calculated overall weight value. Finally, the relative importance is the percent calculation of the summation of the overall weight value. A sample calculation for Index 1 (Graphic Design, see Figure 2) is provided in the following for reference. The completed IDAI HOQ is shown in Figure 2.
Relative importance sample calculation
Sum total weight = 387.864
Target value indicator 1 = 8.658
Relative importance = 8.658/387.864 × 100 =2.23%
Step 5: establishment of IDAI scale
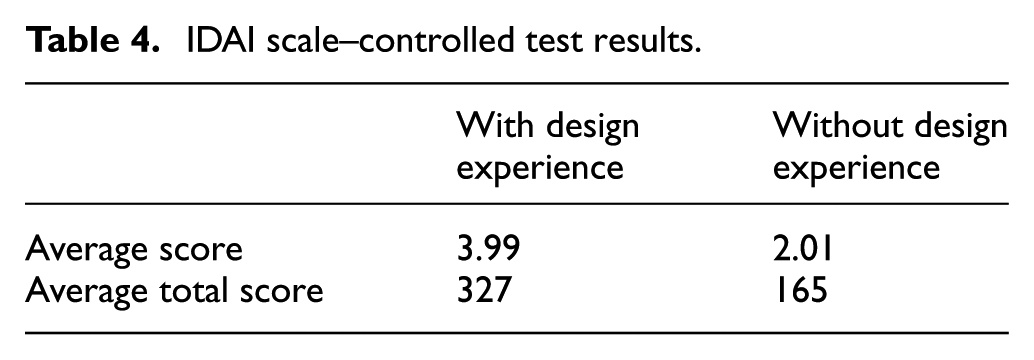
The initial IDAI scale consists of 85 items, with each item based from the upper block of IDAI HOQ. The scale classified response from designer using a 5-point scale, from “unable” to “professional.” A controlled test was conducted to test the validity of the IDAI scale. The IDAI scale was given to two control groups: one with design experience and the other one have none. Table 1 shows the pretest result and indicates that the IDAI is able to differentiate whether the person has design experience or not (see Table 4). Based on the controlled test result, the IDAI scale was further assessed and refined by five experts. This process reduced the 85 items to 70 final items (see Appendix 1).
IDAI scale–controlled test results.
The IDAI scale includes a red baseline curve to enable the examiner to have a quick glance and clear indication of the designer’s level of expertise. The baseline curve is defined based on the response between levels 3 and 4, which is 3.5. The baseline curve overall weight of each ability index is multiplied with a value of 3.5. These points are used to form a red baseline curve (see Figure 3). The IDAI assessment provides three sets of information: (1) a line graph provides a visual comparison between the subject assessment and baseline (see Figure 3); (2) a bar chart shows the strength and weakness of the designer (see Figure 4); and (3) a table provides a numerical comparison between the baseline score and designer’s score (see Table 5). A sample assessment is provided in the following to demonstrate the noted three sets of information.

IDAI assessment scale: ability curves of no. 1 participant.
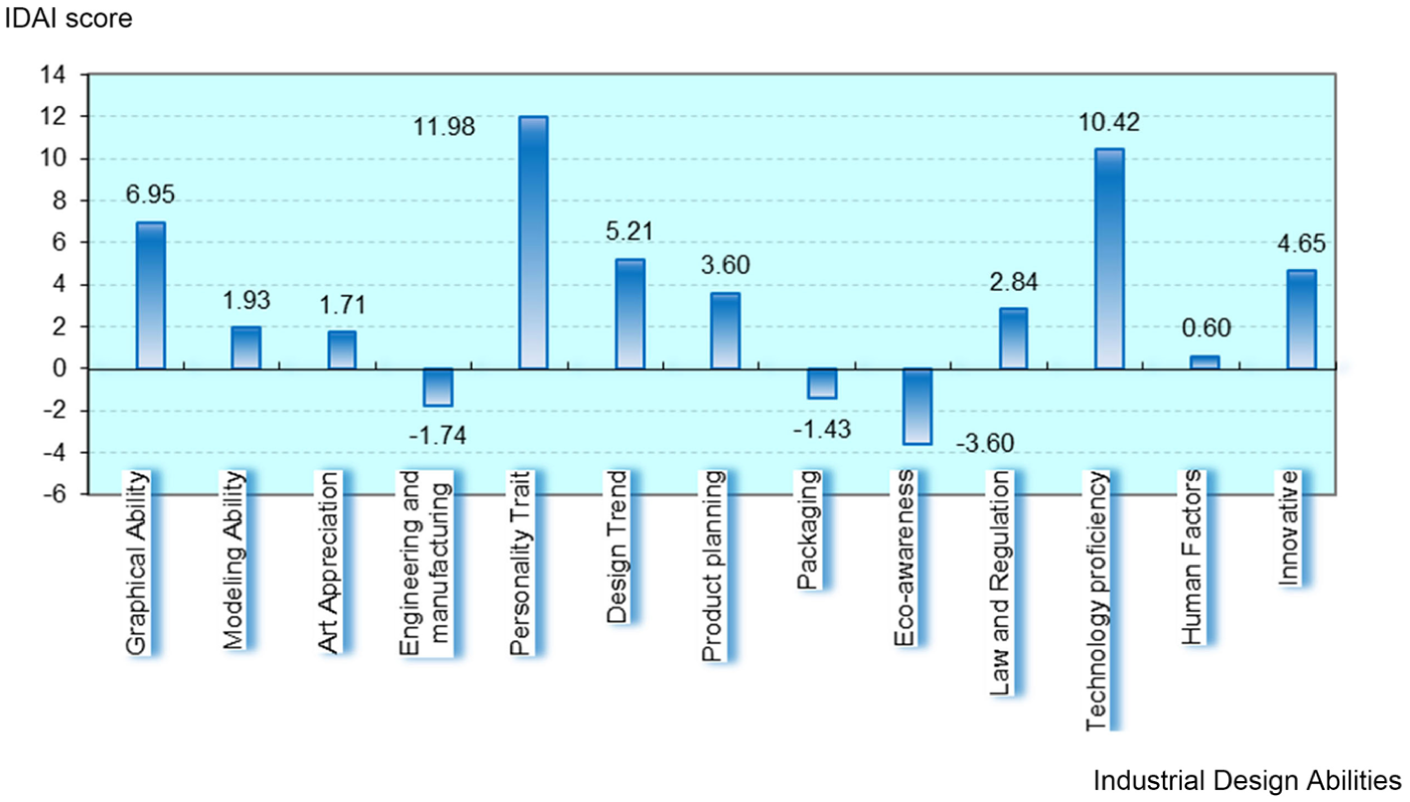
Bar chart of no. 1 participant depicting industrial design abilities.
IDAI result—average score.

IDAI: industrial design ability index.
Analysis of no. 1 participant
The IDAI scale revealed that the participant has strong personality traits and is excellent in technology proficiency and graphical ability. However, he is falling short in eco-awareness, engineering and manufacturing, and packaging with respect to the standard values. The overall scores showed that this participant is qualified as an industrial designer.
Verification
The IDAI assessment scale was validated using 211 college students ranging from freshman to senior year. The IDAI score shows a direct relationship between designer skills and year in training from freshman to senior year (Figure 5). The result indicated that more training in industrial design results in higher professional skill. The average IDAI score per college year is summarized and shown in Table 5.
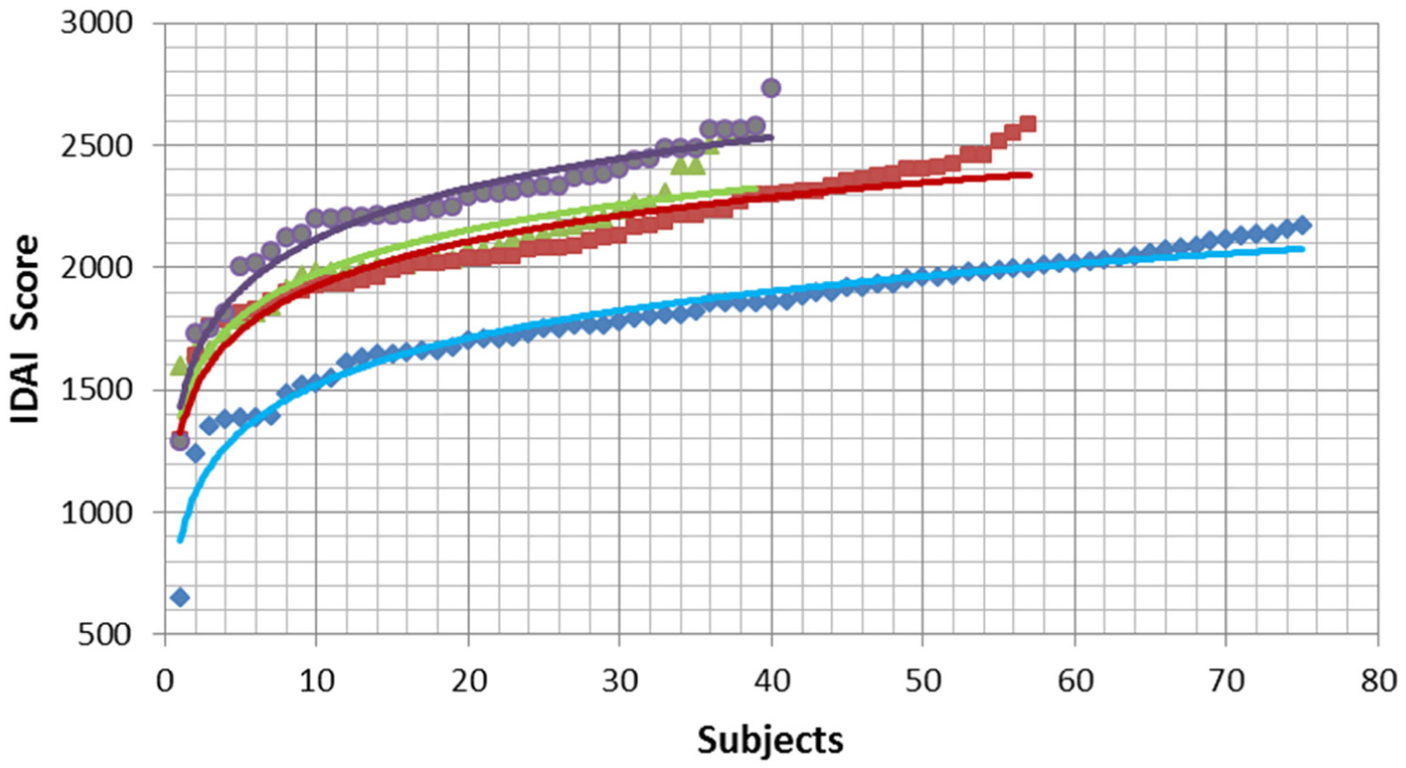
Diagram of each grade with IDAI scores.
Discussion
Rachel Cooper and Press 12 indicate that industrial designer must have a certain extent of understanding of its working conditions in the design process to help to complete the task. He said that except a wealth of design knowledge and skills, industrial designer also need to have an insight of the product. Mutual cooperation between the three abilities helps to form a complete industrial design expertise.
In 1950s, Benjamin Bloom led a group of expert research on student learning behavior. According to Bloom’s Taxonomy of Learning Domains, learning behavior can be grouped into three domains, which is cognitive (knowledge), affective (attitude), and psychomotor (skills). It has great relevance with the classification of ability.
Related study shows that the process of ability index construction is based on research review and expert interviews to obtain the key words of expertise. Next, after issued by questionnaire, statistical analysis is necessary for the index of ability.
Assessment scale can be classified into three types: elementary, intermediate, and advanced. The elementary scale is the basic form of an assessment scale to be completed by simply checking the box of a set of questionnaire and totaling the scores. For instance, the Taiwanese Depression Scale (with 18 items) 13 and the Barthel Index (with 30 items) 14 are both elementary scales. The next level up is the intermediate assessment scale. As the name implies, this type of assessment scale would have more details and elaborate questions. One example for the intermediate assessment scale is the Medical Outcomes Study (MOS) 36-Item Short-Form Health Survey (SF-36), 15 which has 100 items. The advanced-type assessment scale is the most sophisticated assessment scale, and it normally involved multiple aspects or facets in assessing an individual. The IDAI is designed to be an intermediate scale and used to assess the progress of the student’s design ability from freshman through senior year.
During the literature review step, it was discovered that researches done in industrial design typically only focused on the main attributes of a good industrial designer. However, these attributes were rarely assessed. Therefore, this research is focused on developing a method to assess these attributes. The 13 items for the IDAI assessment scale were developed using information from previous researches such as the Four Basic Elements in Industrial Design; 16 Industrial Designer Skills, 17 and Open-Ended Questionnaire to Develop 370 Criteria of Professional Industrial Designer. 18 These items were expanded and refined using GRA and QFD techniques. The completed IDAI assessment scale was found to be reliable during the verification step. It is important to note that the IDAI assessment scale is a qualitative assessment.
Future development includes a simple and advanced version of the IDAI scale. The goal is to provide an industrial designer assessment scale that was tailored to different needs.
Conclusion
QFD technique in conjunction with GRA was utilized to develop an assessment scale to evaluate the strength and skills of an industrial designer. The primary purpose of this scale is to help the educators to track the learning progress and advancement of the students’ design skill and determine the effectiveness of the course curriculum in nurturing future industrial designer. Another application of this scale is that it can be used by an employer to assess industrial designer job applicant. An application for an invention patent and for self-assessment Internet application has been submitted to Ministry of Economic Affairs—Intellectual Property Office, R.O.C, to protect the intellectual development of this assessment scale. The next step is to launch the application over the World Wide Web and make the scale available to the general public.
Footnotes
Appendix
Industrial design ability index (IDAI) scale

| Item | Questionnaire |
|---|---|
| 1. | How many graphical editing software can you use? (CorelDraw, Illustrator, Photoshop …) |
| □ More than 4 □ 3 □ 2 □ 1 □ None | |
| 2. | Photography skill level (I can operate SLR). |
| □ Professional □ Good □ Novice □ Poor □ None | |
| 3. | I am able to use sketch to convey an idea clearly in a short period of time. |
| □ Very good □ Good □ Novice □ Poor □ None | |
| 4. | The perspectives of my three-dimensional sketch are correct. |
| □ Very good □ Good □ Novice □ Poor □ None | |
| 5. | People can clearly understand the form and function of my drawing. |
| □ Clearly □ Good □ Novice □ Poor □ None | |
| 6. | I can perform the product shape, function and structure by design drawing. |
| □ Professional □ Good □ Novice □ Poor □ Unable | |
| 7. | How many 3D software can you use? (SolidWorks, ProEngineer, Inventer, …) |
| □ More than 4 sets □ 3 sets □ 2 sets □ 1 set □ Unable | |
| 8. | Overall, my familiarity with these 3D software are |
| □ Very familiar □ Familiar □ So-so □ Not familiar □ Unable | |
| 9. | I can use computer-aided design software to draw the engineering drawings (size diagrams, exploded diagram, etc.) |
| □ Professional □ Good □ Novice □ Poor □ Unable | |
| 10. | I can use computer-aided design software to draw the shape and structure. |
| □ Very good □ Good □ Novice □ Poor □ Unable | |
| 11. | I can use appropriate alternative materials to make the idea model more real. |
| □ Very good □ Good □ Novice □ Poor □ Unable | |
| 12. | I can use various materials to produce a workable model. |
| □ Professional □ Good □ Novice □ Poor □ Unable | |
| 13. | I can paint the surface coating of the idea model perfectly. |
| □ Professional □ Good □ Novice □ Poor □ Unable | |
| 14. | I have a keen sensibility for color. |
| □ Very good □ Good □ Novice □ Poor □ Unable | |
| 15. | I can perform the product color planning based on the characteristics of the target market. |
| □ Very good □ Good □ Novice □ Poor □ Unable | |
| 16. | I can deal with form and function based on product semantics. |
| □ Very good □ Good □ Novice □ Poor □ Unable | |
| 17. | I always collect contemporary design information. |
| □ Professional □ Good □ Novice □ Poor □ Unable | |
| 18. | I can evaluate modern product or contemporary design and give some personal insights. |
| □ Very good □ Good □ Novice □ Poor □ Unable | |
| 19. | I always collect the information of cultural dynamic. |
| □ Daily □ Several times a week □ Often □ Occasionally □ Never | |
| 20. | I can do a survey in target area. |
| □ Professional □ Good □ Novice □ Poor □ Unable | |
| 21. | I can consider the processing methods and limitations of mold when design. |
| □ Daily □ Several times a week □ Often □ Occasionally □ Never | |
| 22. | I can design an appropriate construction according to the needs of different products. |
| □ Very good □ Good □ Novice □ Poor □ Unable | |
| 23. | I can draw mechanical drawings based on final shape and model making process. |
| □ Very good □ Good □ Novice □ Poor □ Unable | |
| 24. | I can explain the meaning of dimensioning on mechanical drawings. |
| □ Very good □ Good □ Novice □ Poor □ Unable | |
| 25. | According to different product requirements, I can select appropriate materials to design. |
| □ Very good □ Good □ Novice □ Poor □ Unable | |
| 26. | I have variety knowledge of processing methods, materials, and processing limitations. |
| □ Professional □ Good □ Novice □ Poor □ Unable | |
| 27. | I have keen powers of observation for the product shape and proportion. |
| □ Very good □ Good □ Novice □ Poor □ Unable | |
| 28. | I have good communication and interaction with teachers or classmates. |
| □ Very good □ Good □ Novice □ Poor □ Unable | |
| 29 | I could spoke manner to illustrate the design concept. |
| □ Very good □ Good □ Novice □ Poor □ Unable | |
| 30. | I can work with others to complete the design work. |
| □ Very good □ Good □ Novice □ Poor □ Unable | |
| 31. | I can do the design project independently. |
| □ Very good □ Good □ Novice □ Poor □ Unable | |
| 32. | I can propose some review and improvement in each design project. |
| □ Very good □ Good □ Novice □ Poor □ Unable | |
| 33. | I can effectively handle the design schedule. |
| □ Very good □ Good □ Novice □ Poor □ Unable | |
| 34. | I can face the pressure generated by the design work. |
| □ Very good □ Good □ Novice □ Poor □ Unable | |
| 35. | I can explain the role, responsibilities, value and contribution of industrial designer. |
| □ Very good □ Good □ Novice □ Poor □ Unable | |
| 36. | I can explain the importance of content of industrial designer. |
| □ Very good □ Good □ Novice □ Poor □ Unable | |
| 37. | I can comply with the design management guidelines. |
| □ Very good □ Good □ Novice □ Poor □ Unable | |
| 38. | I have design ethics that designer should be. (confidentiality, no counterfeit, no plagiarism) |
| □ Very good □ Good □ Novice □ Poor □ Unable | |
| 39. | I hold all things positive, optimistic attitude and curiosity. |
| □ Very good □ Good □ Novice □ Poor □ Unable | |
| 40. | I have high sensibility in popular culture and social lifestyle. |
| □ Very good □ Good □ Novice □ Poor □ Unable | |
| 41. | I can use different media (Internet, books, articles …) to collect the design information. |
| □ Very good □ Good □ Novice □ Poor □ Unable | |
| 42. | I can decipher the similarities and special needs of various regions of the world lifestyle. |
| □ Very good □ Good □ Novice □ Poor □ Unable | |
| 43. | I can use foreign language to express my design philosophy. |
| □ Very good □ Good □ Novice □ Poor □ Unable | |
| 44. | I can base on the analysis data to develop the content of product planning. |
| □ Very good □ Good □ Novice □ Poor □ Unable | |
| 45. | I can use systematize and rationalize methods to solve the problem. |
| □ Very good □ Good □ Novice □ Poor □ Unable | |
| 46. | I can explain the key point of the design problem and needs. |
| □ Very good □ Good □ Novice □ Poor □ Unable | |
| 47. | I can use PowerPoint with chart and text to clearly express ideas. |
| □ Very good □ Good □ Novice □ Poor □ Unable | |
| 48. | I can analyze the advantages and disadvantages of competing products. |
| □ Very good □ Good □ Novice □ Poor □ Unable | |
| 49. | I have a basic knowledge of statistics, to be able to interpret and collect data. |
| □ Very good □ Good □ Novice □ Poor □ Unable | |
| 50. | I can analyze different types of consumer’s consumption patterns. |
| □ Very good □ Good □ Novice □ Poor □ Unable | |
| 51. | I can develop design strategies based on different types of target market. |
| □ Very good □ Good □ Novice □ Poor □ Unable | |
| 52. | I can analyze the development, evolution, and trends of target product. |
| □ Very good □ Good □ Novice □ Poor □ Unable | |
| 53. | I can design for the trademark, logo, text, packaging, and appearance. |
| □ Very good □ Good □ Novice □ Poor □ Unable | |
| 54. | I consider the packaging, warehousing, and transport volume when packaging design. |
| □ Very good □ Good □ Novice □ Poor □ Unable | |
| 55. | I can edit the product instructions, manuals, and so on for publication. |
| □ Very good □ Good □ Novice □ Poor □ Unable | |
| 56. | I can focus on different products to design suitable packaging. |
| □ Very good □ Good □ Novice □ Poor □ Unable | |
| 57. | I was able to commercialize the product. |
| □ Very good □ Good □ Novice □ Poor □ Unable | |
| 58. | I can design display objects for the sales requirements. (POP, DM, posters exhibition space, etc.) |
| □ Very good □ Good □ Novice □ Poor □ Unable | |
| 59. | I can use green design concepts when design. |
| □ Very good □ Good □ Novice □ Poor □ Unable | |
| 60. | I have basic knowledge of patent and intellectual property rights. |
| □ Very good □ Good □ Novice □ Poor □ Unable | |
| 61. | I consider the national product safety standard when design. |
| □ Very good □ Good □ Novice □ Poor □ Unable | |
| 62. | I can use the Microsoft office series to document the design information. |
| □ Very good □ Good □ Novice □ Poor □ Unable | |
| 63. | I can use different media devices to enhance my design. |
| □ Very good □ Good □ Novice □ Poor □ Unable | |
| 64. | I can use the principle of human–machine interface design in my design project. |
| □ Very good □ Good □ Novice □ Poor □ Unable | |
| 65. | I have basic knowledge of psychological, social, and cultural design. |
| □ Very good □ Good □ Novice □ Poor □ Unable | |
| 66. | I consider the users safety when design. |
| □ Very good □ Good □ Novice □ Poor □ Unable | |
| 67. | I can apply human factor in product interface design. |
| □ Very good □ Good □ Novice □ Poor □ Unable | |
| 68. | I can apply anthropometric data in product concept design. |
| □ Very good □ Good □ Novice □ Poor □ Unable | |
| 69. | I usually use creative thinking to solving problem. |
| □ Very good □ Good □ Novice □ Poor □ Unable | |
| 70. | I can choose the appropriate design methods to help formation of the concept. |
| □ Very good □ Good □ Novice □ Poor □ Unable |
Academic Editor: Stephen D Prior
Declaration of conflicting interests
The author(s) declared no potential conflicts of interest with respect to the research, authorship, and/or publication of this article.
Funding
The author(s) received no financial support for the research, authorship, and/or publication of this article.