
Abstract
In this article, a generalized stochastic Petri net model is developed to analyze the performance of a multimachine flexible manufacturing cell. The analyzed flexible manufacturing cell consists of one or more machine(s), a single conveyor, and a single robot. The conveyor transfers similar workpieces to the robot areas. Then, the robot loads parts onto the machines, which perform similar machining processes. The machines are subject to failure after a certain time due to tool wear or resetting. When a machine is in failure, a repair action is taken by the flexible manufacturing cell operator. A generalized stochastic Petri net model is constructed for a single-machine and three-machine flexible manufacturing cells, after which the suggested generalized stochastic Petri net model can be generalized to a flexible manufacturing cell with n machines. The obtained results provide an estimate of machine, robot, and operator utilization and production rates for the considered flexible manufacturing cell. Sensitivity analysis is carried out to illustrate the effect of the input parameters on the selected performance measures. The suggested model is tested using numerical examples and simulated using TimeNet tool.
Introduction
Automated manufacturing systems such as flexible manufacturing systems (FMSs) always consist of a limited number of resources such as robots, machines, buffers, and automated guided vehicles, which are shared by various production processes in the systems. 1 There is a continuous trend for adapting such automated systems, which involve a collection of different numerically controlled machines, automated handling system, and computers that control the whole system. It usually exhibits a high degree of resource sharing in order to increase flexibility such that manufacturers can respond to production changes quickly. The existence of such resource sharing may affect the performance of such automated systems.2,3 Since FMSs are usually expensive to implement, currently, the trend in an FMS is toward small versions of FMSs, called flexible manufacturing cells (FMCs).
Performance analysis of FMCs requires considering both qualitative and quantitative properties of their suggested models. Qualitative analysis searches for structural properties of manufacturing cells like the absence of deadlocks, the absence of overflows, or the presence of certain mutual exclusions in the case of resource sharing. Quantitative analysis searches for performance aspects such as the machine utilization and production rate. Therefore, quantitative analysis is related to the evaluation of the efficiency of the system under consideration, whereas qualitative analysis is related to the effectiveness of the system. 4
Several researchers investigate the performance analysis of FMCs. 5 Madhu and Deepa 6 presented a transient analysis of an FMC consisting of two identical machines, a pallet handling system, and a loading/unloading robot when machines are subject to failure individually as well as due to common cause failure. Their computational method was developed based on Runge–Kutta approach to solve the differential difference equations governing the model in order to obtain the transient probabilities in the FMC. Savsar and Aldaihani 7 developed a stochastic model to analyze performance measures of an FMC (it consists of two machines served by a robot for loading and unloading purposes and a pallet handling system) based on different conditions, including machine failures and repairs using Markov processes. Recently, Hamasha et al. 8 suggested a stochastic model to analyze the performance of an FMC that consists of a single conveyor, a single robot, and one or more machines.
Petri nets (PNs) are a powerful tool to investigate a variety of problems in automated manufacturing systems, from modeling, 9 control,10,11 and scheduling12–14 to performance analysis. Stochastic Petri nets (SPNs) and generalized stochastic Petri nets (GSPNs) approaches have been widely used in modeling and analysis of manufacturing systems. In Tüysüz and Kahraman, 4 an approach was proposed for modeling a FMS using SPNs together with a fuzzy set theory to represent both stochastic variability and imprecision.
Al-Jaar and Desrochers 15 used GSPN modules as basic building blocks to model and analyze complex manufacturing systems. They used the analysis to derive performance measures such as average production rates and average in-process inventories. Another article addressed performance analysis problems in manufacturing systems using SPN modeling process. 16 System performance indices were derived using a software package (SPNP).
GSPNs are supported by several computerized tools such as TimeNet17–19 and PN toolbox of MATLAB20,21 and SimHPN.22–24
Performance analysis of a multimachine FMC is somewhat difficult. Therefore, this article presents a simple GSPN model for the performance analysis of an FMC consisting of multimachines when machines are subject to failure. The proposed model is used to calculate performance measures, such as production rate and utilizations of system components under different input variable conditions.
Manufacturing cell description
Figure 1 shows the FMC considered in this article that involves one or more machines, a robot, and a conveyor belt. 8 In this FMC, the conveyor belt conveys the parts to the robot with a single gripper, which picks the part up, moves, and loads it onto the free machine. Once loading operation is completed, the processing of the part starts, and when the part processing is finished, it is transferred to the next manufacturing station. During the processing, the machine is subject to stop for breakdown or tool change. If the machine stopped, the operator fixes the failure and/or change the tool.

FMC with multimachine.
The major performance measures that have been analyzed for the considered FMC are machine utilization, robot utilization, production rate, and operator utilization. This analysis is carried out based on an investigation of the changing in values of the following cell parameters: (1) the belt delivery rate, (2) robot loading rate, (3) machine processing rate, and (4) repair rate, assuming all times follow the exponential distribution.
SPN model for FMC
In the considered FMC, the parts are delivered into the cell by the conveyor. The considered cell consists of three machines, as given in Hamasha et al. 8 The robot is used to grip parts from the pallet, moves to the first machine, and loads the part. While the first machine starts operation on the part, the robot reaches the pallet again, grips the second part, moves to the second machine, and loads it into the second machine. Next, the robot reaches the pallet, grips the third part, moves to the third machine, and loads it to the third machine or reaches to the machine which finishes its operation, unloads the finished part, and loads a new part, and the process is repeated. Due to the introduction of different parts into this FMC and the different properties of the system operation, processing time, delivery of the parts, time to failure, repair time, as well as the loading/unloading times are stochastic.
Typical flows of parts can be modeled by sequences of transitions and places that correspond to the subsequent FMC. Figure 2 shows the developed GSPN model for the considered FMC.

The developed SPN model for an FMC.
Description of places and transitions of the suggested model are illustrated in Table 1.
Description of places and transitions of the GSPN model.
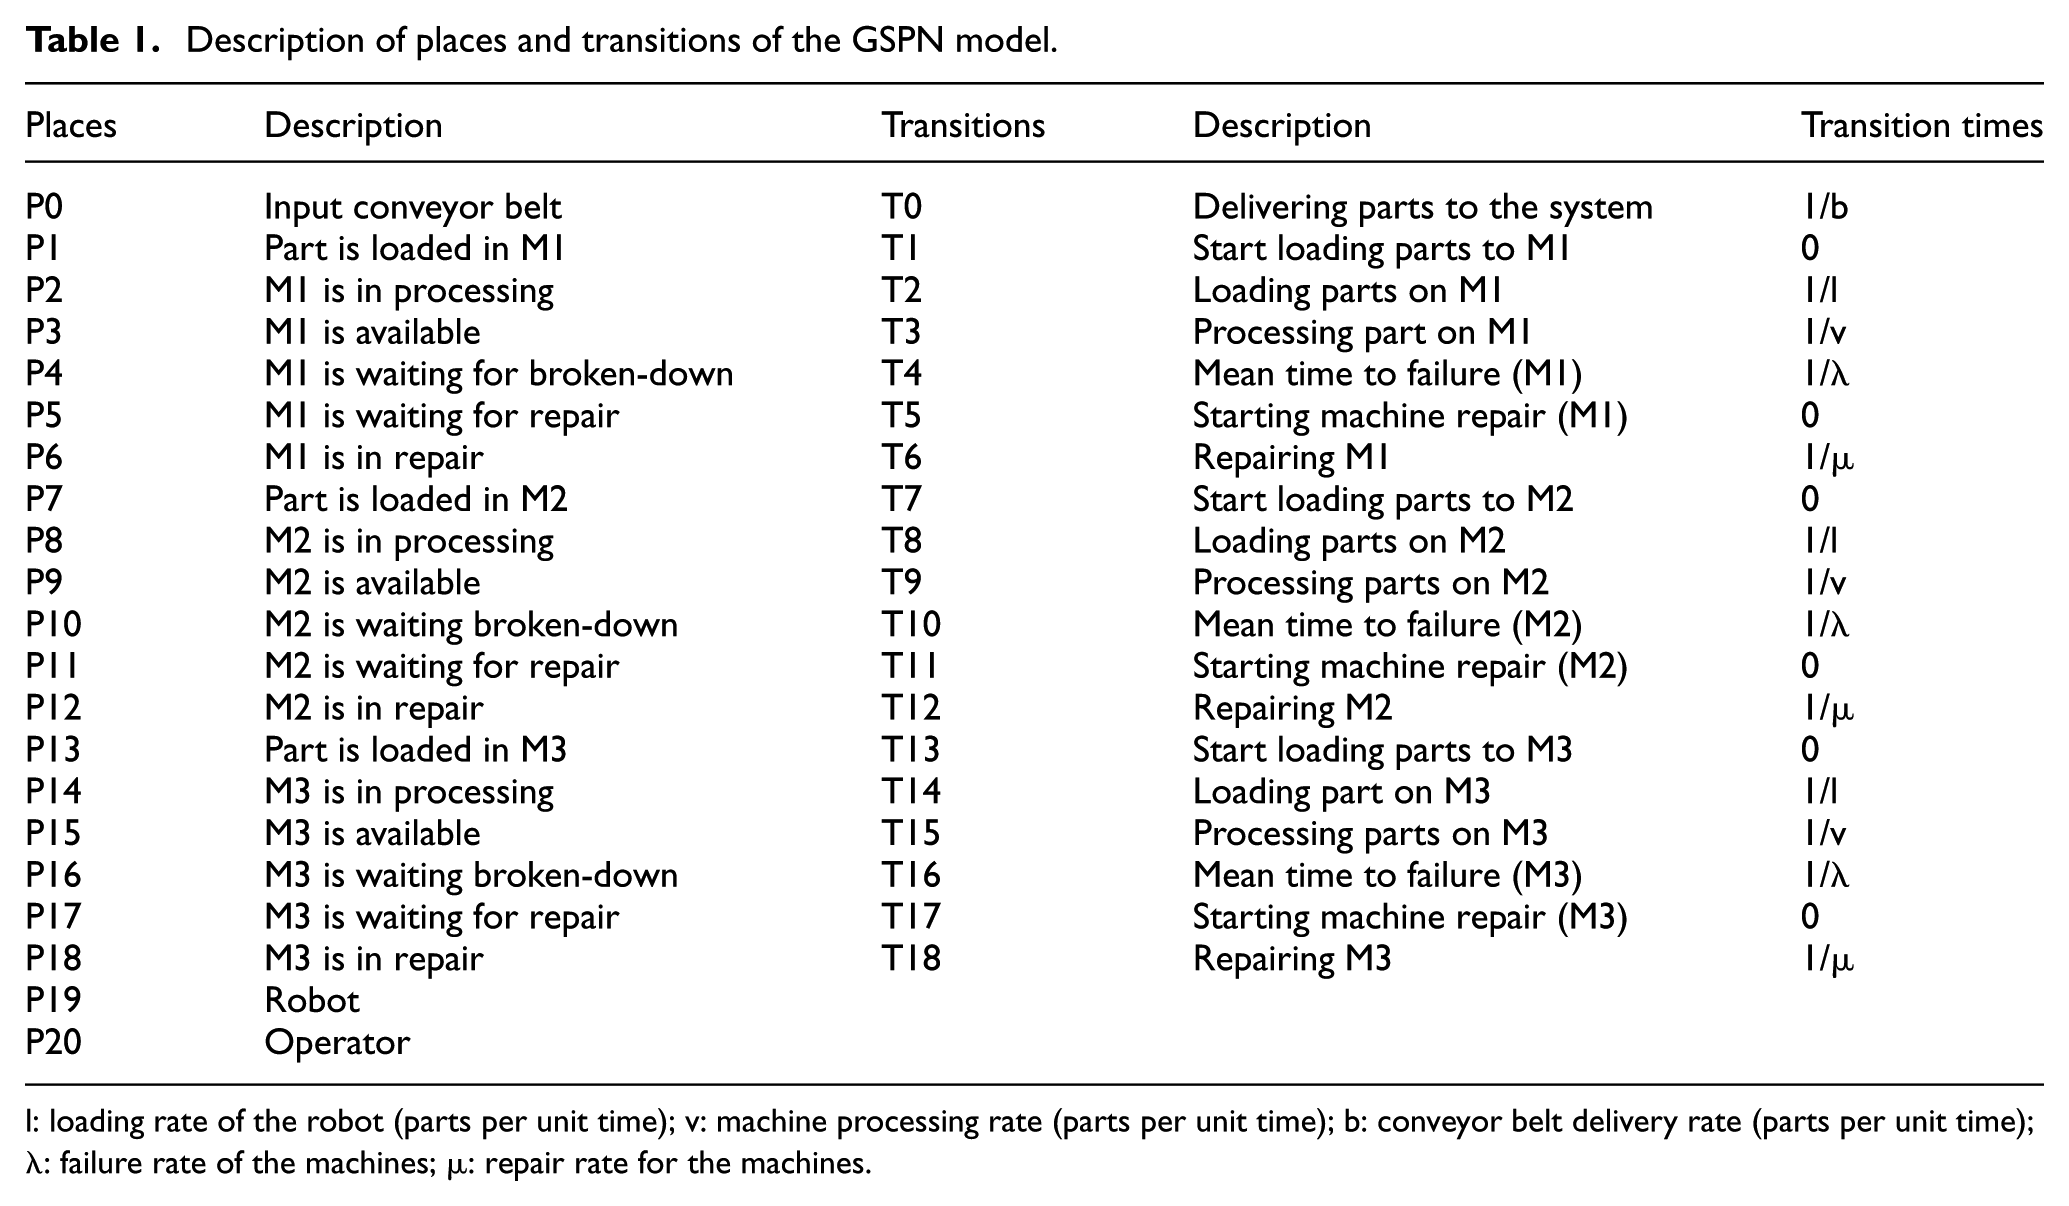
l: loading rate of the robot (parts per unit time); v: machine processing rate (parts per unit time); b: conveyor belt delivery rate (parts per unit time); λ: failure rate of the machines; µ: repair rate for the machines.
In this article, handling time of the pallet conveyor is represented by the firing time of T0. The firing time can be adjusted based on the speed of pallet delivery of part from storage. Loading activities and their associated times are represented by T1, T8, and T14 in the developed GSPN model for the three machines. Firing times of transitions T3, T9, and T15 represent machining times for M1, M2, and M3, respectively. Tool lives (or time to machine failure) and tool change times are represented by (T4, T6), (T10, T12), and (T16, T18) for the three machines.
Analysis of results
The input data of this FMC are illustrated in Table 2.
Input data for the considered FMC.

Given the above input data for the considered FMC, simulation of this system is carried out based on the developed GSPN model. The FMC performance is measured using the overall machine, robot and operator utilizations, and the production rate. The utilization is estimated by calculating the probability of tokens in a place that represent the machine. The TimeNet software is used for simulating the developed GSPN model.19,25 Utilization of M1, M2, and M3 is computed as P{#P2 > 0}, P{#P8 > 0}, and P{#P14 > 0}, respectively. The robot utilization is calculated as P{#P19 = 0}. The operator utilization is found as P{#P20 = 0}. Also, production rate is computed as (P{#P2 > 0} + P{#P8 > 0} + P{#P14 > 0})*v.
Figures 3–6 illustrate the effect of the conveyor delivery rate, robot loading rate, processing rate, and repair rate on the machine utilizations. These effects are considered against several values of the other input factors. The effect of conveyor delivery rate on machine utilization is shown in Figure 3. Four pairs of robot loading rate and processing rate are investigated. It can be observed that machine utilization increases as the conveyor delivery rate increases. The higher machine utilization is achieved when loading rate is high and process rate is low.

Effect of conveyor delivery rate on machine utilization.
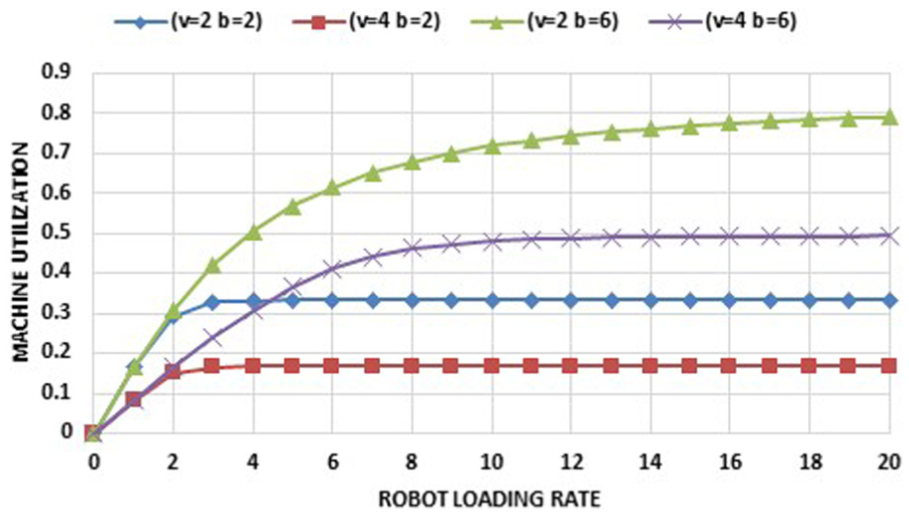
The effect of robot loading rate on machine utilization.

The effect of processing rate on machine utilization.

The effect of repair rate on machine utilization.
Figure 4 shows the effect of robot loading rate on machine utilization. It is obvious that machine utilization increases as robot loading rate increases. The trend of machine utilization reaches its steady state earlier when process rate is high and conveyor delivery rate is low.
Figure 5 illustrates the effect of machine processing rate on machine utilization. The machine utilization decreases as processing rate increases. The changes in robot delivery rate and robot loading rates do not demonstrate much difference in machine utilization. It should be noted that increasing processing rate results in increasing machine utilization.
The considered FMC is subject to failures according to machine or tool breakdowns. This requires stopping the machine, and the FMC operator carries out repairing tasks. The repair rate is considered against machine utilization, as illustrated in Figure 6. Figure 6 shows that machine utilization increases as repair rate increases. The plots illustrate that higher machine utilization is associated with high robot loading rate, high conveyor delivery rate, and low processing rate.
Figures 7–10 illustrate the effect of the selected FMC parameters on the robot utilization. Robot utilization increases as the conveyor delivery rate increases. When conveyor delivery rate increases with higher processing rate and low loading rate, the robot utilization increases, as shown in Figure 7.
The effect of conveyor rate on the robot utilization.

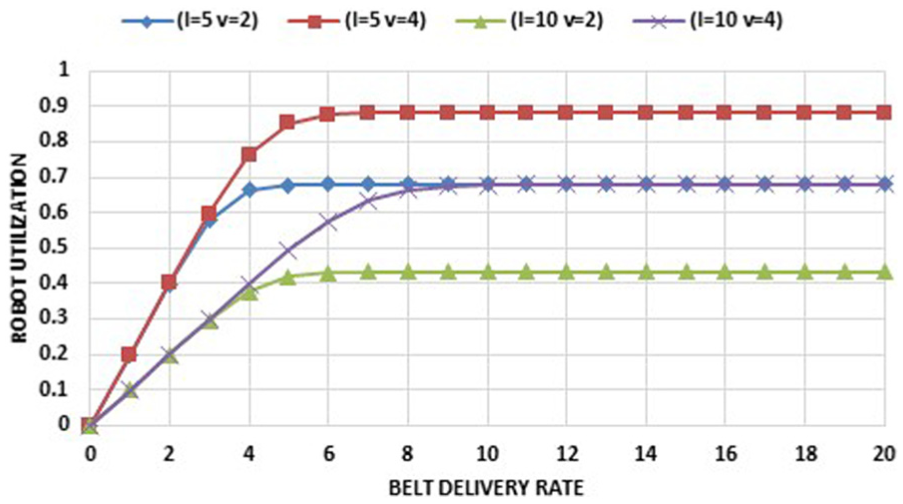
The effect of robot loading rate on robot utilization.

The effect of machine processing rate on robot utilization.

The effect of repair rate on the robot utilization.
Figure 8 shows the effect of robot loading rate on robot utilization. It can be observed that robot utilization decreases as robot loading rate increases due to increase in the number of robot stops between parts. Figure 8 illustrates that better robot utilization is achieved with high values of processing and conveyor delivery rates.
Figure 9 shows the effect of machine processing rate on robot utilization. Robot utilization increases as machine processing rate increases. It is also clear that the higher robot utilization is obtained when the values of robot loading rate are low and conveyor delivery rate is high.
Figure 10 illustrates the effect of repair rate on the robot utilization with different values of loading, processing, and delivery rates. The results show that if the repair rate increases, the robot utilization increases. The utilization of a robot would be higher with the lower value of the loading rate, medium value of delivery rate, and low value of processing rate.
Figures 11–14 illustrate the effect of the considered FMC factors on production rates. The plots show that the production rates increase as the conveyor delivery rate, robot loading rate, machine processing rate, and repair rate increase. Higher values of the conveyor delivery rates with high values of processing rate and high value of loading rate provide higher production rates (Figure 11). Also, the higher values of robot loading rates with higher values of conveyor delivery rate and machine processing rate provide higher values of production rates, as shown in Figure 12. It is clear from Figure 13 that the effect of conveyor delivery rate is more significant than the robot loading rate on production rate when the machine processing rate increases. Figure 14 shows that the production rate increases when the repair rate or tool change rate increases. It has been found that the production rate is better with high values of the delivery rate and robot loading rate and low value of the machine processing rate when repair rate is increased.

The effect of conveyor delivery rate on the production rate.

The effect of robot loading rate on production rate.
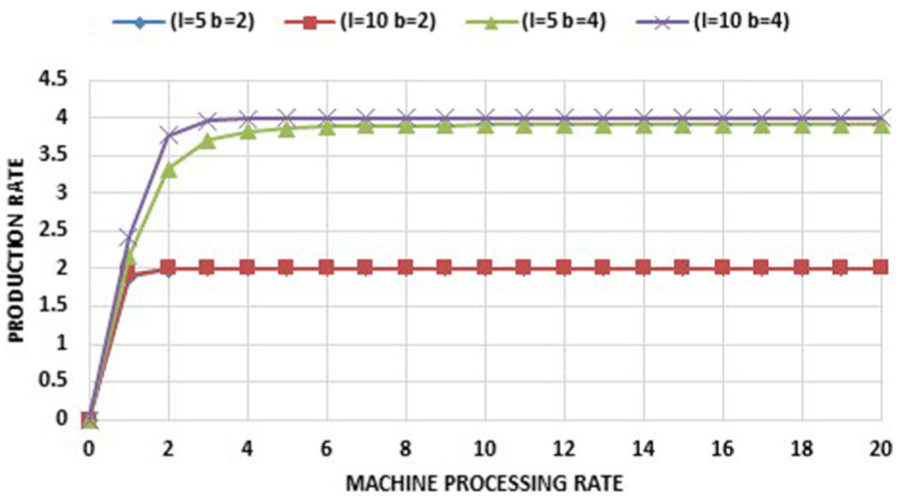
The effect of machine processing rate on the production rate.
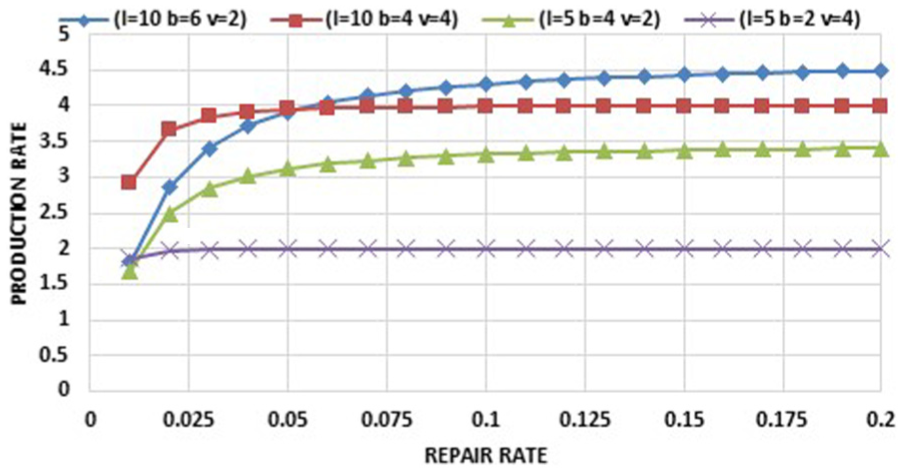
The effect of repair rate on the production rate.
Figures 15–18 illustrate the effect of the selected FMC variables of the operator utilization. The operator carries out repairing tasks for the machines and changes the tools. These effects are considered against several values of the other input factors. The effect of the conveyor delivery rate on the operator utilization is shown in Figure 15. Four pairs of the robot loading rate and processing rate are investigated. It can be observed that the operator utilization increases as the conveyor delivery rate increases. The higher operator utilization is achieved when the loading rate is high and the processing rate is low. Figure 16 shows the effect of the robot loading rate on the operator utilization. It is obvious that the operator utilization increases as the robot loading rate increases. The trend of the operator utilization reaches its steady state earlier when the processing rate is high and the conveyor delivery rate is low. Figure 17 illustrates the effect of the machine processing rate on the operator utilization. The operator utilization decreases as the machine processing rate increases. The variations in the robot delivery rate and robot loading rates do not demonstrate much difference in operator utilization. It should be noted that increasing processing rate results in increasing operator utilization. The repair rate is considered against the operator utilization, as illustrated in Figure 18. Figure 18 shows that the operator utilization decreases as the repair rate increases. The plots illustrate that higher operator utilization is associated with high robot loading rate, high conveyor delivery rate, and low processing rate.

The effect of conveyor delivery rate on operator utilization.

The effect of robot loading rate on operator utilization.
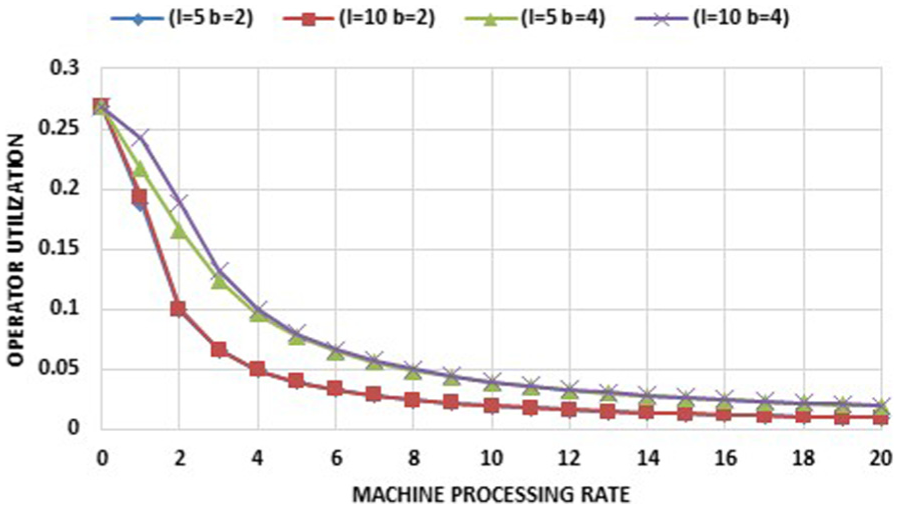
The effect of machine processing rate on operator utilization.
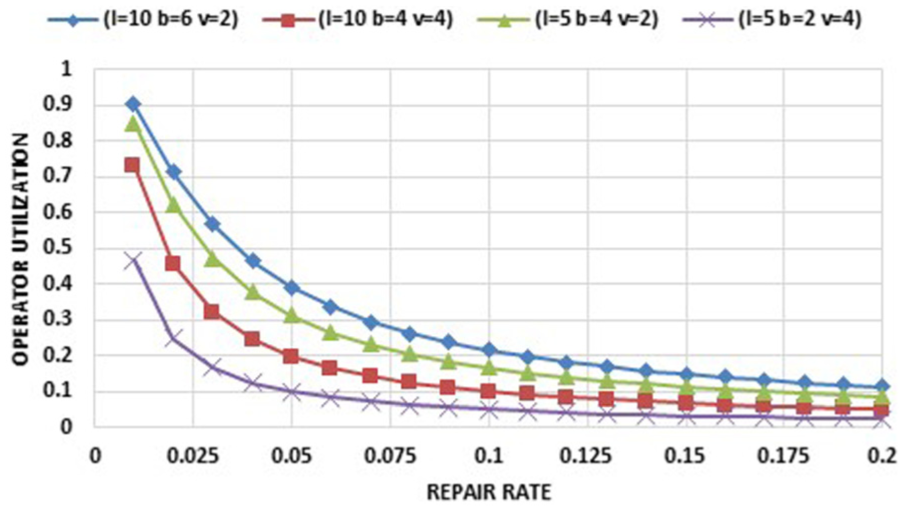
The effect of repair rate on operator utilization.
The above analysis indicates that the performance of an FMC can be improved by providing sufficiently higher belt delivery rates, loading/unloading rates of robot, and repair rate of the machine. It is also concluded that the best combinations of system input factors can be selected for the considered FMC.
The developed GSPN model can be extended to any number of FMC machines, as illustrated in Figure 19. Other resources can also be installed in a similar manner. The model includes machine breakdowns that significantly affect the system performance. The suggested GSPN model provides insights into methods of monitoring the part movements and the workflow in an FMC. Therefore, it is possible to build cell controllers that take into consideration machine breakdowns in FMCs.

The GSPN model for FMC with n machines.
Conclusion
The considered FMC is stochastic in nature that can be effectively modeled and analyzed using the GSPN approach. Therefore, this article presents a GSPN model for the considered multimachine FMC that consists of a pallet, a robot with single gripper, and several machines to estimate the effect of several input variables such as pallet capacity, machining speed, loading/unloading rate, pallet delivery rate, and tool change time on production rate and turning machine, robot, and operator utilizations. A numerical example with different scenarios of input variables is conducted and simulated to test the suggested GSPN model.
In general, it can be concluded from the result analysis that the utilizations of the machines, robot, and maintenance operator increase as the conveyor delivery rate increases. The associated high values of the loading rate and processing rate provide higher values of production rates. It is not necessary that achieving higher machine utilization leads to higher production rate. The results also indicate that the production rate and machine and operator utilizations increase and robot utilization decreases as the loading rate increases. The best production rates are obtained when conveyor delivery and processing rates are high. Increasing the machine processing rate has a positive effect on the production rate and robot utilization and negative effect on machine and robot utilizations. Finally, the analysis shows that the production rate, machine utilization, and robot utilization increase and operator utilization decreases as repair rate increases.
The suggested model can be adapted to include other system variables and features such as more machine, double gripper robot, and different processing sequences.
Footnotes
Academic Editor: Ramoshweu Lebelo
Declaration of conflicting interests
The author(s) declared no potential conflicts of interest with respect to the research, authorship, and/or publication of this article.
Funding
The author(s) disclosed receipt of the following financial support for the research, authorship, and/or publication of this article: This project was financially supported by the Vice Deanship of Research Chairs of King Saud University.