
Abstract
The friction and wear behavior exists in ultra-deep coal mine between multi-layer winding hoisting ropes, and it decreases the rope’s service life directly, which threatens the safety coal mine hoist. In order to obtain the tribological properties of winding hoisting rope, the effects of sliding velocity, displacement amplitude, and their combination on the tribological behavior of winding hoisting rope in ultra-deep coal mine were investigated on a self-made test rig. The results show that the effect of velocity on the coefficient of friction and temperature rise is more obvious than the stroke. Additionally, the mean value of the coefficient of friction in steady stage decreases from 0.721 to 0.524 with an increase in velocity and stroke at the same time. Furthermore, the temperature rise increases from about 3.43°C to 13.73°C with the velocity at stable stage, and the stroke has little influence on the temperature rise. Moreover, with the increase in velocity and stroke simultaneously, the damage in the wear region does not become more severe. In addition, the wear mechanisms include abrasive wear and adhesive wear, and its wear characteristics in the wear region are plastic deformation, pits, furrows, broken wires, cracking, and spalling.
Introduction
In recent years, the energy shortage has become more and more obvious with the rapidly increasing demands of social and economical development for mineral resources. Therefore, exploring more deeply into the earth for mineral resources has become an important strategic choice of China. However, due to the limitation of hoisting weight and height, multi-rope mining friction hoist which is widely used in China coal mine cannot complete the resource exploitation in ultra-deep coal mine. Therefore, multi-layer winding hoist has become the best choice for hoisting equipment in China ultra-deep coal mine with its superior hoisting capacity (hoisting height is more than 1700 m, hoisting weight is more than 40 t). However, according to the coal mine safety rules in China, 1 the number of winding layers of wire rope on the drum of hoister must be one layer when lifts people in vertical shaft and two layers when lifts materials alone, which seriously hinders the progress of resource exploitation in ultra-deep coal mine. While, the main reasons are that the friction characteristics and wear mechanisms of wire rope between layers and adjacent ropes in the same layer have not been understood. Additionally, the friction is diversiform in actual hoisting condition. Considering the vibration, contact squeeze and great contact pressure between wire ropes always occur during hoisting, which will result in the relative sliding friction between ropes on the drum. Furthermore, such serious extrusion and relative slide will occur periodically between adjacent wire ropes when hoisting rope winds on the drum during the continuous hoisting. As tension difference exists between internal and outer layers, fretting wear is one of the important friction forms. Additionally, impact friction always occur when the rope winds on the drum, because there is serious extrusion between adjacent ropes in the same layer in that process, which will cause large static friction force and then lead to impact friction. Furthermore, those frictions will cause wear, crack, and fatigue fracture of serving wire rope and then affect its safety and reduce the service life. Therefore, it is of great importance to investigate the friction and wear behavior of winding hoisting rope. In this study, the sliding friction between ropes was selected and the effects of different sliding conditions on friction characteristics were studied, which will provide important basic data for the design of multi-layer winding hoist in ultra-deep coal mine and contribute to the rational application and lubricant selection of wire rope, then prolong its service life.
Therefore, correlational research about the friction and wear behavior of wire rope has been carried out by many scholars. Considering the fretting friction phenomenon between internal steel wires in the rope, Cruzado et al.2–5 investigated the fretting wear properties of thin steel wires under different contact load and crossing angle, and the change of coefficient of friction and wear rate were analyzed emphatically through experiments. In order to predict the wear scar of steel wires, they also developed a finite element (FE) model to simulate the friction behavior of wires and this method proved to be feasible. Zhang et al. 6 studied the fretting fatigue behaviors of steel wires used in coal mine, and the morphological features of fretting scar and fracture surface were analyzed through a fretting fatigue test equipment under different strain ratios. Zhang and colleagues7–9 investigated the effect of different strain amplitude, terminal mass, and displacement amplitude on fretting behavior of wires, and the fretting fatigue life was analyzed. Périer et al. 10 explored the effects of water on the fretting behavior between two cable wires, and the coefficient of friction and contact characteristics were analyzed. Furthermore, because the actual hoisting environment of coal mine is very complex and bad, many studies about the effect of different corrosive mediums on fretting fatigue of wires were carried out.11–15 In addition, the friction damage of wire rope is varied; there are many other forms in the actual working condition: Oksanen et al.16,17 conducted a series of friction and wear tests between rollers and wire ropes, and the wear mechanism and the effects of contact pressure on the wear behavior between them were studied. Peng et al.18,19 explored the effect of tension, dynamic, and thermomechanical properties of friction lining on the coefficient of friction between wire rope and lining. Ma et al. 20 studied the effect of friction-promoting grease on sliding friction and wear properties between wire rope and friction lining, and the differences between dry friction and greased condition were compared. Moreover, in order to reduce the time and economic costs brought by large number of experiments, the simulation technology was employed to investigate the damage properties of wire rope. Stanova et al.21,22 created a mathematical geometric model of multi-layered strands in CATIA V5 software and implemented in a FE program through ABAQUS/Explicit software, which predicted the behavior of the wire rope under tensile loads successfully. Cruzado et al. 23 developed FE fretting wear simulation model; the wear scars were predicted accurately and the effects of fretting wear on fatigue of wires were analyzed. Argatov et al. 24 developed a mathematical model of fretting wear based on the Archard–Kragelsky wear law and the wear parameters between wires were analyzed. In order to comprehensively understand the tribological properties of material, Yang and colleagues25,26 studied the friction and wear behavior between carbon strip and wire pair, and the influences of vibration and inclination angle were analyzed. Mbarek et al. 27 investigated the characterization of the distribution of friction, temperature, and wear in the regions close to the pitch point of the contact between the teeth of a polyamide-steel gear and found that the temperature evolution with test time is comparable to that of the friction coefficient. Xiao et al. 28 summarized the influential rules and mechanism of braking conditions (temperature, pressure, and velocity) on the friction and wear behavior of friction materials, and the influences of temperature on friction and wear of brake’s friction materials were analyzed emphatically. However, the previous efforts mainly focus on the friction behavior of steel wires; the sliding friction characteristics between ropes in multi-layer winding hoist have not been previously reported, and the previous study results are not suitable for this situation.
Therefore, the objective of this study is to explore the tribological properties of winding hoisting rope under different sliding conditions. A series of tests under different sliding velocity and sliding amplitude have been carried out using a self-made test rig. However, the influence factors do not appear alone in the actual working condition; they usually change at the same time. Therefore, the effects of that velocity and amplitude change simultaneously on the friction and wear behavior were investigated in this article. In order to fully understand the effects of different parameters on sliding friction of ropes, the coefficient of friction, friction temperature rise, wear scars sizes, and sliding failure mechanisms were analyzed, respectively.
Experimental details
Test materials
In this work, the 6×19+FC (6 stands with 19 individual wires in each one and with a fiber core) point contact rope (Figure 1) was selected (rope diameter is 10 mm and internal wire diameter is 0.6 mm) for experimental tests. For the serious sliding friction damage of ropes always occur under poorly lubricated condition, the galvanized ropes with smooth surface were selected and there is no lubrication between friction couple. Additionally, the strand pitch is 70 mm and the strand lay angle is 17.4°, nominal tensile strength is 1570 MPa, and breaking force is 52,500 N.
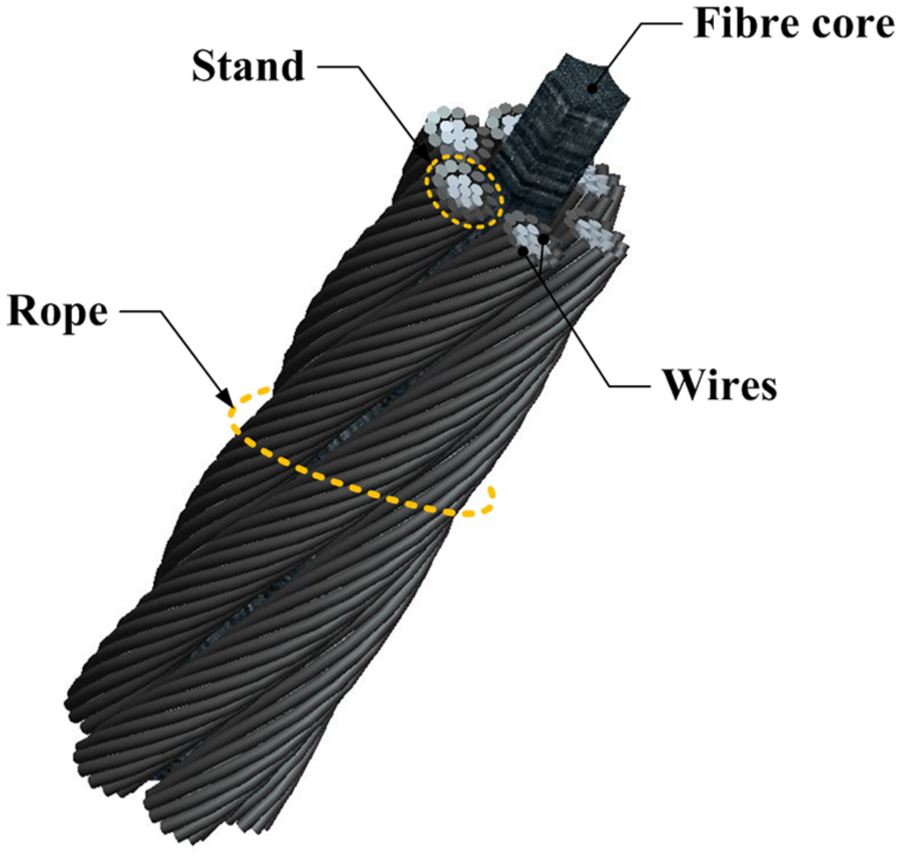
6×19+FC wire rope.
Sliding friction test rig
The self-made sliding friction test rig is evolved from crank-slider mechanism as shown in Figure 2. Furthermore, the form of friction was simplified to two wire ropes sliding contact with the crossing angle of 90°. Additionally, the test apparatus mainly consists of driving device (adjustable-speed motor, eccentric hole disk), sliding device (sliding support, fixed bearing), tensioning device (turnbuckles, upper jig, support plate), rotating device (rotating table), and some transducers.

Friction test rig.
By the driving of adjustable-speed motor, the sliding support can realize reciprocating motion with different velocity (v) on the fixed bearing, the reciprocating sliding amplitude can be adjusted though the eccentric hole disk. Just as the movement characteristics of crank-slider mechanism, the sliding support will complete two motion processes (extending stroke, return stroke) after the motor rotates one cycle and each stroke (x) equals the double of displacement amplitude (A). Each test needs two rope samples (upper loading rope and axial sliding rope), and the axial sliding rope is tensioned in the sliding support before the experiment; therefore, the axial sliding rope can motion with the sliding support. In order to guarantee the contact load between friction couple, the support plate is fixed on a linear guide rail under the axial sliding rope as shown in Figure 2(c); then, the degree of freedom is constrained in the vertical direction of the axial sliding rope and the contact pressure between the two samples is realized. The tensioning force of the wire ropes is adjusted by turnbuckles and the values are recorded by compression transducer and tension transducer, respectively. The initial tensioning force of 2000 N is selected in each test. Different contact loads (Fn) are adjusted through loading blocks, but the load is the sum of gravity of loading block, upper jig, and upper loading rope. Additionally, the friction force and temperature rise in the friction region can be observed through pull pressure sensor and thermal infrared imager, respectively.
Test conditions
To understand the influence of different parameters on the sliding friction behavior of wire rope, different values of velocity, stroke, and their combination were determined before each test. Under the effects of irregular vibration and great contact pressure, the relative sliding with different velocity and distance will occur between adjacent ropes and ropes among layers. In addition, this two influence parameters are uncertain and their changes always occur at the same time; therefore, the velocity and stroke range from 6 to 42 mm/s and 10 to 70 mm were studied in this article, respectively. Furthermore, all the experiments can be divided into three groups according to different variable parameters as shown in Table 1. Additionally, the total sliding distance (S) of all the groups is equal which corresponds to the product of the double of stroke (x) and the cycles (n). The other detailed parameters and test conditions are displayed in Table 1.
Sliding friction condition for different tests.

Data acquisition methods
The coefficient of friction, temperature rise, and wear scar parameters are what we need to obtain and analyze, and all the data can be acquired through different data acquisition devices. The data of friction force can be achieved through computer acquisition system which can realize the real-time monitoring and data storage during each test. Figure 3 shows the data curve of friction force collected after any two cycles. However, because the surface of wire rope consists of wires and stands, uneven surface may result in the oscillation of friction force. In addition, as the sliding stroke is 70 mm, there are seven stands in axial sliding rope sliding contact with the upper loading rope for one stroke (strand pitch is 70 mm), so seven obvious peaks occur in the curve of extending stroke as shown in Figure 3. Furthermore, the mean coefficient of friction fav in this article represents the average value calculated from the friction force of extending stroke following equation (1)
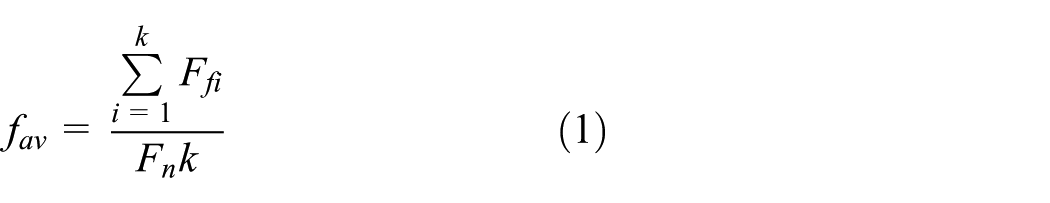
Ff is friction force collected during extending stroke, Fn is contact load, and k is the number of collected points in single extending stroke. Therefore, the variation of the mean coefficient of friction with the increase in sliding distance was obtained.

Friction force curve (stroke: 70 mm; velocity: 6 mm/s).
The temperature rise of wire rope in the friction region was obtained through the thermal infrared imager which can realize real-time monitoring, signal processing, recording, and display. Figure 4 shows the picture captured by the thermal infrared imager and the color corresponds to the temperature distribution; the more lighter the color, the higher the temperature, and the lighter area in the picture corresponds to the sliding friction region. In addition, the temperature at every point in the image can be obtained. Temperature rise

Infrared thermogram of wire ropes (velocity: 18 mm/s; stroke: 30 mm).
The overall dimensions and morphology of the wear scars were acquired through the industrial microscope and its supporting software after the experiments are completed. Figure 5 shows the wear scar of upper loading rope and its size measurement image of the software. It can be seen that the wear scar is similar to ellipse; therefore, in order to quantificationally reveal the wear degree, the projected area Smax and the maximum wear depth hmax of wear scar of the upper loading rope were selected to analyze, respectively. Considering the structure and contact characteristics of wire rope, the upper loading rope may be seen as cylinder here; therefore, the maximum wear depth can be calculated through the following equation (2) 29

where R is the radius of upper loading rope and Wmax is the maximum width of wear scar. In addition, the maximum wear width and length Lmax were measured through the supporting software of industrial microscope. Furthermore, the worn-out appearance of all the test specimens was also observed to analyze the sliding wear mechanism.

Wear scar of upper loading rope and its measuring image of software (velocity: 18 mm/s; stroke: 70 mm).
Results and discussion
Variation of the coefficient of friction under different conditions
Figure 6 presents the evolution of the coefficient of friction with increasing sliding distance under different conditions and the variation of its average value at stable friction stage with the change of sliding parameters (velocity and stroke). It can be seen that the evolution of the coefficient of friction with the increase in sliding distance for all the tests is similar, which increases rapidly at first, then slowly increases for a short distance, and finally stabilizes to a constant value, respectively. It is a common law which has been shown in other paper. 27 While the differences between the three groups of tests are also obvious, the effects of the velocity on the coefficient of friction are shown in Figure 6(a). The initial increase (about 0–2000 mm) of the coefficient of friction is not obvious, then all the curves almost increase linearly as the sliding distance increase from about 2000 to 10,000 mm, and finally, they tend to be stable and stabilize to relative constant values, respectively. However, it can also be seen that with the increase in velocity, the coefficient of friction increases first before the velocity less than 18 mm/s and then it decreases from 0.708 to 0.524. It means that the influences of velocity on the coefficient of friction are not consistent, which increases under low velocity condition (less than 18 mm/s) and decreases with high velocity, the reasons have been described in section “Wear behavior.” Therefore, the coefficient of friction has a minimum value at the velocity of 18 mm/s, which is about 0.708. Furthermore, the influence of stroke on the coefficient of friction can be obtained from Figure 6(b). Different from Figure 6(a), the initial increase is rapid as the sliding distance is less than 5000 mm and tend to stable faster except that of stroke at 70 mm, which is stable after the distance of 10,000 mm. In addition, the variation of the average values of the coefficient of friction at stable stage for different strokes is small, and it decreases from 0.721 to 0.615 with an increase in stroke. Figure 6(c) presents the variation of the coefficient of friction with the change of the velocity and stroke simultaneously. In general, its evolution is more similar to Figure 6(a), and the sliding distance to the relative stable stage becomes longer and longer with an increase in the two parameters. When the velocity and stroke is 6 mm/s and 10 mm, respectively, the sliding distance is about 4500 mm then the coefficient of friction achieve stability, however, it is almost 10,000 mm as the velocity and stroke is 42 mm/s and 70 mm, respectively. It indicates that the friction balance is hard to be realized and the wear becomes more severe as the two factors change simultaneously, which corresponds to the results shown in section “Wear behavior.” Furthermore, with the increase in these two parameters, the coefficient of friction decreases from 0.721 to 0.524.

The evolution of the coefficient of friction under different sliding conditions.
From Figure 6, it can be observed that the effect of sliding velocity and stroke on friction behavior mainly reflects on the speed rate of the coefficient of friction increases, the sliding distance to relative stable stage, and the average values of the coefficient of friction at stable stage. At the beginning of each test, it is approximate to point contact between upper loading rope and axial sliding rope, and the surface is very smooth, so the coefficient of friction is smaller. However, this contact condition also results in great contact pressure and plastic deformation of outside steel wires, which will accelerate the destruction of the surface and cause severe wear; therefore, the coefficient of friction increases rapidly at first. Then, the contact area becomes larger and contact pressure decreases, so the wear becomes slow and tends to be balance, but it is stable to different values under different sliding conditions, a similar tendency has been reported by Cruzado et al.2,3 In addition, because the friction surface consists of the outside steel wires and it is not a complete plane, some fluctuations appear in the curves. Furthermore, it can be seen that the effect of velocity on the coefficient of friction is more distinct at the stable stage. This is because different sliding velocities are easier to form different friction couple surfaces as shown in Figure 11, and when the velocity and stroke vary simultaneously, the velocity plays a dominant role in the influence of the coefficient of friction, which can be seen in Figure 12. Therefore, if the coefficient of friction is required to maintain in a small range, the sliding velocity between wire ropes should be focused more attention to control.
Variation of the temperature rise under different conditions
The infrared thermograms of all the tests before the end are shown in Figure 7, which can intuitively reflect the wear region and its temperature distribution. In addition, the lighter areas correspond to the regions where relative sliding friction occurs. Therefore, it can be seen from Figure 7(a)–(e) that the color change of the friction regions is obvious and the bright region is enlarged with the velocity, which indicates that high-speed sliding friction is easier to result in high temperature in the wear region at the same stroke (70 mm). 28 However, when the stroke increases from 10 to 70 mm with the same velocity (6 mm/s), the color of the friction region has little change, which is shown in Figure 7(a) and (f)–(i). It means the influence of stroke on the friction temperature is not obvious, maybe the reason is the differences between the heat dissipation conditions caused by the strokes, the longer the stroke is, the better the heat dissipation condition becomes, thus, the longer stroke can produce more friction heat, but it loss more too. Therefore, the change of the color in the contact region reflected in the picture is small. Furthermore, when the velocity and stroke increase at the same time, the color change is also obvious which is similar to the condition of different velocity as shown in Figure 7 (e), (f), and (j)–(l). This is because the velocity plays a more important role in the influence of friction heat and it is consistent with the results of the coefficient of friction. This is a method to qualitatively analyze the variation of friction heat under different sliding conditions, and its quantitative analyses were carried out through Figure 8.

Infrared thermogram for different test parameters: (a) means that test parameters for each image are similar, the stroke are all 70mm and the velocity changes from 6mm/s to 42mm/s, (b) the velocity are equal, and the stroke increases from 10mm to 50mm, and (c) means the velocity and stroke change at the same time.

The evolution of temperature rise under different sliding conditions.
Figure 8 presents the evolution of the temperature rise with the increase in sliding distance in the case of different test conditions and the variation of its average value at relative balance stage as the increase of different sliding parameters. From Figure 8(a), it can be seen that with the increase in sliding distance, the temperature rise increases steady for different sliding velocity until about 11,000 mm and then it increases slowly but still rising. Moreover, with the increase in sliding velocity, the average value of temperature rise at the relative balance stage increases from 3.43°C to 13.73°C, especially as the velocity increases from 30 to 42 mm/s, its growth is most obvious (about 4°C). Furthermore, the influence of stroke on temperature rise is shown in Figure 8(b), from which, it is clear that the rapidly increasing stage is shorter (about 6000 mm), and the temperature balance stage is more obvious except the stroke of 50 and 70 mm, which increase slowly after 6000 mm but remain increasing. Additionally, with the increase in sliding stroke, the temperature rise at relative balance stage shows decreasing trend, but the variation is small (from 5.4°C to 3.43°C). Figure 8(c) shows the variation of temperature rise with the change of velocity and stroke at the same time. It is clear that the growth rate of the temperature rise is similar before the sliding distance of 5000 mm and then increases slowly and gradually to balance, respectively. In addition, the balance stages of different conditions are relatively obvious. Furthermore, with the increase in velocity and stroke simultaneously, the temperature rise at relative balance stage increases from 5.4°C to 13.73°C.
The friction heat is one of the important factors which affect the friction characteristics (oxidation, thermal strength, and thermal plasticity of friction material). 28 With increasing sliding distance, the damage of the wire rope becomes more and more severe and the wear regions will also become larger; therefore, the temperature rise in the wear region shows a tendency to increase during all the tests. However, the wear process is quickly at first, then becomes slowly with the contact condition changes from point to surface, the heat generation becomes slower, considering the heat diffusion, so there is a balance stage in the curve of temperature rise curve as shown in Figure 8. In addition, the higher velocity is easier to produce more heat in a relatively short time, and there is little change with the increase in stroke in the case of the velocity is constant. Furthermore, as the velocity and stroke increase at the same time, the variation of temperature rise has occurred with no significant change compared with the case of the velocity as shown in Figure 8(a) and (c). Therefore, the influence of velocity on the temperature rise is more obvious than the stroke, and the effects of friction surface on temperature rise are explained in section “Wear behavior.” The friction heat is not so obvious in actual working condition, but the transient temperature arising is large and the temperature of asperities may be much higher than that of surface, which then forms local high-temperature zones. 28 Therefore, high velocity and large stroke between ropes should be avoided to reduce the influences of friction heat.
Wear behavior
The projection area of wear scars of upper loading ropes under different test conditions are shown in Figure 9. It can be seen that the variation of the projection area is different with the change of different parameters. For the wear scars are similar to ellipse, the size of the projection area depends on the maximum wear width Wmax and length Lmax in this article. From Figure 9(a), it is clear that the change laws of the projection area are contrary with the velocity and stroke, respectively. It decreases from 15.1 to 9.46 mm2 with the velocity increases from 6 to 42 mm/s. However, with the increase in stroke, the projection area increases from 10.34 to 15.1 mm2. This indicates that high sliding velocity is not conducive to the enlargement of wear scar when the contact load is small (100 N), and the larger stroke is easier to enlarge the wear region, which will cause more serious damage to wire rope. Furthermore, as the velocity and stroke increase simultaneously, there is little change for the size of projection area, and the steady value is about 9.82 mm2. Therefore, the velocity and stroke change in both will lead to less damage for wire rope; in a sense, it can protect the rope from the sliding friction damage.

The projection area of wear scars for upper loading rope under different test conditions.
The wear depth is one of the most important factors which influence the hoisting capacity of wire rope; thus, these values under different test parameters are also calculated in this article. Figure 10 shows the variation of the maximum wear depth of upper loading rope with the change of velocity and stroke, respectively. It is clear that the change rules of wear depth are similar to the projection area shown in Figure 9. Additionally, with the increase in velocity, the maximum wear depth decreases from 0.23 to 0.15 mm and it increases from 0.16 to 0.23 mm with the stroke. Moreover, with the increase in velocity and stroke simultaneously, the wear depth approximate stability is 0.15 mm as shown in Figure 10(b). Therefore, these results indicate that higher velocity can reduce the wire rope damage and larger stroke will make the damage more serious. 14 Furthermore, as the velocity and stroke increase simultaneously, it will not result in more severe damage to wire rope. Therefore, considering the vibration and wear between ropes are unavoidable, a good lubrication could be provided in the places where large stroke occurs.

The maximum wear depth of wear scars for upper loading rope under different test conditions.
The surface morphology of friction couple directly determines the friction and wear characteristics; therefore, the analysis of the surface of wear scar is necessary to understand the tribological behavior of winding hoisting rope. Figure 11 presents the industrial microscope images of sliding wear scars of upper loading rope under different velocity and stroke, and the magnification of the whole profile and partial detail of wear scar is 32 and 96, respectively. It can be seen that when the velocity is 6 mm/s, the wear scar is composed of many grooves in the direction of sliding which is caused by the outer wires of the axial sliding rope. Furthermore, with the increase in stroke, the wear region becomes larger and the grooves become deeper, and as the stroke increases to 70 mm, an obvious phenomenon of break wires appears on the surface, which corresponds to the results shown in Figure 10(a). Additionally, the surface becomes a bigger groove and more flat as shown in Figure 11(e). From the images of partial detail, when the stroke is small (10 and 20 mm), the plastic deformation is more obvious on the surface and with the increase in stroke, the wear becomes more serious, more and more cracks and pits occur on the surface, which indicates that the wear debris plays different roles under different strokes. As the wear debris is not easy to discharge in the case of small stroke, the sliding extrusion makes them stay on the surface and causes larger plastic deformation, which also results in large friction force. However, there are less wear debris on the surface when the stroke is larger; it plays an important role on lubrication and causes more pits during the sliding friction, but the surface is more smooth in the direction of sliding, then the friction force is smaller, which corresponds to the variation of the coefficient of friction in Figure 6(b). Furthermore, in the case of large stroke, the major wear mechanisms are adhesive wear and abrasive wear. However, when the stroke is fixed (70 mm), with the velocity increases from 6 to 42 mm/s, the wear region is decreasing, and their surface are more complete, but the surface topography is more complex as shown in Figure 11(e)–(i). It is clear from the partial detail graph that there are a lot of obvious furrows in the direction of motion and severe plastic deformations in the wear region; additionally, the pits on the wear surface are larger. However, when the velocity is small (6–18 mm), the micro cutting on the wear region is more severe, but, with the velocity increases to 42 mm/s, the surface damage becomes small and the furrows become less, which correspond to the little coefficient of friction in Figure 6(a). Maybe the reason is that as the temperature is lower and the wear debris is little and hard, it is easier to cause serious micro cutting and spalling. However, in the case of high velocity, the temperature in the wear region is higher, which makes the debris become soft and undergo a large plastic deformation during the sliding friction, then bond on the wear surface which may protect the contact surface and reduce the wearing, this is correspond to the results shown in Figure 10(a). Furthermore, from Figure 11(a) and (i)–(l), it can be seen that as the velocity and stroke increase simultaneously (from 10 mm, 6 mm/s to 70 mm, 42 mm/s), the wear regions are small and have little changes, which corresponds to the variation of projection area in Figure 9(b). In addition, the pits, furrows, plastic deformation, and spalling are all obvious in this situation. However, it can also be seen that the characteristics of the surface morphology mainly depend on the velocity, which corresponds to the change of coefficient of friction as shown in Figure 6(c). Therefore, the results observed indicate that the effect of velocity on the worn morphology is more obvious and the velocity and stroke increase in both will not make the wear more severe. However, in actual working conditions, large stroke and high velocity exist at the same time is better than the condition of large stroke exists alone for the aim to prolong the service life of wire rope.

Industrial microscope images of sliding wear scars of upper loading rope under different conditions.
The industrial microscope images of sliding wear scars of axial sliding rope for different velocity and stroke are presented in Figure 12, their magnification is 96. Different from the upper loading rope, the size of wear scar of axial sliding rope depends on the value of stroke. It can be seen that the pits, furrows, and spalling are the main damage characteristics, but the performance of them are different with the change of velocity and stroke. When the velocity is identical (6 mm/s), with the increase in stroke, the pits and furrows in the direction of sliding become more obvious. However, as the stroke stability is 70 mm, higher velocity can cause very smooth surface at the edge of the wear region as shown in Figure 12(g), which gives a good explanation to why higher velocity is beneficial to reduce the wear because in the case of fast sliding speed, the plastic deformation and micro cutting are diminished. Additionally, the smooth surface can protect the wear region, which is not easy to be broken. Moreover, when the velocity and stroke increase simultaneously, the furrows become very obvious and its distribution is complex which is not in the direction of sliding as shown in Figure 12(i) and (k). It indicates that in the case of high velocity and large stroke, the sliding trace of the contact surface is changing, which is not beneficial to the increase in wear depth as shown in Figure 10(b). Therefore, it can be observed that the wear mechanisms of wire rope include abrasive wear and adhesive wear, and the effect of large stroke on the damage of wire rope is more obvious.

Industrial microscope images of sliding wear scars of axial sliding ropes under different conditions.
Conclusion
The present studies of the tribological characteristics between winding hoisting rope under different sliding parameters revealed the following findings:
The coefficient of friction changes with a more wide range with the variation of sliding velocity, and it has a minimum value at the velocity of 18 mm/s, which is 0.708. With the increase in velocity and stroke simultaneously, the coefficient of friction decreases from 0.721 to 0.524 at stable stage.
The temperature rise increases from 3.43°C to 13.73°C with the velocity at stable stage, and the stroke has little influence on the temperature rise. The influence of the velocity and stroke increase at the same time on the variation of temperature rise is similar to the influence of velocity.
The variation of maximum projection area and wear depth of wear scars of upper loading rope are opposite with an increase in velocity and stroke, respectively. Additionally, with the increase in velocity and stroke simultaneously, the damage in the wear region does not become more severe.
The wear mechanisms between winding hoisting ropes include abrasive wear and adhesive wear; moreover, its wear characteristics are plastic deformation, pits, furrows, broken wire, cracking, and spalling. The effect of velocity on the worn morphology is more obvious and with the increase in velocity and stroke simultaneously, the wear region does not enlarge.
Footnotes
Acknowledgements
The authors gratefully acknowledge the help and support of Top-notch Academic Programs Project of Jiangsu Higher Education Institutions (TAPP) and the Priority Academic Program Development of Jiangsu Higher Education Institutions (PAPD).
Academic Editor: Pranab Samanta
Declaration of conflicting interests
The author(s) declared no potential conflicts of interest with respect to the research, authorship, and/or publication of this article.
Funding
The author(s) disclosed receipt of the following financial support for the research, authorship, and/or publication of this article: This research received the financial supports from National Key Basic Research Programme of China (973 programme no. 2014CB049403), National key research and development program (2016YFC0600905) and National Natural Science Foundation of China (no. 51475458).